


Json数据格式
pyecharts模块
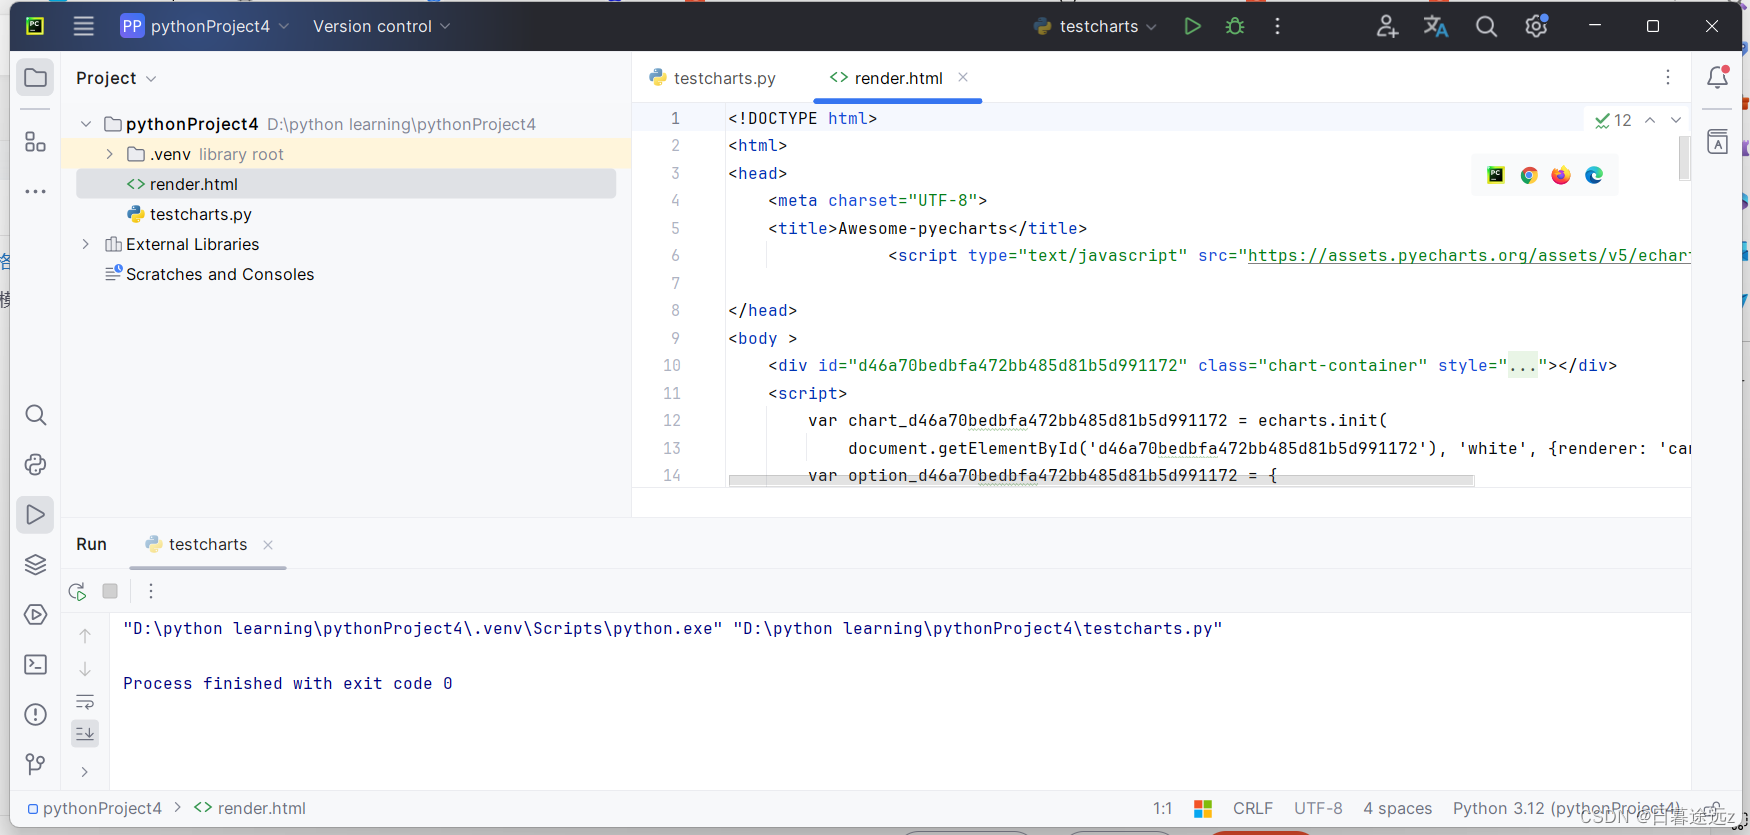
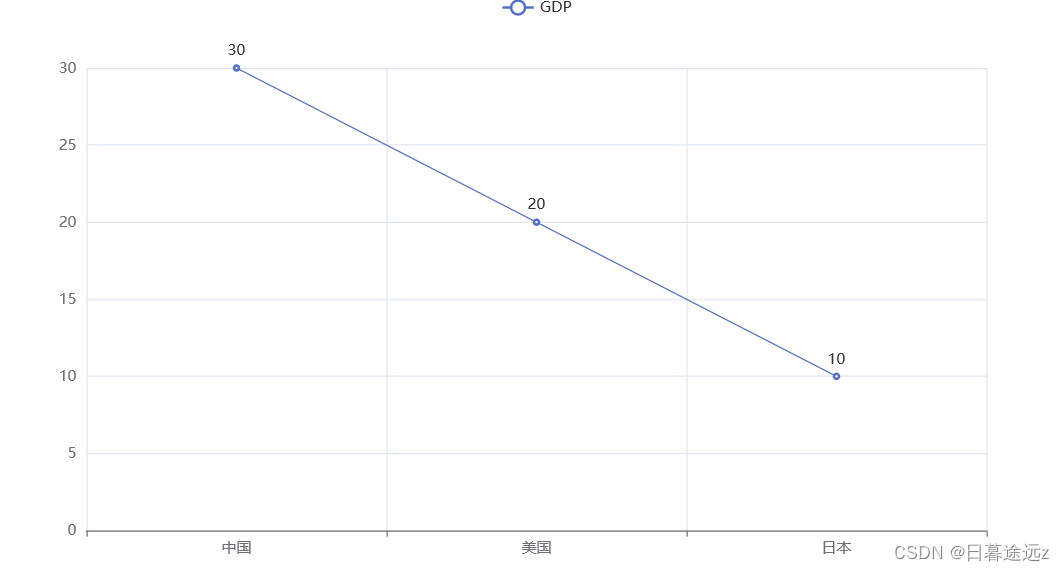
from pyecharts.charts import Line
line = Line()
line.add_xaxis((["中国","美国","日本"]))
line.add_yaxis("GDP",[30,20,10])
line.render()
快速入门
使用网页打开 即可得到折线图案
from pyecharts.charts import Line
from pyecharts.options import TitleOpts,LegendOpts,ToolboxOpts,VisualMapOpts
line = Line()
line.add_xaxis((["中国","美国","日本"]))
line.add_yaxis("GDP",[30,20,10])
line.set_global_opts(
    title_opts=TitleOpts(title="GDP变化示意图",pos_left="center",pos_bottom="1%"),
    legend_opts=LegendOpts(is_show=True),
    toolbox_opts=ToolboxOpts(is_show=True),
    visualmap_opts=VisualMapOpts(is_show=True)
)
line.render()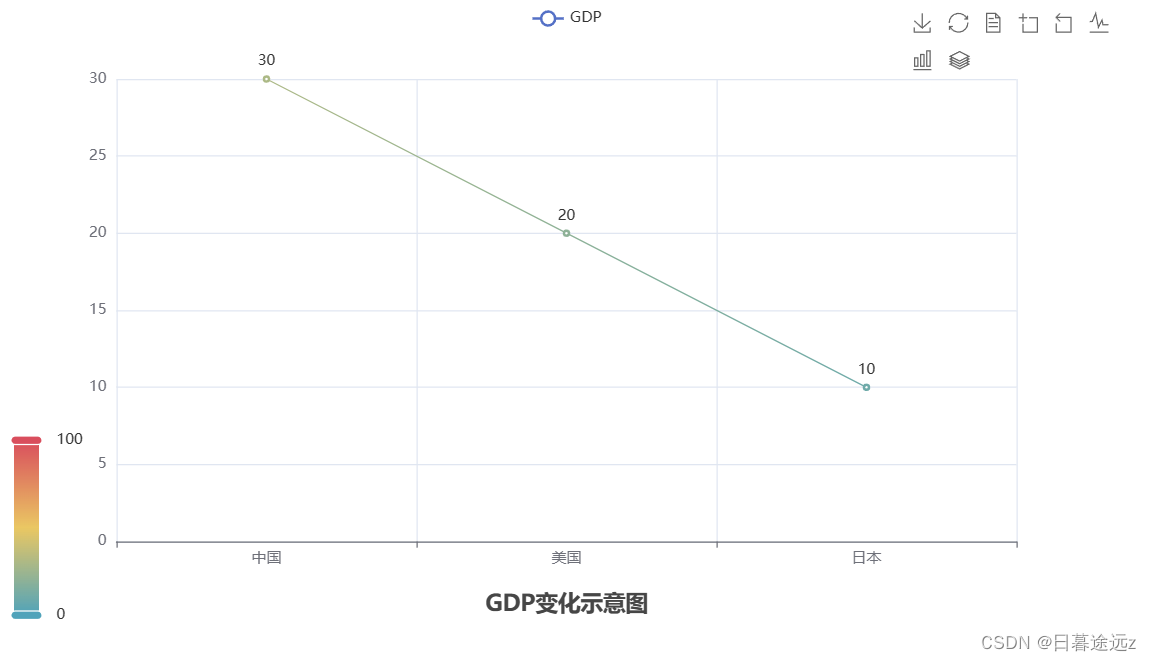


 333
333


 被折叠的 条评论
为什么被折叠?
被折叠的 条评论
为什么被折叠?
 到【灌水乐园】发言


