


R语言ggplot2中的一些细节问题
绘制散点图时点的形状
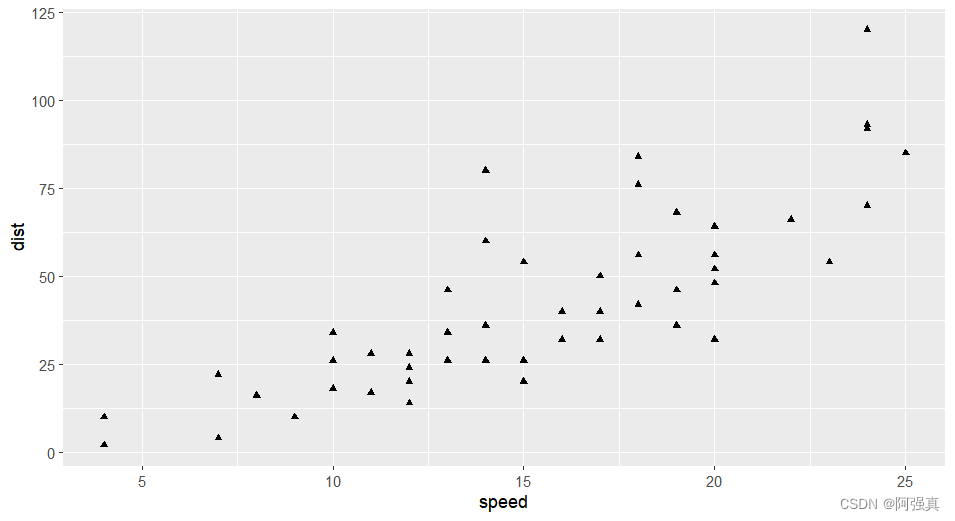
以示例数据cars为例
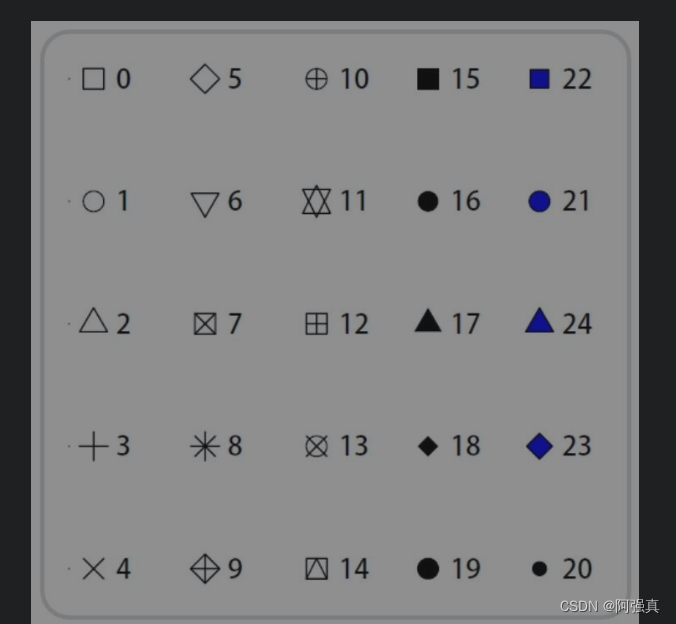
cars
library(tidyverse)
ggplot(cars,aes(speed,dist))+geom_point(shape=17)
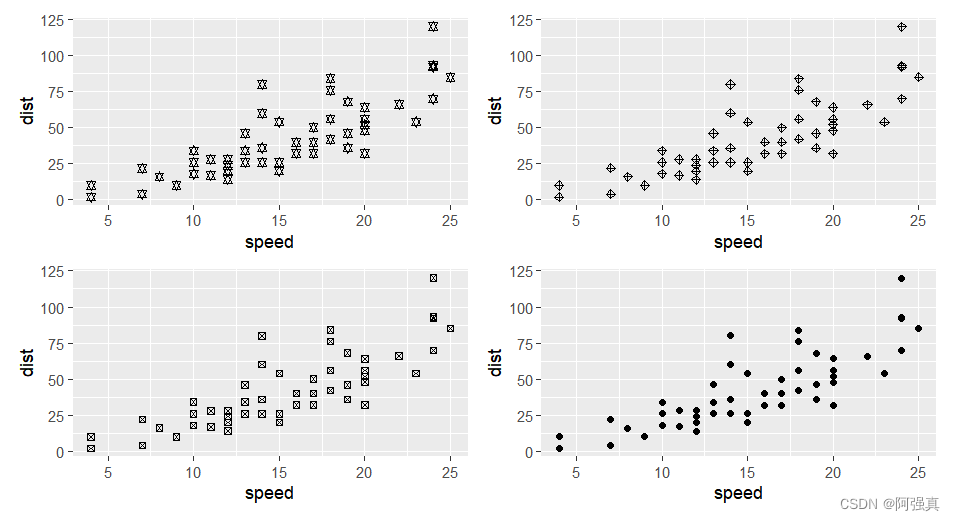
library(patchwork)
a <- ggplot(cars,aes(speed,dist))+geom_point(shape=11)
b <- ggplot(cars,aes(speed,dist))+geom_point(shape=9)
c <- ggplot(cars,aes(speed,dist))+geom_point(shape=7)
d <- ggplot(cars,aes(speed,dist))+geom_point(shape=19)
(a+b)/(c+d)
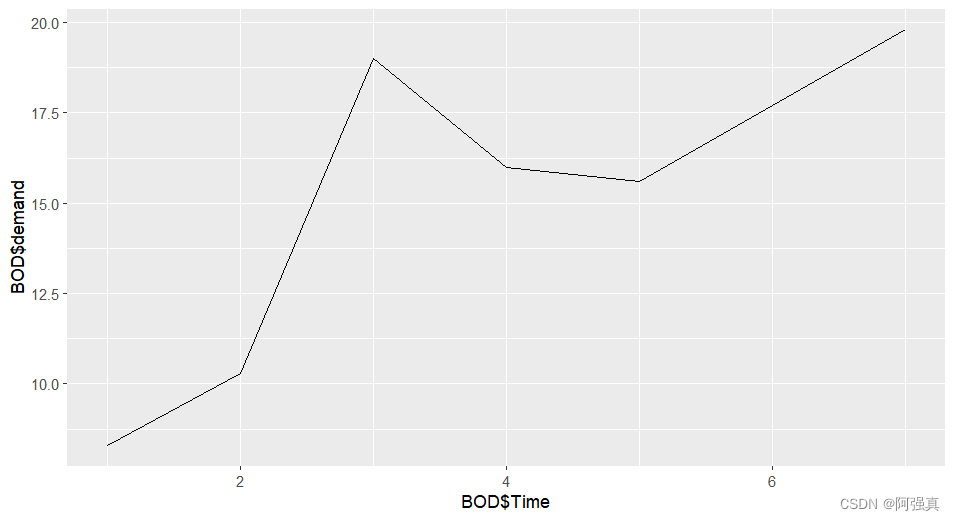
条形图设置y轴范围,添加数据标记
示例数据BOD
BOD
ggplot(BOD,aes(Time,demand))+geom_line()
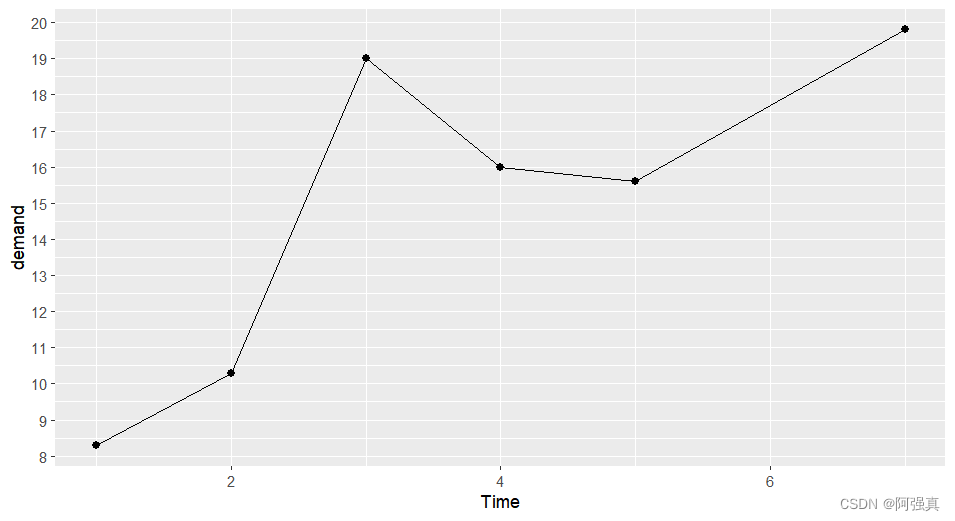
调整y轴范围从0开始,添加标记
ggplot(BOD,aes(Time,demand))+geom_line()+
  scale_y_continuous(breaks = seq(0,20,1))+
  geom_point(size=2)
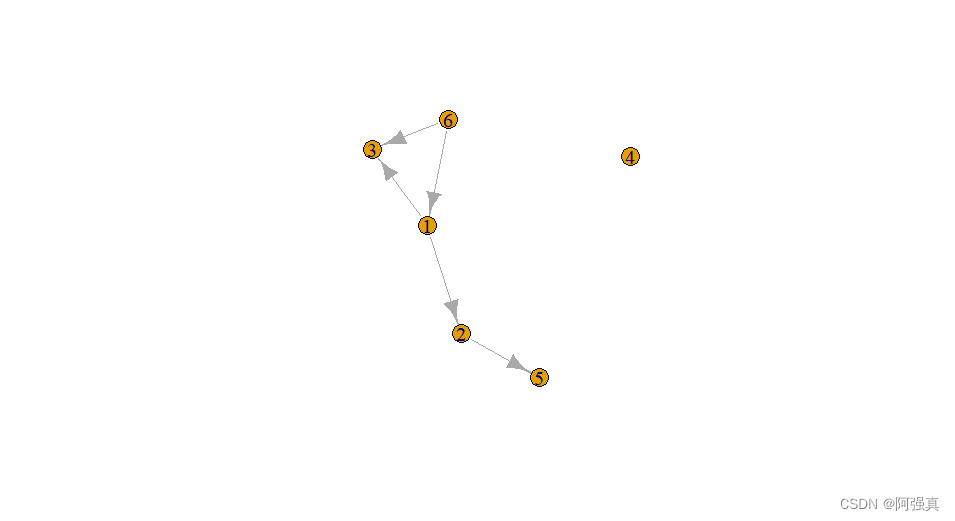
网络图添加标签
install.packages("igraph")
library(igraph)
graph(c(6,1,6,3,1,3,1,2,2,5)) %>% plot()


 5682
5682


 被折叠的 条评论
为什么被折叠?
被折叠的 条评论
为什么被折叠?
 到【灌水乐园】发言


