


本文以iris数据为例,制作群峰图
首先加载包
install.packages('ggbeeswarm')
library(ggbeeswarm)
iris
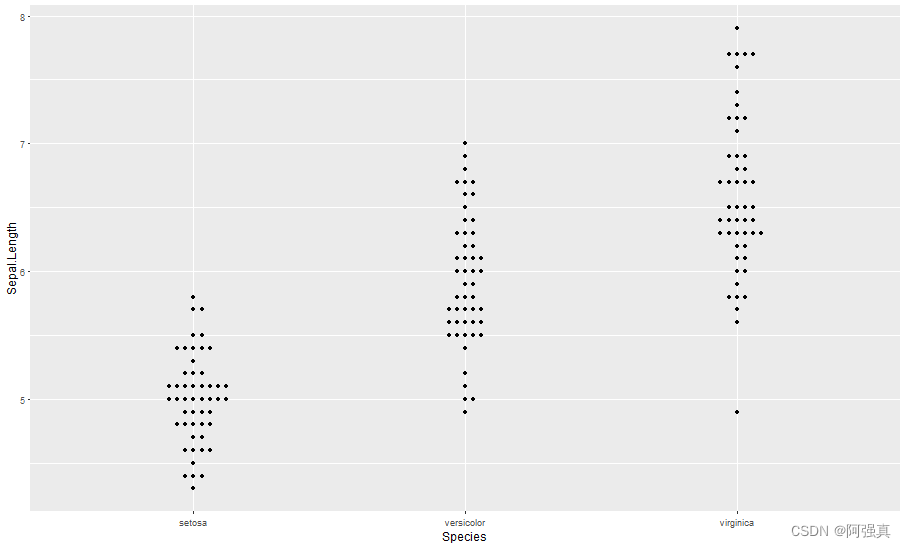
简单群峰图的绘制
ggplot(iris,aes(Species,Sepal.Length))+
  geom_beeswarm()
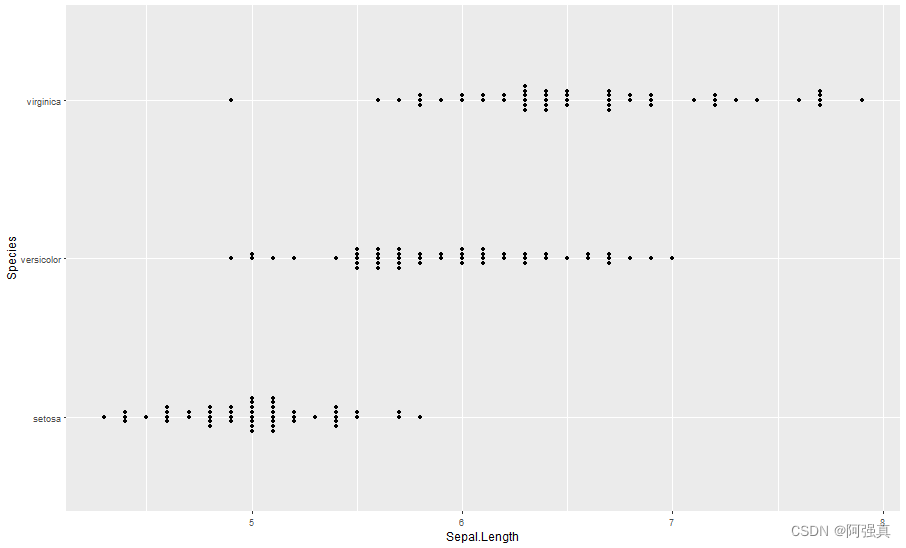
横置,首先交换x和y
ggplot(iris,aes(Sepal.Length,Species))+
  geom_beeswarm(groupOnX=F)
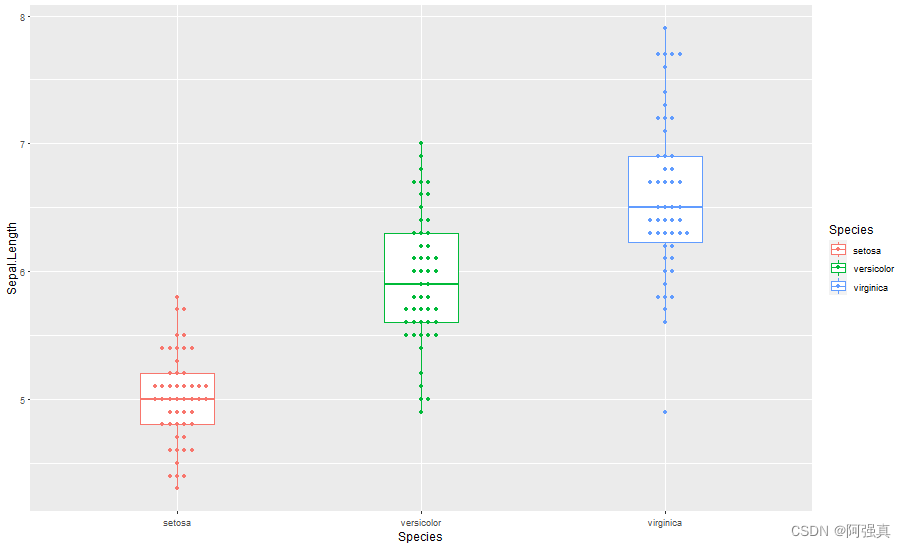
与箱线图相结合
ggplot(iris,aes(Species,Sepal.Length,color=Species))+
  geom_boxplot(width=0.3)+
  geom_beeswarm()
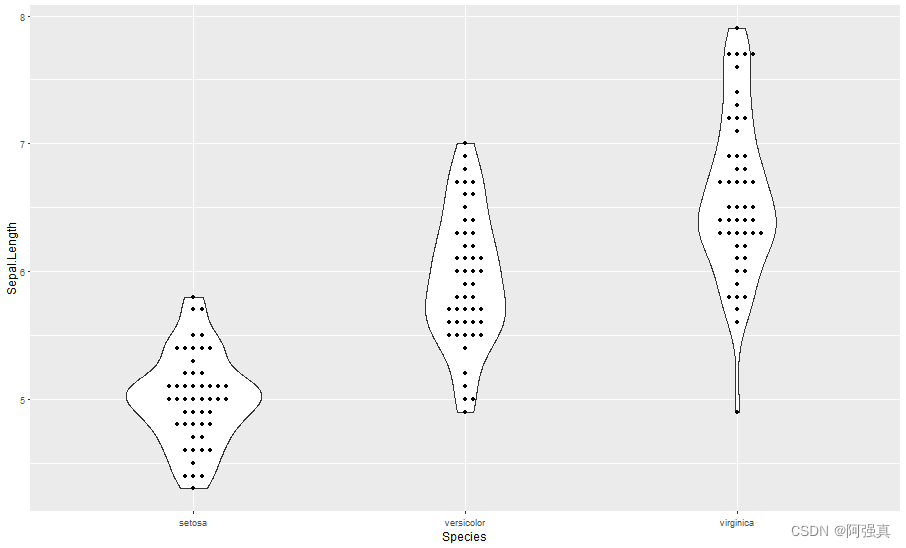
与小提琴图相结合
ggplot(iris,aes(Species,Sepal.Length,,color=Species))+
  geom_violin(width=0.5)+
  geom_beeswarm()
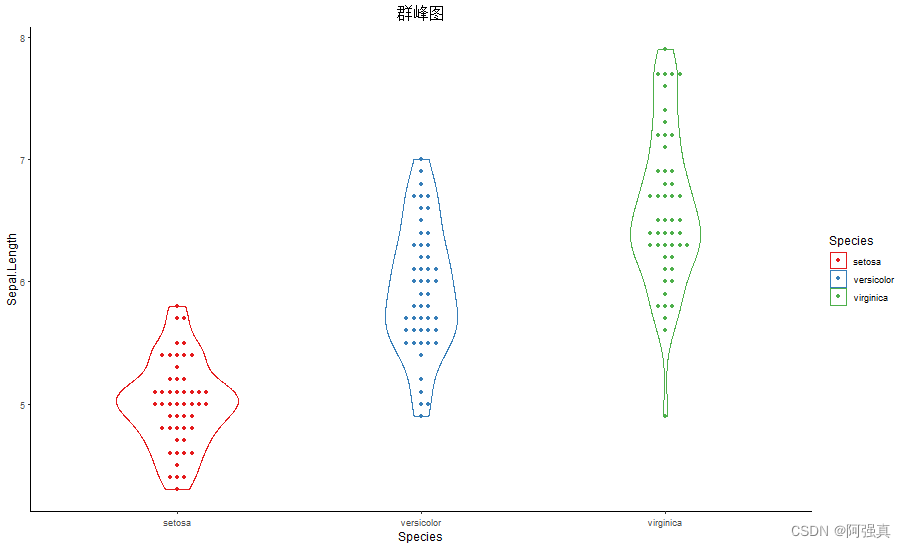
改变组件的颜色,主题
ggplot(iris,aes(Species,Sepal.Length,color=Species))+
  geom_violin(width=0.5)+
  geom_beeswarm()+
  theme_classic()+
  scale_color_brewer(palette = "Set1")+
  labs(title = "群峰图")+#添加标题
  theme(plot.title = element_text(hjust=0.5,size=15))
参考链接:https://mp.weixin.qq.com/s/duCERhZItVi_YbuRj4SKhg


 581
581


 被折叠的 条评论
为什么被折叠?
被折叠的 条评论
为什么被折叠?
 到【灌水乐园】发言


