


简介
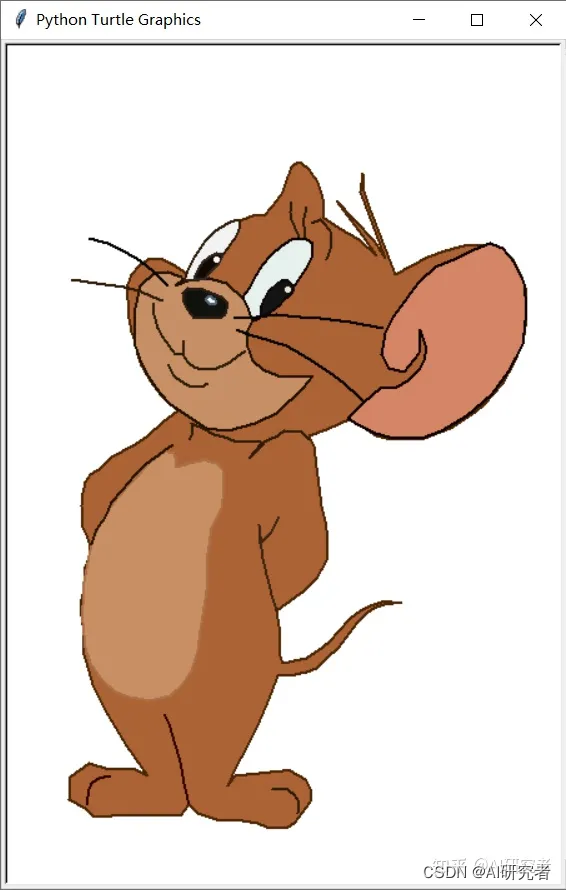
写一段Python代码画出猫和老鼠动画片中的杰瑞,仅仅使用turtle库。如下:

绘画过程可以在下列平台查看:
抖音:用代码画一只杰瑞
b站:用代码画一只杰瑞_哔哩哔哩_bilibili
代码
# coding=gbk

import turtle

def plotLine(points, pencolor=None, width=None, speed=None):
    '''
    功能:画折线
    参数:
    - points : 一系列点,用列表或元组表示
    - pencolor : 画笔颜色,默认不变
    - width : 画笔宽度,默认不变
    - speed : 绘制速度,默认不变
    '''
    # 记录旧参数
    oldpencolor = turtle.pencolor()
    oldwidth = turtle.width()
    oldspeed = turtle.speed()

    # 修改新参数
    if pencolor is not None:
        turtle.pencolor(pencolor)
    if width is not None:
        turtle.width(width)
    if speed is not None:
        turtle.speed(speed)

    # 绘制折线
    turtle.up()
    turtle.goto(points[0])
    turtle.down()
    for point in points[1:]:
        turtle.goto(point)

    # 恢复旧参数
    turtle.pencolor(oldpencolor)
    turtle.width(oldwidth)
    turtle.speed(oldspeed)


def plotPoly(points, fill=False, pencolor=None, fillcolor=None,
             width=None, speed=None):
    '''
    功能:绘制封闭多边形
    '''
    # 保存旧参数
    oldfillcolor = turtle.fillcolor()

    # 更新新参数
    if fillcolor is not None:
        turtle.fillcolor(fillcolor)

    # 绘制封闭多边形
    points_plotline = list(points) + [points[0]]
    if fill:
        turtle.begin_fill()
        plotLine(points_plotline, pencolor, width, speed)
        turtle.end_fill()
    else:
        plotLine(points_plotline, pencolor, width, speed)

    # 恢复旧参数
    turtle.fillcolor(oldfillcolor)

# 设置一些参数
turtle.setup(452, 680, 100, 100)

# 绘制

points = [
    (8, 245), (3, 241), (0, 233), (-4, 221), (-9, 214),
    (-18, 203), (-28, 202), (-38, 198), (-46, 196), (-54, 191),
    (-64, 184), (-71, 174), (-76, 165), (-81, 156), (-90, 162),
    (-100, 167), (-112, 167), (-119, 162), (-125, 155), (-128, 147),
    (-128, 135), (-127, 120), (-125, 109), (-123, 104), (-120, 91),
    (-117, 82), (-110, 70), (-101, 58), (-88, 46), (-100, 37),
    (-113, 25), (-124, 18), (-141, 9), (-151, -1), (-158, -5),
    (-162, -11), (-164, -20), (-165, -30), (-164, -37), (-164, -47),
    (-161, -53), (-159, -59), (-158, -68), (-162, -79), (-162, -91),
    (-165, -105), (-165, -118), (-163, -132), (-163, -149), (-156, -173),
    (-144, -197), (-129, -222), (-129, -222), (-112, -246), (-122, -241),
    (-143, -241), (-143, -241), (-143, -241), (-159, -236), (-174, -247),
    (-175, -265), (-162, -272), (-155, -279), (-141, -278), (-97, -278),
    (-86, -278), (-79, -269), (-72, -276), (-54, -282), (-36, -282),
    (-24, -284), (-14, -288), (-1, -288), (6, -283), (11, -276),
    (18, -267), (19, -258), (14, -249), (2, -242), (-4, -242),
    (-42, -246), (-48, -254), (-44, -245), (-37, -231), (-25, -208),
    (-14, -182), (-8, -166), (6, -165), (15, -163), (23, -160),
    (30, -153), (41, -143), (47, -135), (55, -124), (64, -115),
    (71, -111), (77, -109), (84, -108), (91, -108), (83, -107),
    (75, -107), (66, -110), (58, -114), (50, -120), (41, -130),
    (34, -138), (27, -144), (15, -152), (-4, -156), (-6, -150),
    (-6, -133), (-9, -114), (13, -98), (23, -88), (31, -74),
    (32, -56), (30, -42), (27, -30), (23, 1), (21, 18),
    (17, 26), (31, 31), (40, 35), (49, 39), (62, 32),
    (71, 26), (83, 23), (109, 24), (130, 32), (150, 45),
    (158, 52), (172, 68), (182, 86), (189, 106), (190, 113),
    (191, 142), (186, 156), (180, 167), (172, 173), (164, 178),
    (141, 178), (126, 174), (112, 169), (101, 163), (86, 155),
    (66, 207), (61, 222), (60, 236), (58, 221), (78, 168),
    (69, 182), (39, 214), (62, 183), (71, 170), (57, 183),
    (43, 191), (29, 200), (28, 216), (24, 229), (17, 239),
    (11, 244),
    ]
plotPoly(points, True, pencolor=(0.3, 0.15, 0.02),
         fillcolor=(0.67, 0.39, 0.21), width=2)

points = [
    (-90, 146), (-80, 150), (-63, 152), (-49, 148), (-35, 135),
    (-28, 119), (-32, 110), (-32, 97), (-28, 86), (-20, 79),
    (-8, 74), (6, 73), (20, 74), (12, 64), (-9, 44),
    (-26, 36), (-48, 30), (-65, 32), (-79, 41), (-95, 52),
    (-105, 64), (-113, 76), (-118, 87), (-122, 98), (-122, 114),
    (-122, 128), (-118, 146), (-107, 156), (-96, 157), (-85, 153),
    (-84, 151),
    ]
plotPoly(points, True, pencolor=(0.13, 0.06, 0.0),
         fillcolor=(0.78, 0.56, 0.4), width=2)

points = [
    (-75, 120), (-55, 120), (-50, 123), (-48, 132), (-53, 137),
    (-68, 143), (-80, 144), (-84, 140), (-83, 133), (-80, 127),
    ]
plotPoly(points, True, pencolor=(0.17, 0.11, 0.07),
         fillcolor=(0.06, 0.07, 0.05), width=2)

points = [
    (-65, 136), (-64, 137), (-61, 137), (-58, 135), (-57, 133),
    (-58, 131), (-59, 131), (-61, 131), (-63, 132), (-64, 133),
    (-65, 134),
    ]
plotPoly(points, True, pencolor=(0.33, 0.39, 0.45),
         fillcolor=(0.93, 0.99, 1.0), width=2)

points = [
    (-107, 132), (-107, 123), (-104, 112), (-100, 105), (-95, 98),
    (-90, 91), (-84, 91), (-83, 102), (-84, 91), (-80, 85),
    (-75, 81), (-69, 79), (-60, 79), (-52, 82), (-46, 85),
    (-41, 89), (-34, 94),
    ]
plotLine(points, pencolor=(0.18, 0.11, 0.04), width=2)

points = [
    (-96, 83), (-91, 74), (-86, 70), (-79, 66), (-72, 65),
    (-67, 66), (-64, 68),
    ]
plotLine(points, pencolor=(0.18, 0.11, 0.04), width=2)

points = [
    (-36, 137), (-30, 145), (-25, 155), (-20, 163), (-13, 171),
    (-5, 178), (3, 183), (14, 184), (20, 180), (20, 171),
    (16, 162), (6, 147), (2, 141), (-2, 136), (-7, 132),
    (-14, 127), (-22, 121), (-26, 118), (-29, 120), (-32, 129),
    ]
plotPoly(points, True, pencolor=(0.06, 0.01, 0.0),
         fillcolor=(0.9, 0.94, 0.93), width=2)

points = [
    (-38, 198), (-43, 198), (-48, 196), (-51, 194), (-58, 190),
    (-62, 186), (-66, 182), (-70, 176), (-74, 170), (-77, 164),
    (-80, 158), (-82, 152), (-83, 150), (-76, 150), (-71, 151),
    (-67, 151), (-63, 156), (-59, 160), (-56, 165), (-51, 172),
    (-46, 179), (-41, 186), (-39, 191),
    ]
plotPoly(points, True, pencolor=(0.18, 0.11, 0.04),
         fillcolor=(0.95, 0.95, 0.95), width=2)

points = [
    (-75, 151), (-67, 151), (-63, 156), (-59, 160), (-55, 164),
    (-52, 171), (-57, 172), (-61, 170), (-64, 168), (-68, 165),
    (-70, 162), (-71, 160), (-74, 154),
    ]
plotPoly(points, True, pencolor=(0.17, 0.14, 0.12),
         fillcolor=(0.08, 0.03, 0.01), width=2)

points = [
    (-22, 121), (-21, 130), (-19, 135), (-15, 142), (-10, 146),
    (-5, 150), (0, 150), (5, 145), (4, 141), (1, 138),
    (-3, 135), (-6, 131), (-10, 128), (-14, 125), (-17, 123),
    ]
plotPoly(points, True, pencolor=(0.07, 0.02, 0.03),
         fillcolor=(0.08, 0.08, 0.08), width=2)

points = [
    (9, 185), (6, 192), (3, 199), (2, 205), (3, 213),
    ]
plotLine(points, pencolor=(0.18, 0.11, 0.04), width=2)

points = [
    (14, 185), (13, 194), (13, 200), (15, 209),
    ]
plotLine(points, pencolor=(0.18, 0.11, 0.04), width=2)

points = [
    (19, 196), (26, 199), (30, 195), (33, 191), (35, 188),
    (35, 181), (34, 175), (31, 167),
    ]
plotLine(points, pencolor=(0.18, 0.11, 0.04), width=2)

points = [
    (-173, 151), (-153, 148), (-131, 145), (-119, 142), (-108, 137),
    (-100, 134),
    ]
plotLine(points, pencolor=(0.18, 0.11, 0.04), width=2)

points = [
    (-96, 146), (-107, 157), (-118, 166), (-130, 173), (-144, 180),
    (-159, 184),
    ]
plotLine(points, pencolor=(0.02, 0.02, 0.02), width=2)

points = [
    (-41, 111), (-31, 107), (-14, 102), (-1, 98), (11, 91),
    (21, 85), (33, 77), (45, 68), (56, 58), (68, 47),
    ]
plotLine(points, pencolor=(0.02, 0.02, 0.02), width=2)

points = [
    (-43, 120), (-25, 121), (-9, 123), (10, 121), (26, 120),
    (50, 117), (76, 112),
    ]
plotLine(points, pencolor=(0.02, 0.02, 0.02), width=2)

points = [
    (162, 180), (147, 174), (135, 168), (118, 161), (105, 149),
    (96, 137), (85, 122), (78, 108), (75, 91), (81, 80),
    (93, 77), (105, 92), (106, 111), (111, 96), (109, 86),
    (105, 79), (96, 70), (87, 65), (74, 64), (61, 53),
    (48, 40), (56, 35), (70, 28), (85, 24), (107, 24),
    (123, 30), (143, 42), (163, 59), (176, 77), (188, 99),
    (191, 128), (189, 148), (181, 165), (172, 176),
    ]
plotPoly(points, True, pencolor=(0.05, 0.0, 0.0),
         fillcolor=(0.83, 0.52, 0.4), width=2)

points = [
    (-98, 14), (-110, 5), (-123, -9), (-136, -23), (-147, -39),
    (-156, -57), (-159, -70), (-163, -91), (-164, -110), (-164, -123),
    (-162, -143), (-158, -156), (-149, -169), (-138, -179), (-127, -183),
    (-110, -186), (-94, -182), (-85, -174), (-77, -162), (-72, -146),
    (-70, -130), (-65, -98), (-64, -68), (-61, -48), (-53, -32),
    (-51, -18), (-52, -1), (-57, 4), (-64, 6), (-70, 6),
    (-79, 4), (-89, 1), (-89, 6), (-91, 12),
    ]
plotPoly(points, True, pencolor=(0.67, 0.43, 0.27),
         fillcolor=(0.78, 0.56, 0.39), width=2)

points = [
    (-79, 23), (-76, 28), (-77, 36), (-66, 31), (-59, 27),
    (-51, 25), (-43, 22), (-35, 21), (-22, 21), (-19, 20),
    (-31, 8), (-21, 20), (-15, 23), (-8, 26), (-3, 30),
    (11, 29), (17, 23),
    ]
plotLine(points, pencolor=(0.18, 0.11, 0.04), width=2)

points = [
    (-92, 19), (-103, 11), (-114, 3), (-122, -5), (-132, -17),
    (-141, -27), (-146, -39), (-153, -49), (-157, -61),
    ]
plotLine(points, pencolor=(0.16, 0.07, 0.01), width=2)

points = [
    (-7, -39), (-14, -52), (-22, -60), (-23, -45), (-21, -64),
    (-20, -72), (-17, -85), (-15, -92), (-13, -101), (-9, -113),
    ]
plotLine(points, pencolor=(0.23, 0.14, 0.07), width=2)

points = [
    (-99, -197), (-95, -204), (-91, -218), (-86, -235), (-83, -252),
    (-80, -265), (-79, -268),
    ]
plotLine(points, pencolor=(0.18, 0.01, 0.0), width=2)

points = [
    (-142, -246), (-151, -248), (-157, -252), (-159, -257), (-160, -263),
    (-160, -269),
    ]
plotLine(points, pencolor=(0.18, 0.0, 0.0), width=2)

points = [
    (-13, -257), (0, -257), (5, -261), (8, -265), (9, -269),
    (9, -272), (8, -276),
    ]
plotLine(points, pencolor=(0.18, 0.11, 0.04), width=2)

turtle.up()
turtle.goto((0, 143))
turtle.down()
turtle.pencolor((0.9, 0.91, 0.85))
turtle.dot(5)

turtle.up()
turtle.goto((-57, 167))
turtle.down()
turtle.pencolor((1.0, 0.95, 0.95))
turtle.dot(5)


# 隐藏海龟
turtle.hideturtle()
turtle.done()
运行效果
备注
视频已发布到抖音和 b 站。抖音和b站名称:会代码的依古比古。
抖音视频网址:用代码画一只杰瑞
b站视频网址:用代码画一只杰瑞_哔哩哔哩_bilibili
欢迎各位关注抖音和b站!!!可以及时获取最新消息!!!


 2674
2674


 被折叠的 条评论
为什么被折叠?
被折叠的 条评论
为什么被折叠?
 到【灌水乐园】发言


