


export let barChartOptions = {
    ...basicOptions,
    tooltips: {
        backgroundColor: '#f5f5f5',
        titleFontColor: '#333',
        bodyFontColor: '#666',
        bodySpacing: 4,
        xPadding: 12,
        mode: 'nearest',
        intersect: 0,
        position: 'nearest'
    },
    legend: {
        display: false
    },
    scales: {
        yAxes: [
            {
                gridLines: {
                    drawBorder: false,
                    color: 'rgba(29,140,248,0.1)',
                    zeroLineColor: 'transparent'
                },
                ticks: {
                    suggestedMin: 0,
                    suggestedMax: 120,
                    stepSize: 50,  //配置Y轴的刻度最小值
                    maxTicksLimit: 6,

                    padding: 20,
                    fontColor: '#9e9e9e'
                }
            }
        ],
        xAxes: [
            {
                gridLines: {
                    drawBorder: false,
                    color: 'rgba(29,140,248,0.1)',
                    zeroLineColor: 'transparent'
                },
                ticks: {
                    padding: 20,
                    fontColor: '#9e9e9e'
                }
            }
        ]
    }
};
export let pieChartOptions = {
...basicOptions,
tooltips: { //滑过的显示数据
backgroundColor: '#f5f5f5',
titleFontColor: '#333',
bodyFontColor: '#666',
bodySpacing: 4,
xPadding: 12,
mode: 'nearest',
intersect: 0,
position: 'nearest'
},
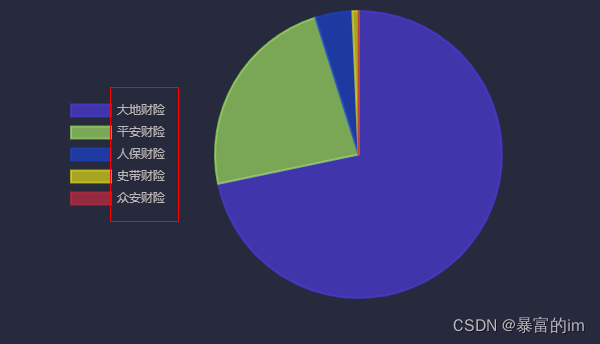
legend: {
display: true,
position: 'left', //配置lables的位置
labels: {
fontColor: 'rgb(189, 184, 184)'
}
},
scales: {} //刻度
};这里是组件封装引用
export let pieChartOptions = {
    ...basicOptions,
    tooltips: {
        backgroundColor: '#f5f5f5',
        titleFontColor: '#333',
        bodyFontColor: '#666',
        bodySpacing: 4,
        xPadding: 12,
        mode: 'nearest',
        intersect: 0,
        position: 'nearest'
    },

    legend: {  //labels的位置以及颜色
        display: true,
        position: 'left',
        labels: {
            fontColor: 'rgb(189, 184, 184)'
        }
    },

    scales: {} //刻度
};
引用组件在文件后的使用方式
   let chartData = {
                        labels: pieShowLabel,
                        datasets: [
                            {
                                borderColor: [
                                    'rgba(74,58,218,0.7)',
                                    'rgba(156,221,95,0.7)',
                                    'rgba(25,66,202,0.7)',
                                    'rgba(219,216,20,0.7)',
                                    'rgba(194,41,66,0.7)',
                                    'rgba(226,131,212,0.7)'
                                ],
                                fill: true,
                                backgroundColor: [
                                    'rgba(74,58,218,0.7)',
                                    'rgba(156,221,95,0.7)',
                                    'rgba(25,66,202,0.7)',
                                    'rgba(219,216,20,0.7)',
                                    'rgba(194,41,66,0.7)',
                                    'rgba(226,131,212,0.7)'
                                ],
                                data: pieShowData
                            }
                        ]
                    };
// this.$refs.pieChar.updateGradients(chartData);
 this.pieChart.chartData = chartData;
这里是直接在文件中使用
     const ctx = document.getElementById('myChart4');
            new Chart(ctx, {
                type: 'doughnut',
                data: {
                    labels: this.SecondyuanhuanData.labels,
                    datasets: [
                        {
                            label: 'My First Dataset',
                            data: this.SecondyuanhuanData.data,
                            borderColor: this.SecondyuanhuanData.backgroundColor,
                            backgroundColor: this.SecondyuanhuanData.backgroundColor,
                            hoverOffset: 4
                        }
                    ]
                },
                options: {   //写在options里面
                    legend: {
                        display: true,
                        // position: 'left',
                        labels: {
                            fontColor: 'rgb(189, 184, 184)' //改变图例颜色
                        }
                    },
                    scales: {
                        y: {
                            beginAtZero: true
                        }
                    }
                }
            });
        },
labels


 2387
2387


 被折叠的 条评论
为什么被折叠?
被折叠的 条评论
为什么被折叠?
 到【灌水乐园】发言


