


机器准备
| prometheus-server | 192.168.252.143 | 主服务器(自监控和监控) |
| prometheus-node1 | 192.168.252.144 | 远程服务器(被监控) |
| grafana | 192.168.252.141 | 图像显示 |
一、安装Prometheus-Server
192.168.252.143 prometheus-server
同步时间
yum -y install ntp
ntpdate ntp.aliyun.com  同步阿里云的时间
安装prometheus
1.从github上获取安装包
 wget https://github.com/prometheus/prometheus/releases/download/v2.31.0-rc.0/prometheus-2.31.0-rc.0.linux-amd64.tar.gz
2.解压安装包到 /usr/local/目录下
 tar -xzvf prometheus-2.31.0-rc.0.linux-amd64.tar.gz  -C /usr/local/

3.重命名
cd /usr/local/
mv prometheus-2.31.0-rc.0.linux-amd64/ prometheus

4.创建存放数据的目录
mkdir -p prometheus/data
配置systemctl管理
1.编辑配置文件
vim /usr/lib/systemd/system/prometheus.service
[Unit]
Description=https://prometheus.io

[Service]
Restart=on-failure
ExecStart=/usr/local/prometheus/prometheus --storage.tsdb.path=/usr/local/prometheus/data --config.file=/usr/local/prometheus/prometheus.yml

[Install]
WantedBy=multi-user.target

2.备份prometheus的文件并启动设置开机自启
 cp /usr/local/prometheus/prometheus.yml /usr/local/prometheus/prometheus.yml.bak

systemctl daemon-reload
systemctl start prometheus
systemctl enable prometheus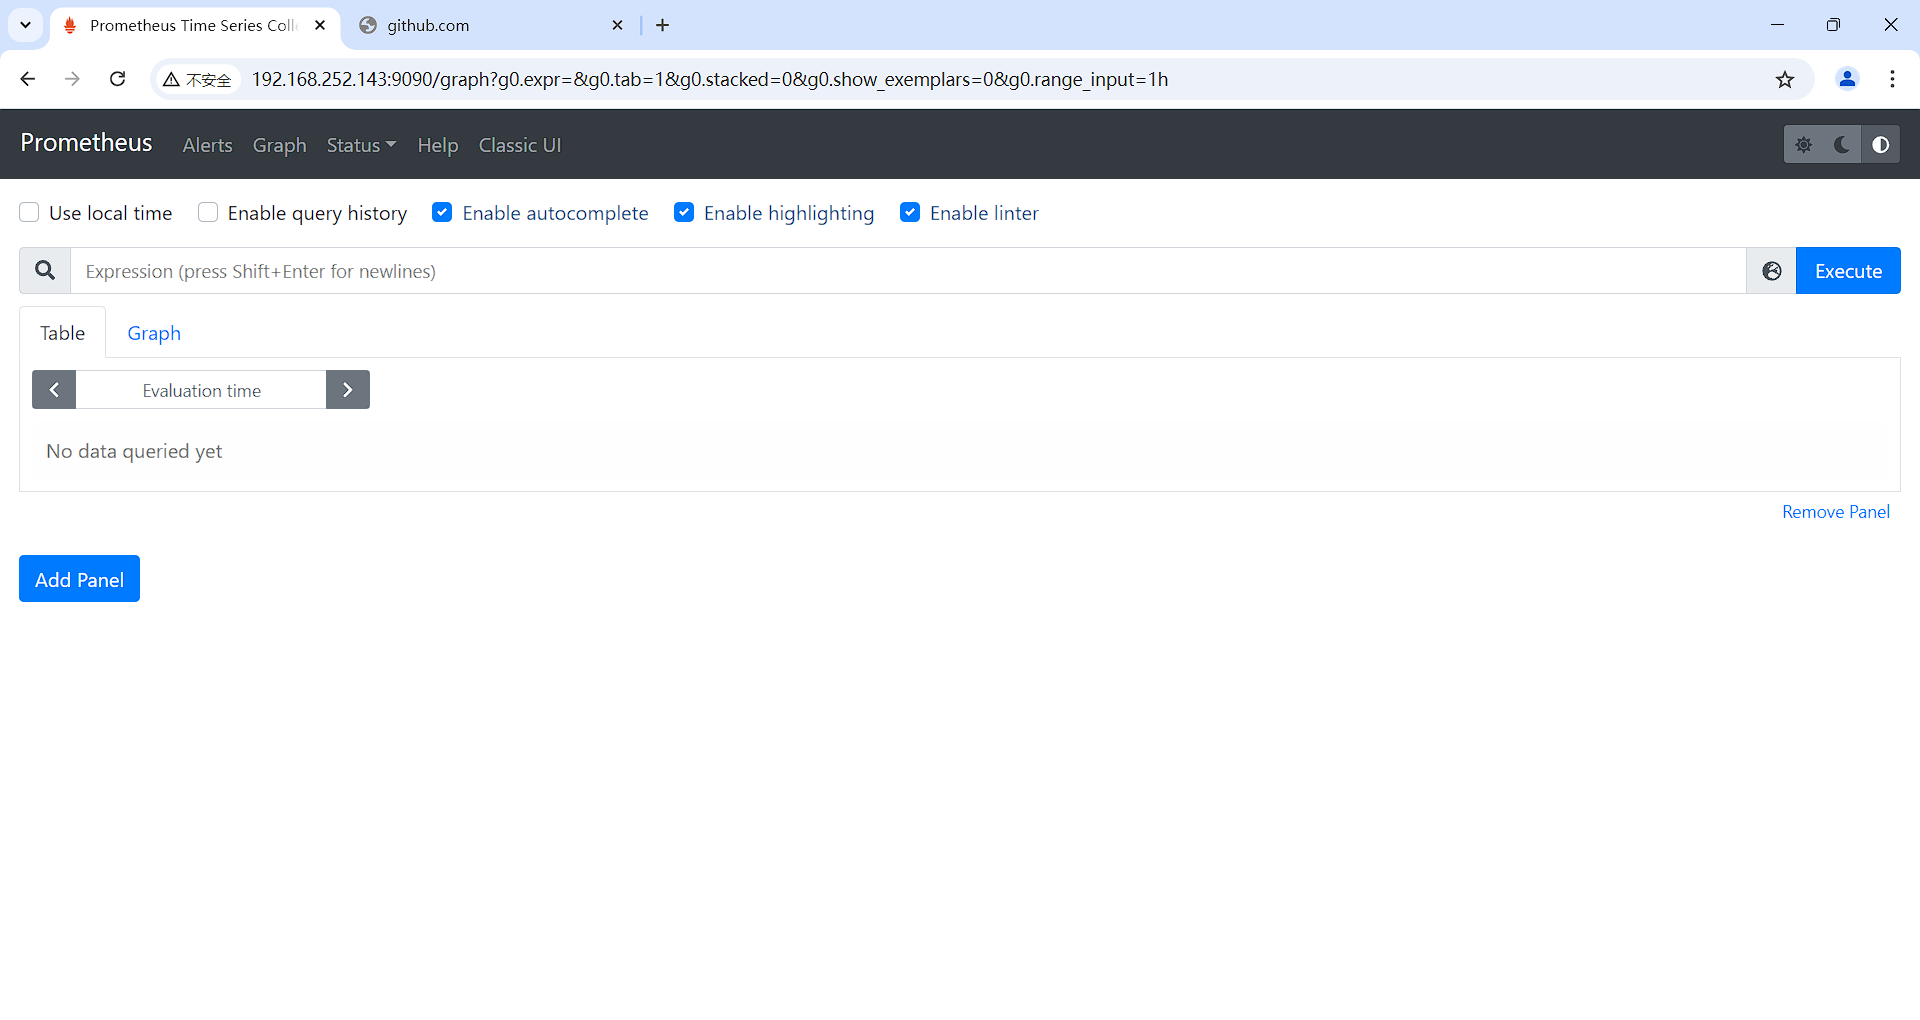
3.默认端口9090![]()
访问
http://192.168.252.143:9090
二、安装Prometheus-Node1
192.168.252.144 prometheus-node1
同步时间
yum -y install ntp
ntpdate ntp.aliyun.com  同步阿里云的时间
安装node_exporter
wget https://github.com/prometheus/node_exporter/releases/download/v1.2.2/node_exporter-1.2.2.linux-amd64.tar.gz

tar -xvzf node_exporter-1.2.2.linux-amd64.tar.gz  -C /usr/local/
cd /usr/local/
mv node_exporter-1.2.2.linux-amd64/ node_exporter
配置systemctl管理
1.编辑配置文件
vim /usr/lib/systemd/system/node_exporter.service

[Unit]
Description=Prometheusnode_exporter

[Service]
User=nobody
ExecStart=/usr/local/node_exporter/node_exporter --log.level=error
ExecStop=/usr/bin/killallnode_exporter

[Install]
WantedBy=default.target

2.启动
systemctl daemon-reload
systemctl start node_exporter
systemctl enable node_exporter
配置监控
192.168.252.143 prometheus-server
1.编辑配置文件
vim /usr/local/prometheus/prometheus.yml
在配置文件最后面添加:
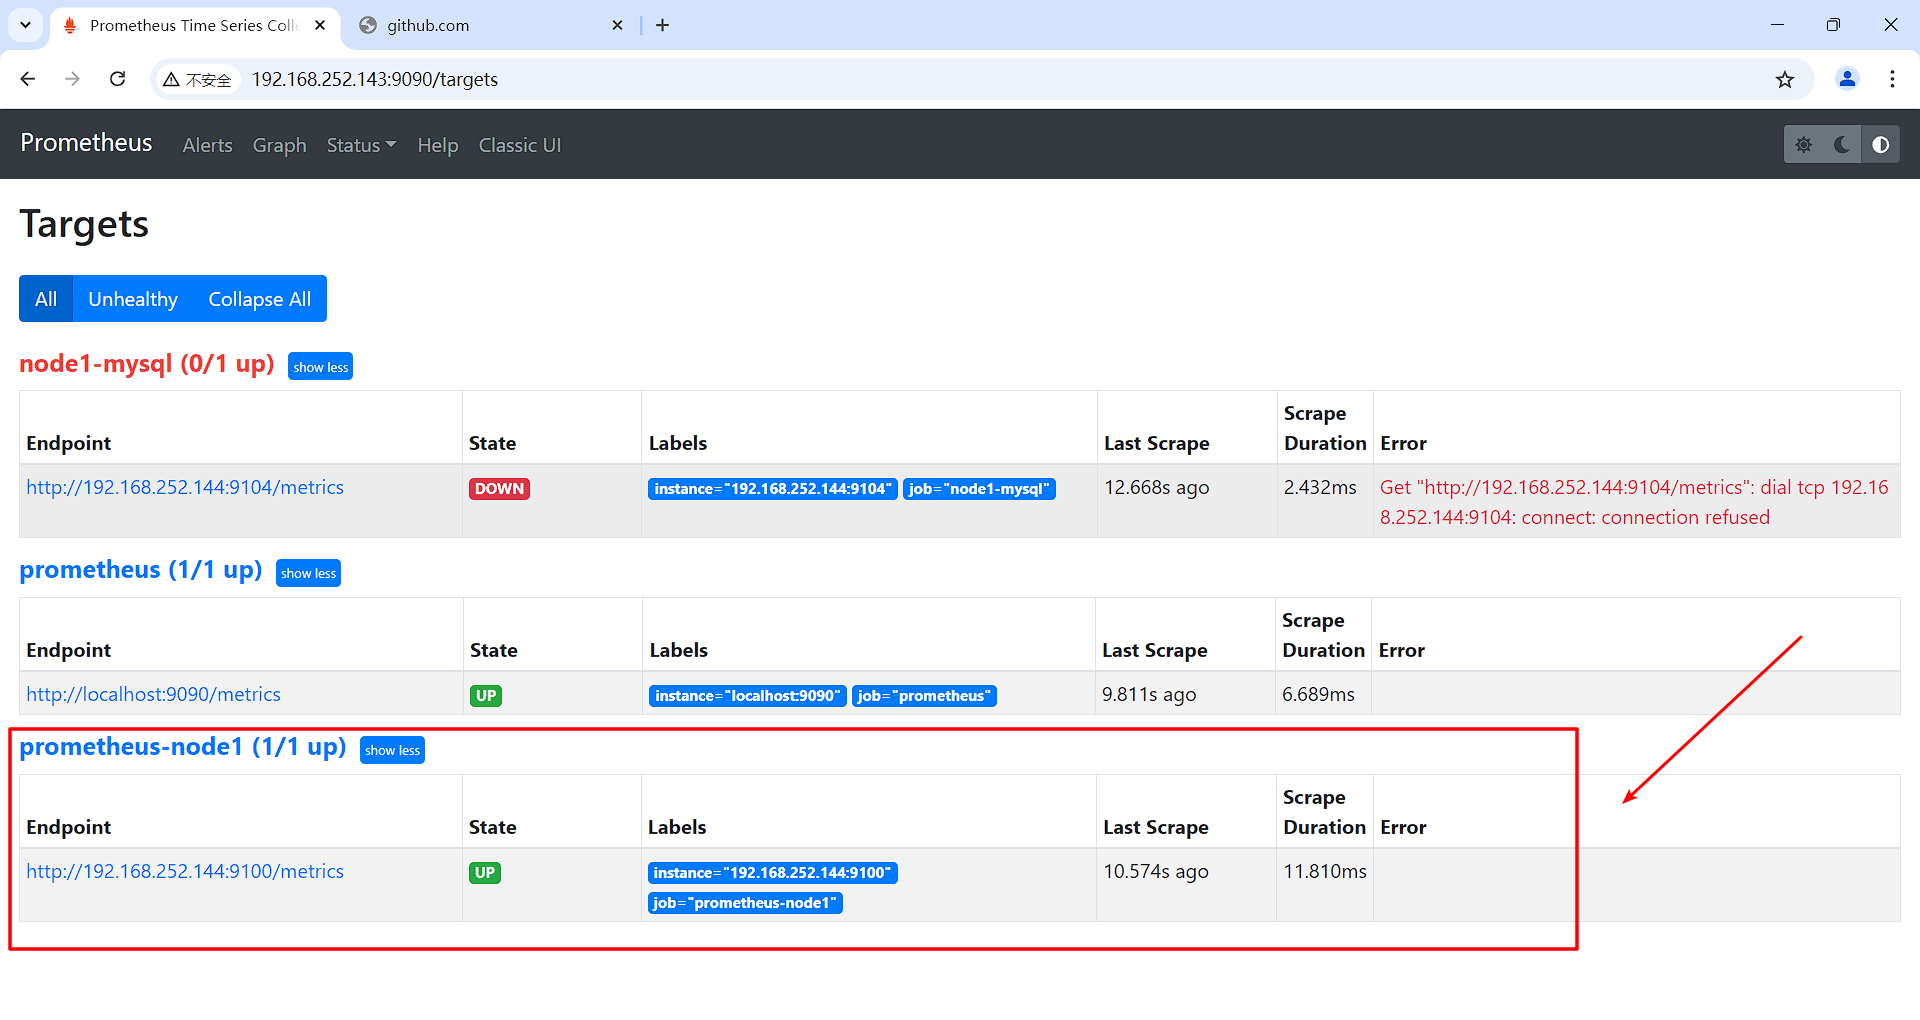
- job_name: 'prometheus-node1'
static_configs:
- targets: ["192.168.252.144:9100"]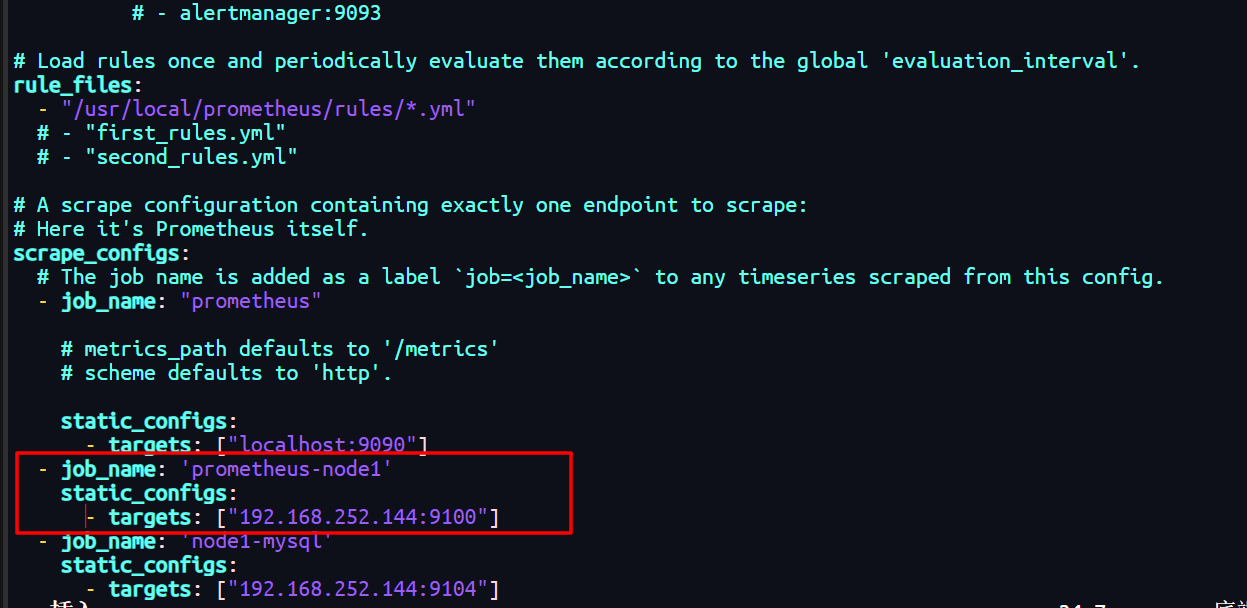
1.检查配置文件是否正确
./promtool check config prometheus.yml

Checking prometheus.yml
  SUCCESS: 1 rule files found

Checking /usr/local/prometheus/rules/host_monitor.yml
  SUCCESS: 1 rules found

  2.启动
  systemctl restart prometheus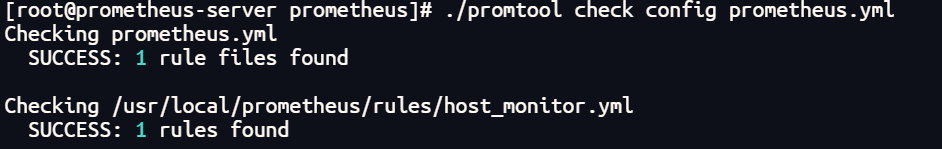
3.访问
http://192.168.252.143:9090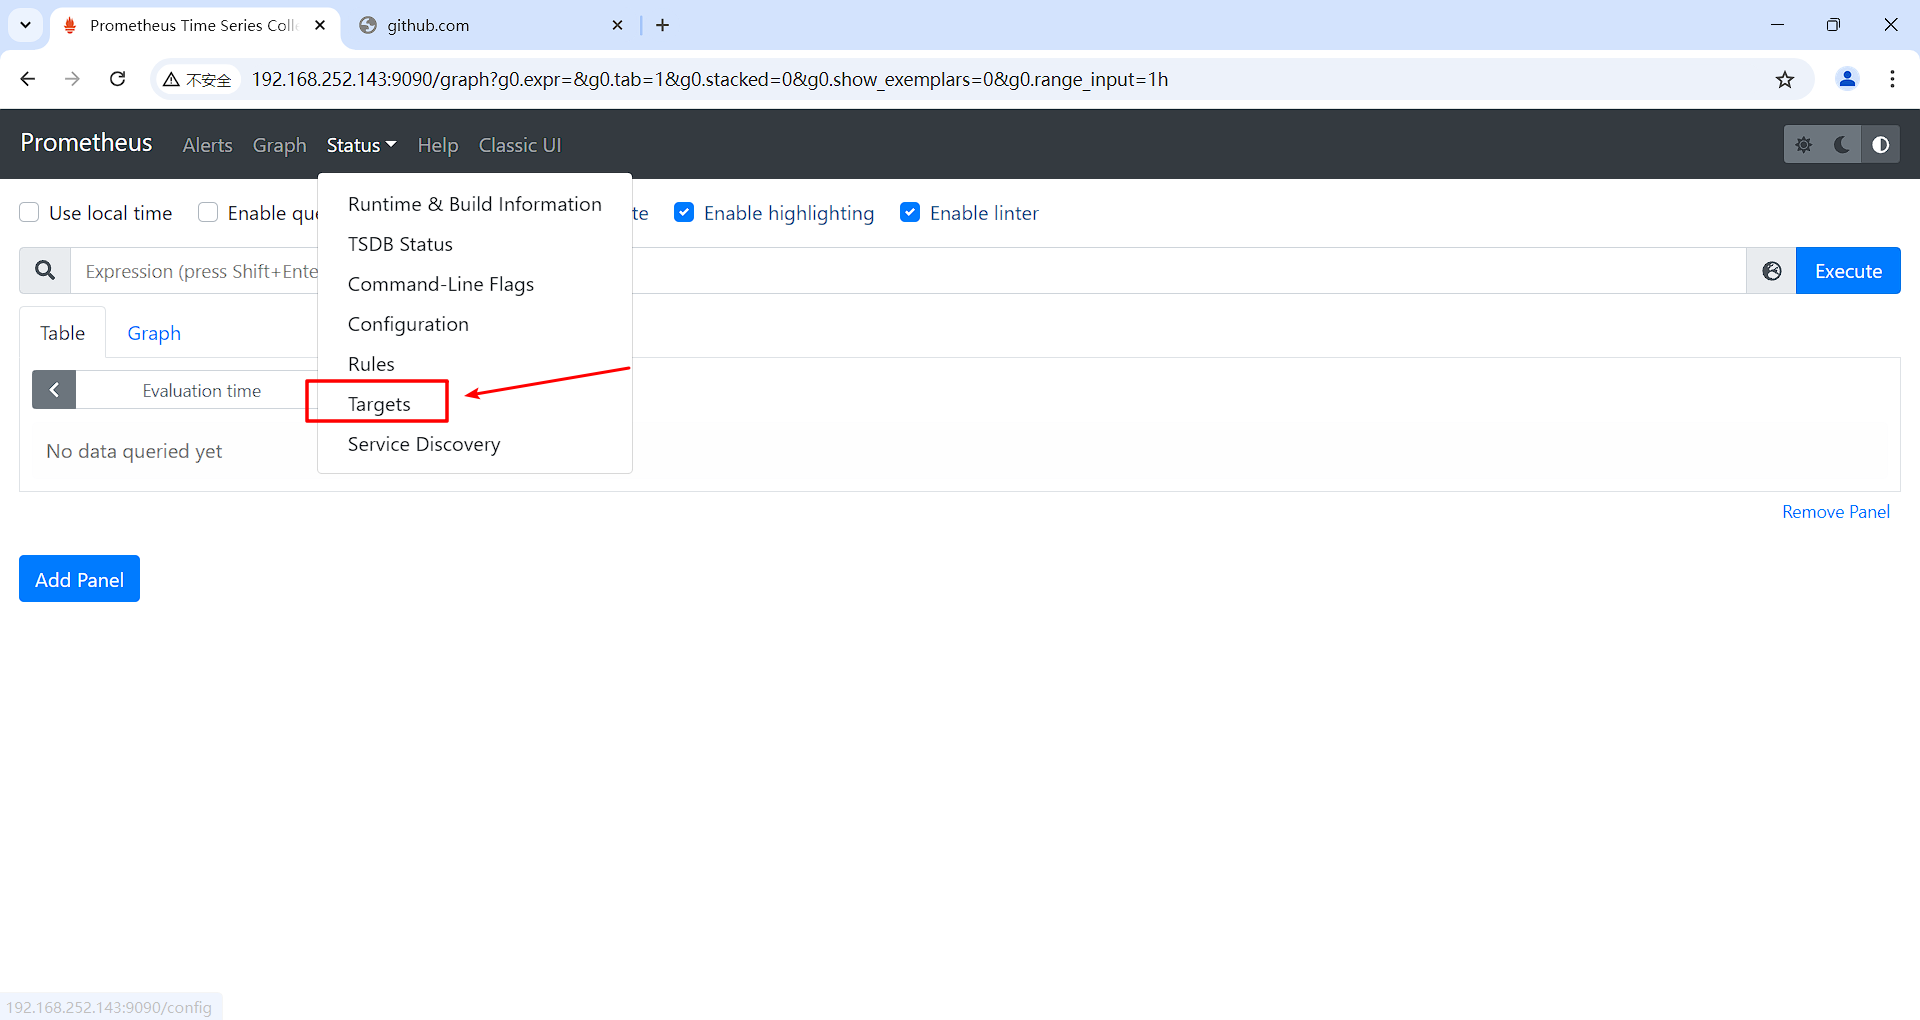
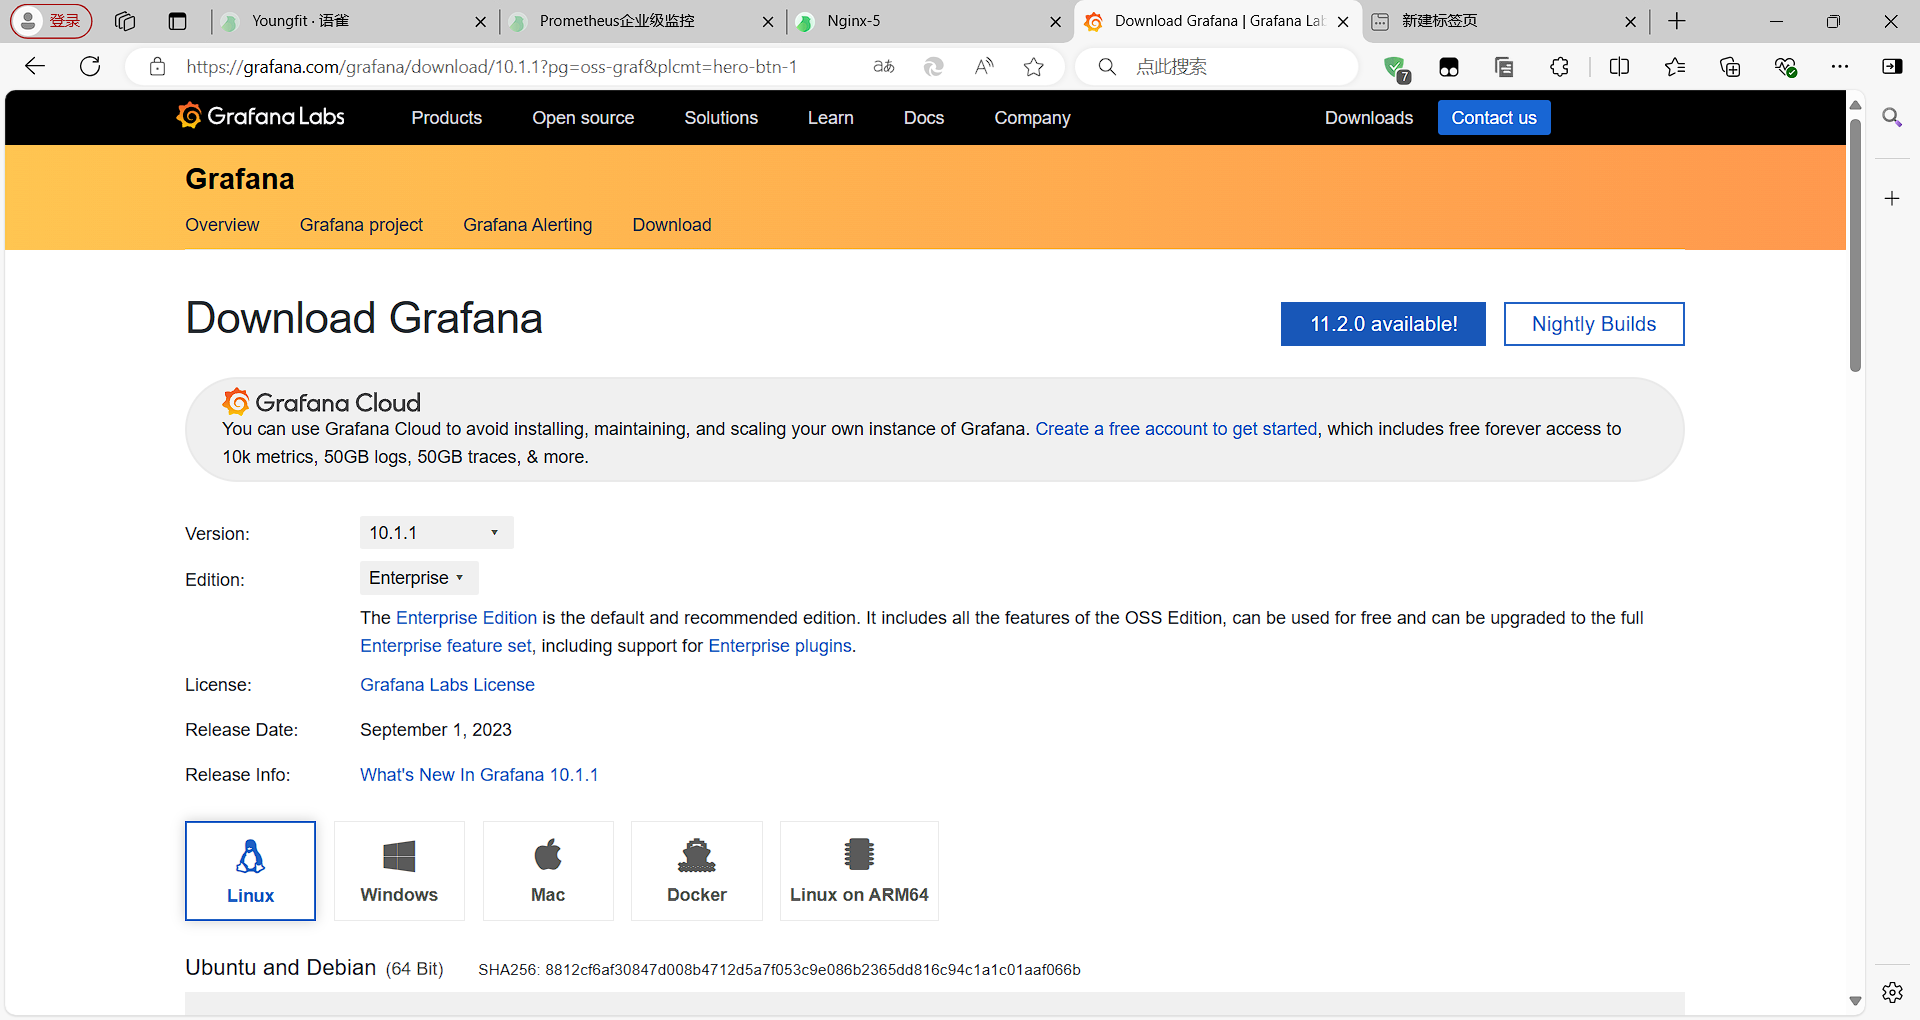
三、安装Grafana
官方网址下载:Download Grafana | Grafana Labs
192.168.252.141 grafana
安装grafana
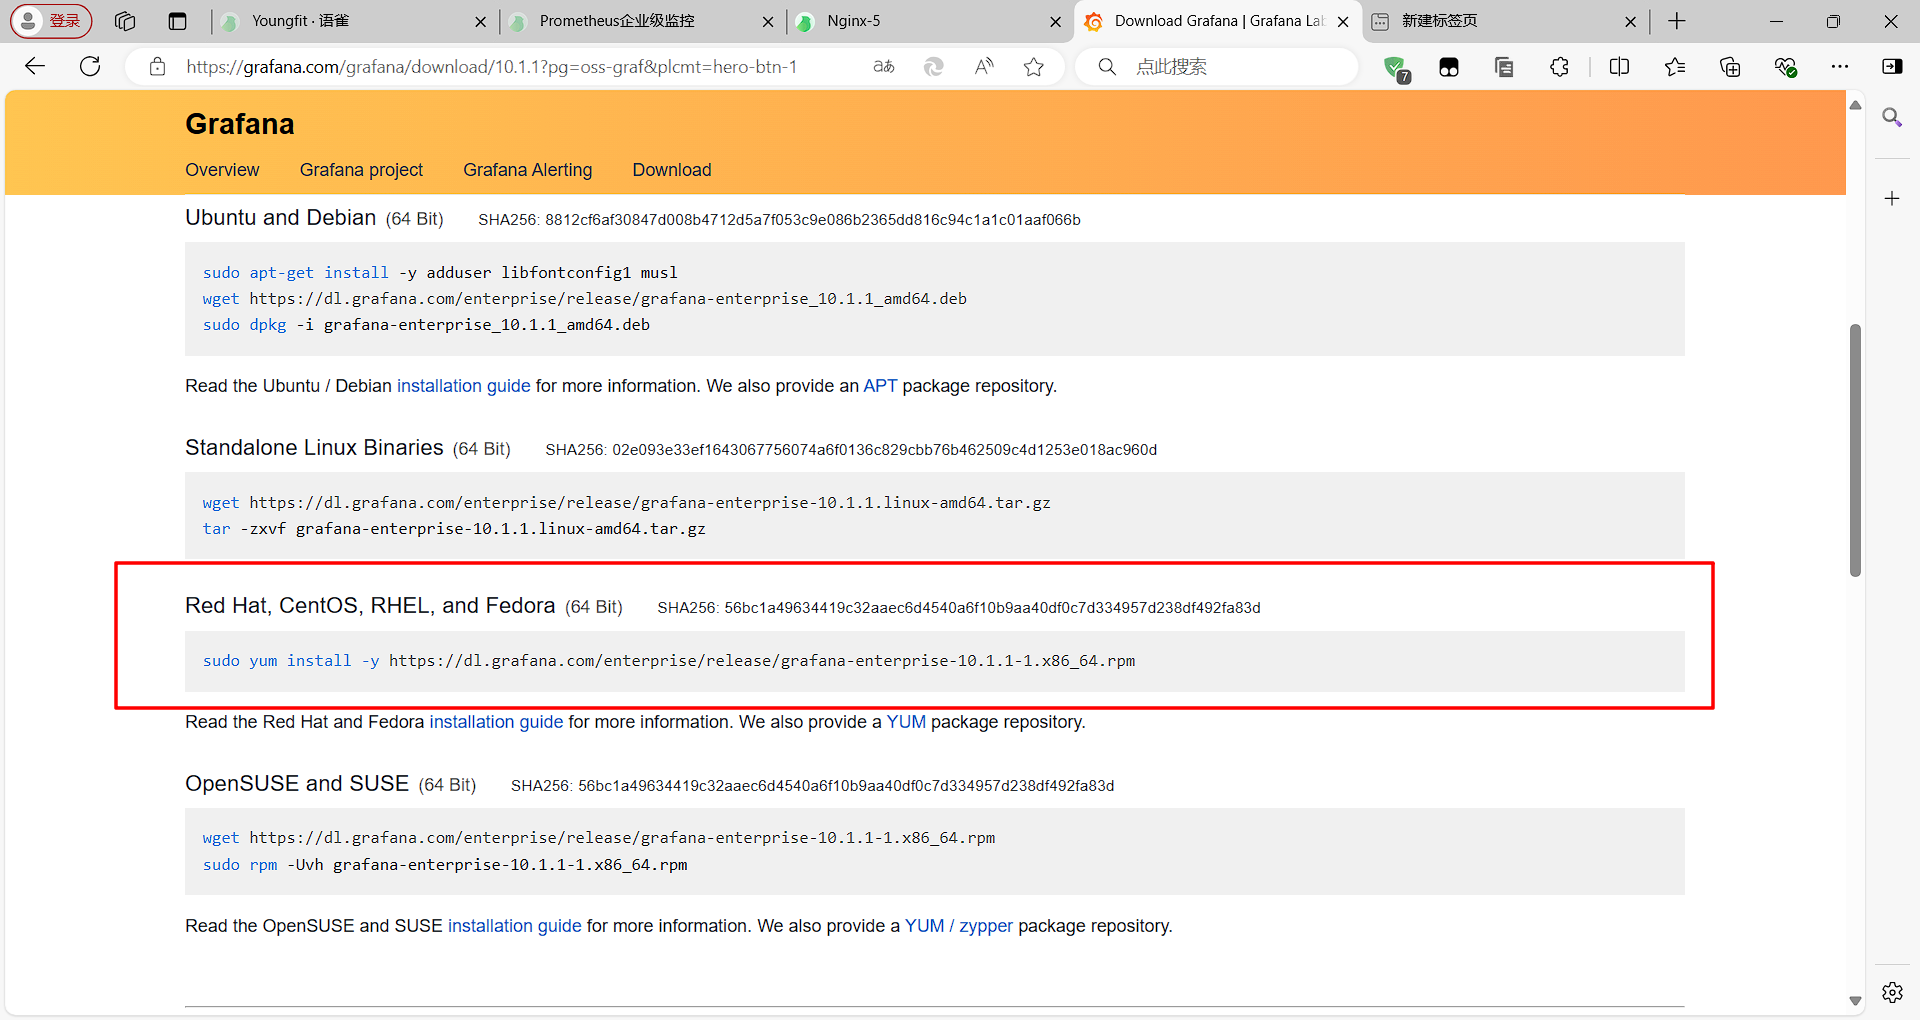
1.获取安装包
yum install -y https://dl.grafana.com/enterprise/release/grafana-enterprise-10.1.1-1.x86_64.rpm

2.启动grafana
systemct start grafana-server
systemctl enable grafana-server
登录访问
http://192.168.252.141:3000
默认账户密码
username:Admin
password:admin
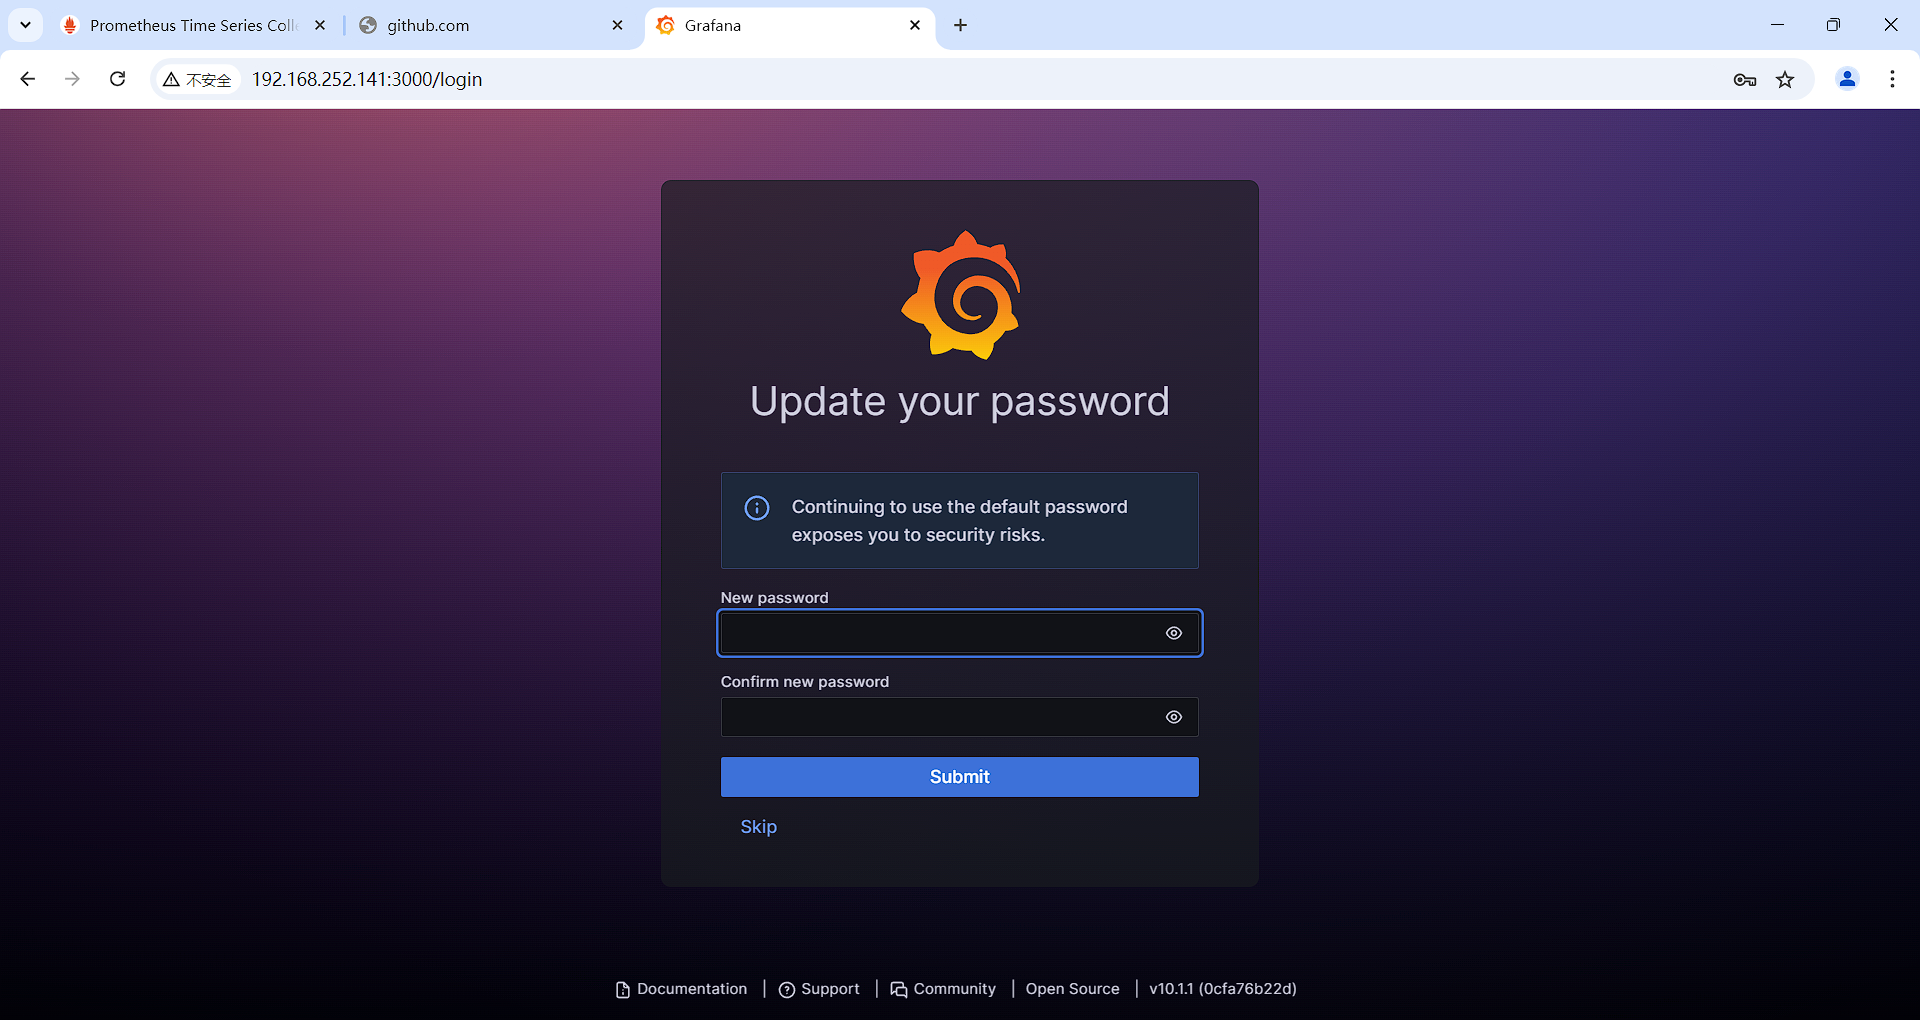
修改账户密码
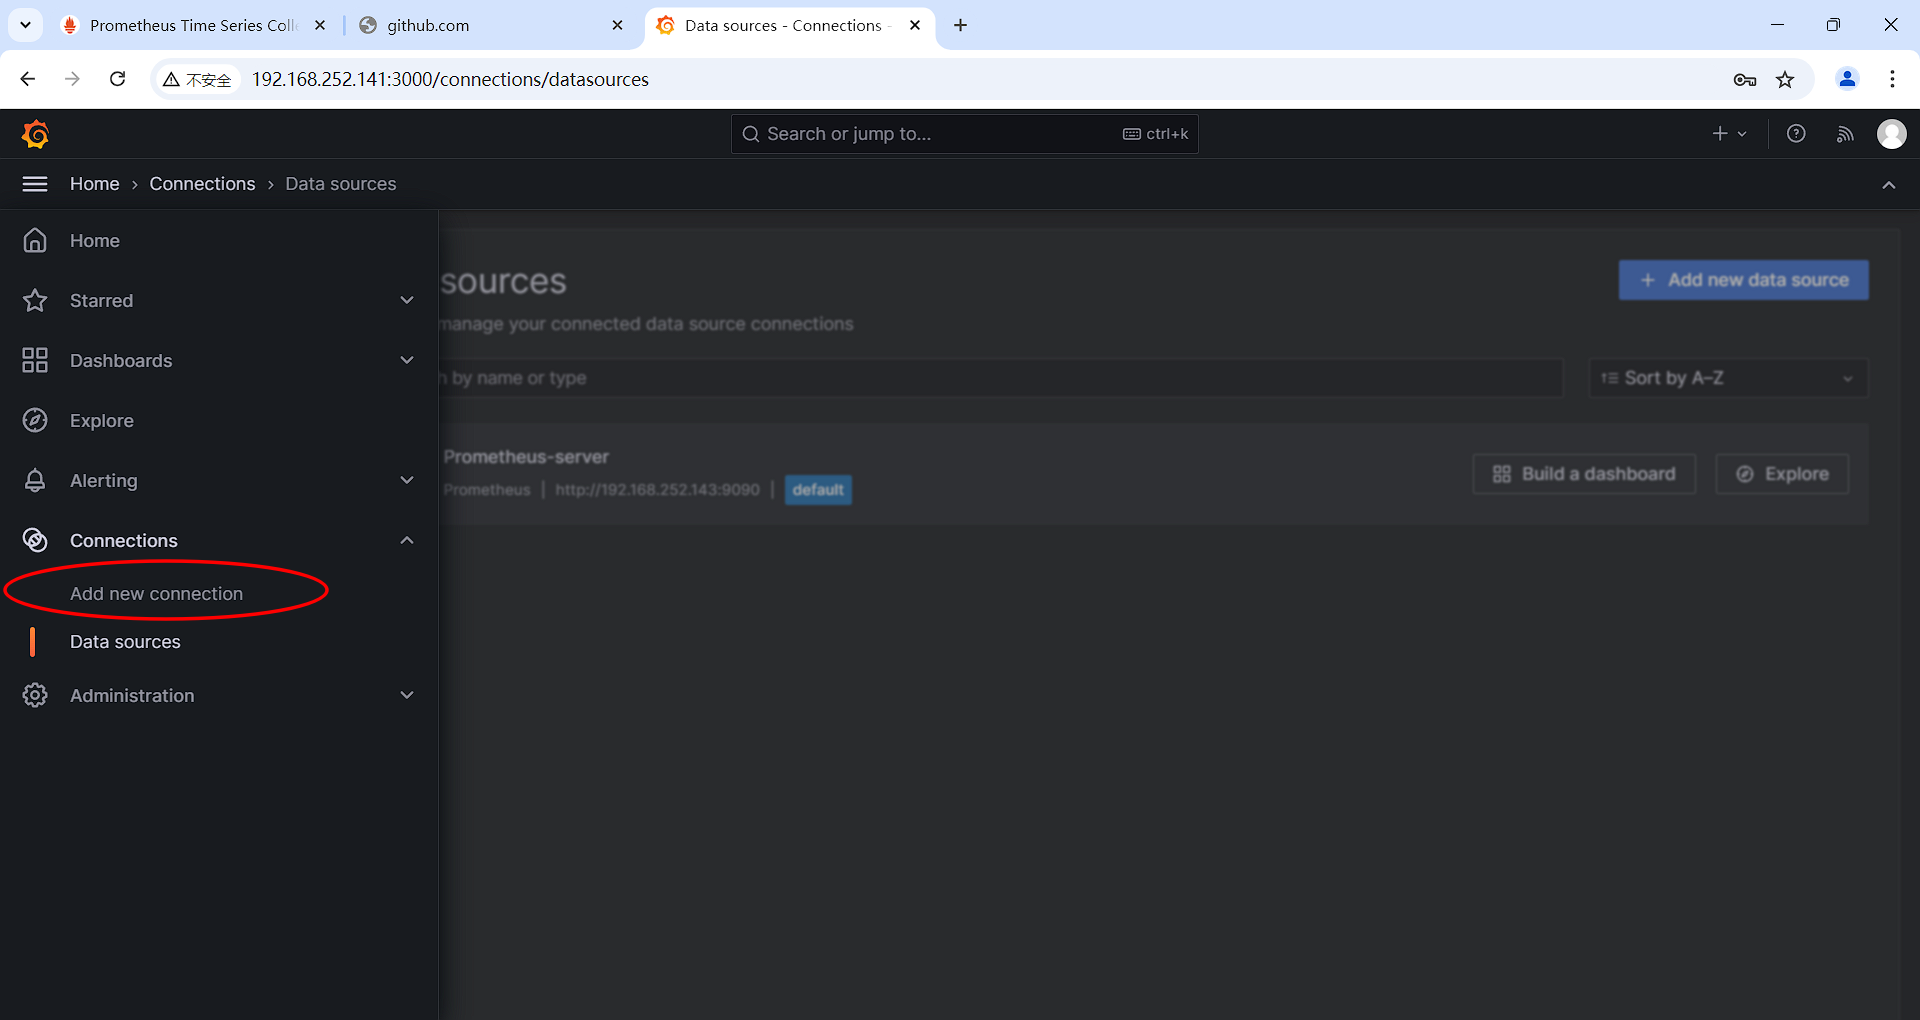
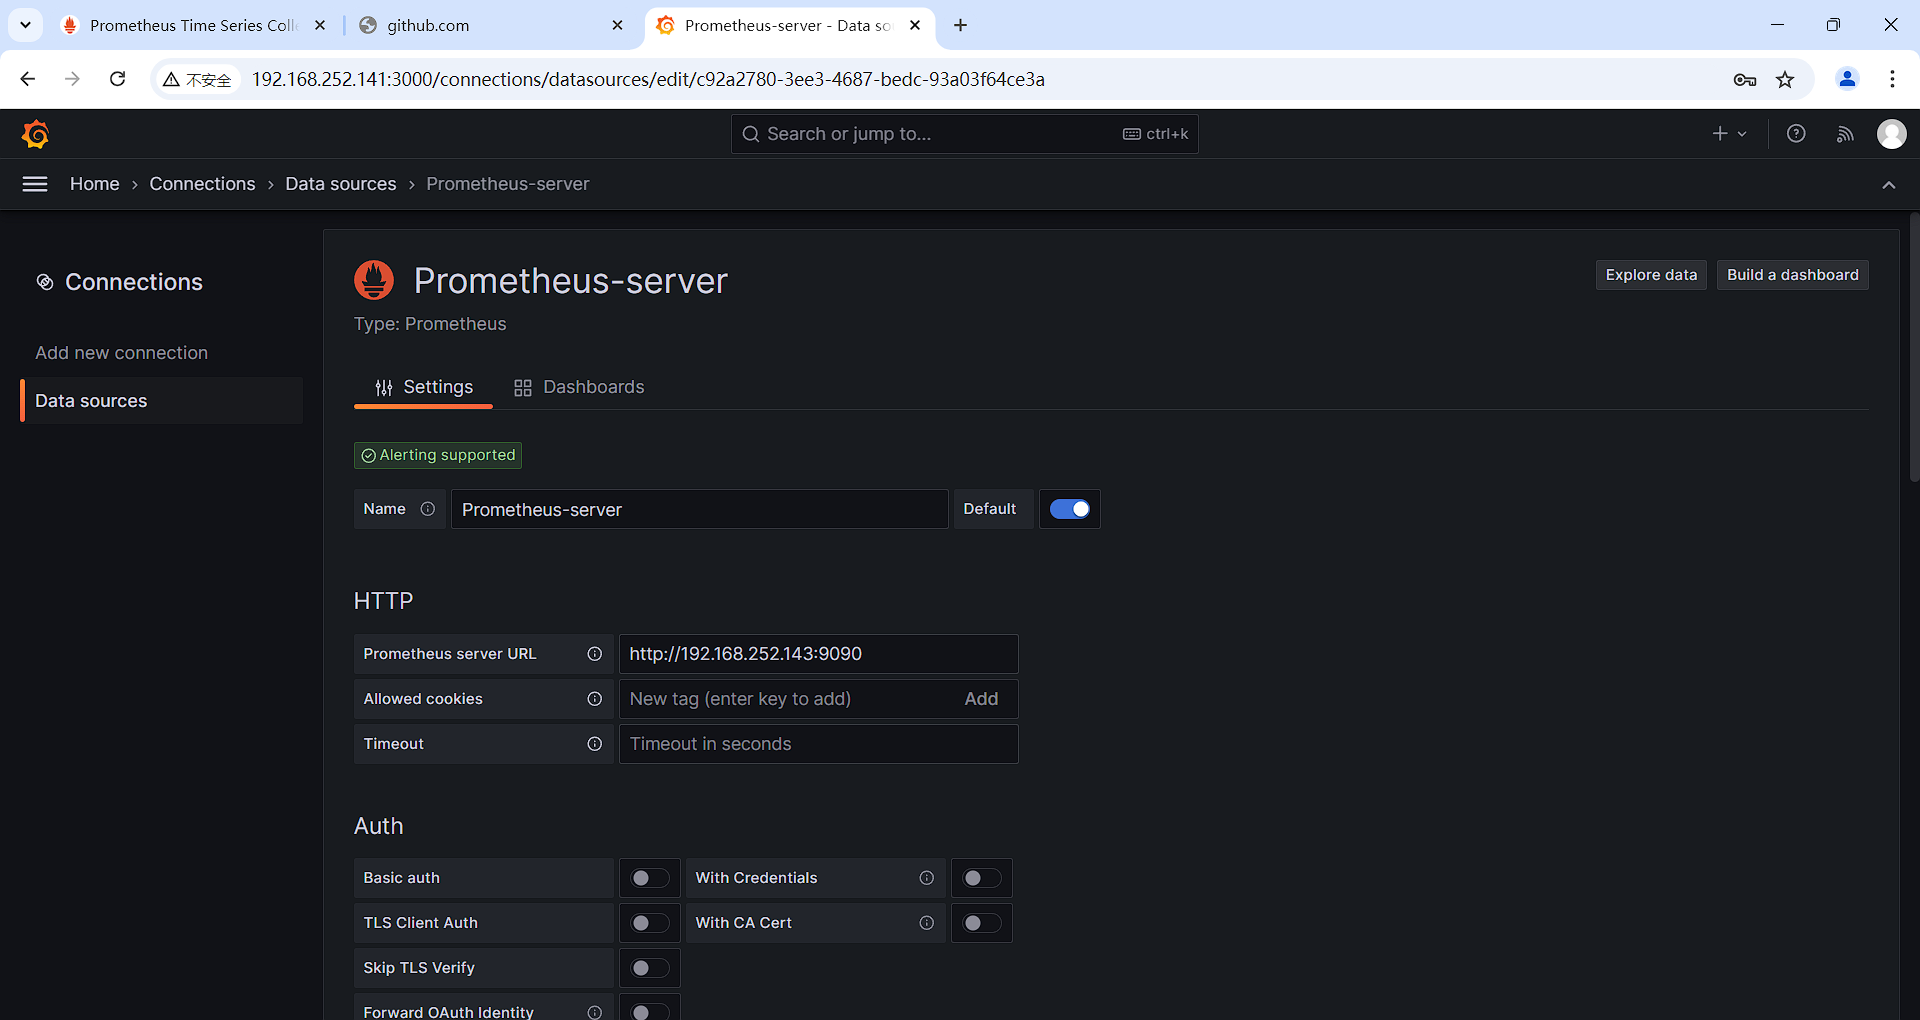
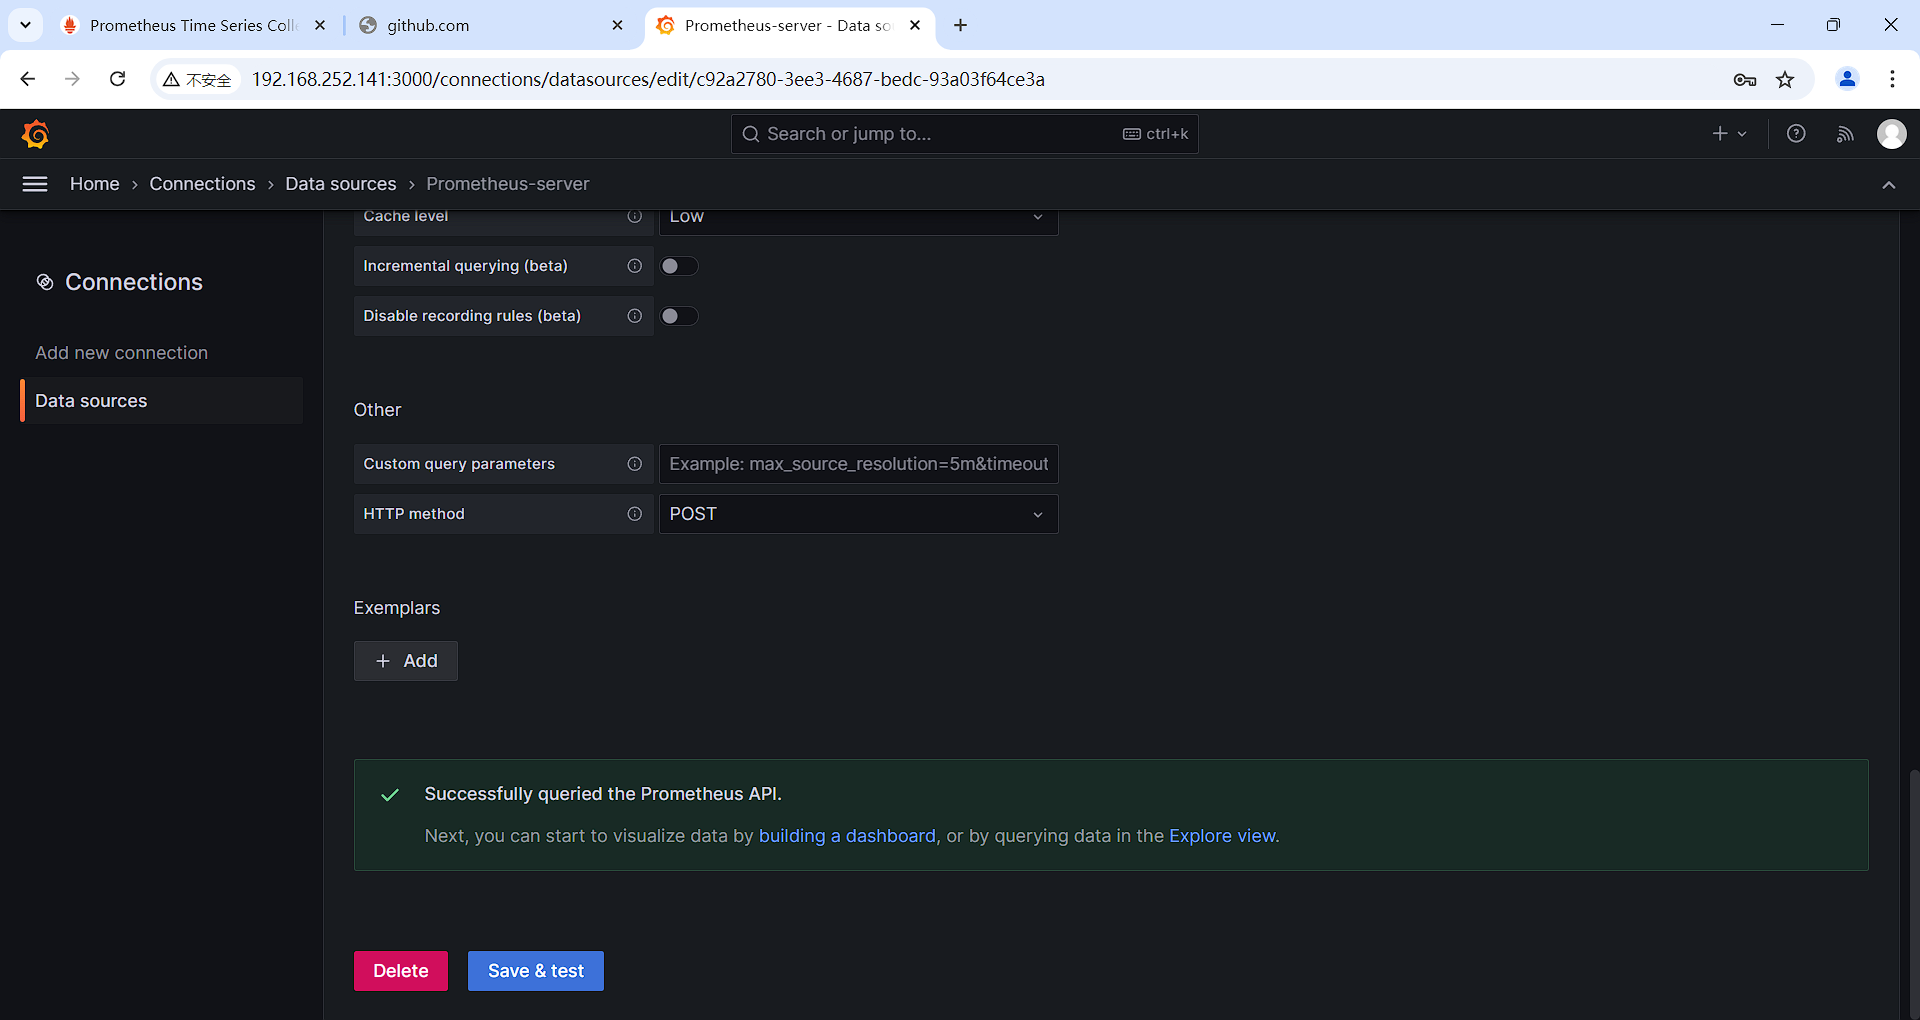
配置prometheus

四、配置文件
使用yml格式进行配置文件
更多参考:prometheus 配置文件详解 - liwenchao1995 - 博客园 (cnblogs.com)
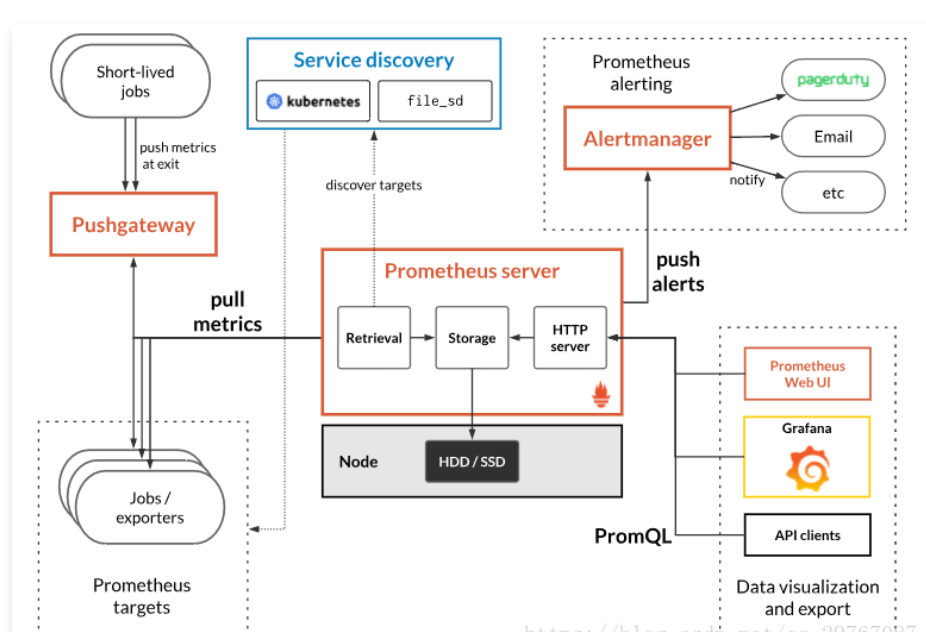
一级配置字段
global             # 全局配置 (如果有内部单独设定,会覆盖这个数)

alerting           # 告警插件定义。这里会设定alertmanager这个报警插件。

rule_files         # 告警规则。 按照设定参数进行扫描加载,用于自定义报警规则,其报警媒介和route路由由alertmanager插件实现。

scrape_configs      # 采集配置。配置数据源,包含分组job_name以及具体target。又分为静态配置和服务发现

remote_write        # 用于远程存储写配置

remote_read         # 用于远程读配置
global字段
选项:
1.scrape_interval   # 全局默认的数据拉取间隔
格式:
scrape_interval: <duration> | default = 1m

2.scrape_timeout   # 全局默认的单次数据拉取超时,如果有context deadline exceeded错误,需要配置在特定的job下配置该字段
格式:
scrape_timeout: <duration> | default = 10s

3.evaluation_interval  #全局默认的规则----拉取间隔(报警)
格式:
evaluation_interval: <duration> | default = 1m

4.external_labels  # 	该服务端在与其他系统对接所携带的标签
格式:
<labelname>: <labelvalue>
alerting字段
与alertmanager字段连用
alert_relabel_configs:
此项配置和scrape_configs字段中relabel_configs配置一样,用于对需要报警的数据进行过滤后发向Alertmanager
说明 relabel-configs的配置允许你选择你想抓取的目标和这些目标的标签是什么。所以说如果你想要抓取这种类型的服务器而不是那种,可以使用relabel_configs
相比之下,metric_relabel_configs是发生在抓取之后,但在数据被插入存储系统之前使用。因此如果有些你想过滤的指标,或者来自抓取本身的指标(比如来自/metrics页面)你就可以使用metric_relabel_configs来处理。
alertmanagers:
该项目主要用来配置不同的alertmanagers服务,以及Prometheus服务和他们的链接参数。alertmanagers服务可以静态配置也可以使用服务发现配置。Prometheus以pushing 的方式向alertmanager传递数据。
原始配置文件
# my global config
global:
  scrape_interval: 15s # Set the scrape interval to every 15 seconds. Default is every 1 minute.
  evaluation_interval: 15s # Evaluate rules every 15 seconds. The default is every 1 minute.
  # scrape_timeout is set to the global default (10s).

# Alertmanager configuration
alerting:
  alertmanagers:
    - static_configs:
        - targets:
            - 192.168.252.141:9093
          # - alertmanager:9093

# Load rules once and periodically evaluate them according to the global 'evaluation_interval'.
rule_files:
  - "/usr/local/prometheus/rules/*.yml"
  # - "first_rules.yml"
  # - "second_rules.yml"

# A scrape configuration containing exactly one endpoint to scrape:
# Here it's Prometheus itself.
scrape_configs:
  # The job name is added as a label `job=<job_name>` to any timeseries scraped from this config.
  - job_name: "prometheus"

    # metrics_path defaults to '/metrics'
    # scheme defaults to 'http'.

    static_configs:
      - targets: ["localhost:9090"]


 680
680

 被折叠的 条评论
为什么被折叠?
被折叠的 条评论
为什么被折叠?
 到【灌水乐园】发言


