


题目一:
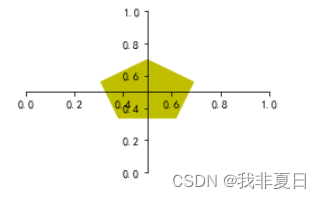
编写程序。在上节课题目5的基础上绘制五边形,隐藏上轴脊和右轴脊、#移动轴脊的位置,绘制如下图。
程序代码:
import numpy as np
import matplotlib.pyplot as plt
import matplotlib.patches as mpathes
polygon = mpathes.RegularPolygon((0.5, 0.5), 5, 0.3, color='y')
ax = plt.axes((0.3, 0.3, 0.5, 0.5))
ax.add_patch(polygon)
# 依次隐藏上轴脊、左轴脊和右轴脊
ax.spines['top'].set_color('none')
ax.spines['right'].set_color('none')
#移动轴脊的位置
ax.spines["left"].set_position(("data",0.5))
ax.spines["bottom"].set_position(("data",0.5))
#坐标轴上刻度线的位置
ax.xaxis.set_ticks_position("bottom")
ax.yaxis.set_ticks_position("left")

plt.show()
运行结果:
题目二:
编写程序。根据第6章实例3的要求,绘制展示正弦曲线和余弦曲线的图表,实现过程如下:
- 导入numpy、matplotlib.pyplot模块;
 最低0.47元/天 解锁文章


 325
325

 被折叠的 条评论
为什么被折叠?
被折叠的 条评论
为什么被折叠?
 到【灌水乐园】发言


