


项目中提到了一个需求,想要看到echarts图表中的数据,这里使用toolbox工具栏渲染出一个table表格,并加入导出excel功能。
所以就用到echarts配置项中的toolbox工具栏,使用 jquery.table2excel.js实现 导出excel功能。
首先引入jquery.js,再次引入 jquery.table2excel.js
下载地址: https://blog-static.cnblogs.com/files/liuchenxing/jquery.table2excel.js
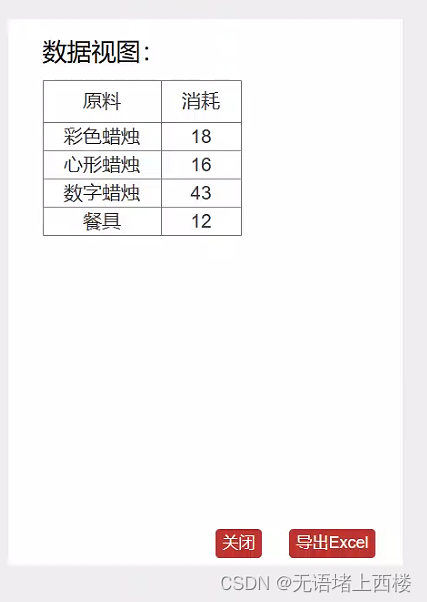
折线、柱状图转表格
在option添加工具
toolbox: {
           left:33,
           // top:10,
           feature: {
             dataView: {
               show: true,
               title: '数据视图',
               lang: ['数据视图:', '关闭', '导出Excel'],    // 按钮
               contentToOption: function (opts) {
                 $(".echarts_max").table2excel({    //下载jquery.table2excel.js,引入,$("#tempChart")是Echarts容器
                     exclude: ".noExl", //过滤位置的 css 类名, 有class = “noExl” 的行不被导出
                     filename: "消耗量表", // 文件名称
                     name: "Excel Document Name.xls",
                     exclude_img: true,
                     exclude_links: true,
                     exclude_inputs: true
                 });
               },
               optionToContent: function (opt) {
               // console.log(opt)
                //该函数可以自定义列表为table,opt是给我们提供的原始数据的obj。 可打印出来数据结构查看
                var axisData = opt.xAxis[0].data; //坐标轴
                var series = opt.series; //折线图的数据
                var tdHeads =
                      '<td  style="margin-top:10px; padding: 0 15px">原料</td>'; //表头
                var tdBodys = "";
                console.log(opt)
                series.forEach(function (item) {
                   tdHeads += `<td style="padding:5px 15px">消耗</td>`;
                });
                var table = '<table border="1" style="margin-left:20px;border-collapse:collapse;font-size:14px;text-align:center;"><tbody><tr>'+tdHeads+'</tr>';
                for (var i = 0, l = axisData.length; i < l; i++) {
                   for (var j = 0; j < series.length; j++) {
                      // console.log(i+"-"+j+":"+series[j].data[i])
                      if (series[j].data[i] == null) {
                         tdBodys += `<td>${"-"}</td>`;
                      } else {
                         tdBodys += '<td>'+series[j].data[i]+'</td>';
                      }
                   }
                   table += '<tr><td style="padding: 0 15px">'+axisData[i]+'</td>'+tdBodys+'</tr>';
                   tdBodys = "";
                }
                table += "</tbody></table>";
                return table;
               },
             },
             magicType: {show: true, type: ['line', 'bar']},
             restore: {show: true},
             saveAsImage: {show: true}
           }
         },
效果图
饼图转表格
因为比例图的数据存的地方与折现图和柱状图有区别
所以代码如下
toolbox: {
left:100,
// top:10,
feature: {
dataView: {
show: true,
title: '数据视图',
lang: ['数据视图:', '关闭', '导出Excel'], // 按钮
contentToOption: function (opts) {
$("#main").table2excel({
exclude: ".noExl", //过滤位置的 css 类名, 有class = “noExl” 的行不被导出
filename: "配件损耗表", // 文件名称
name: "Excel Document Name.xls",
exclude_img: true,
exclude_links: true,
exclude_inputs: true
});
},
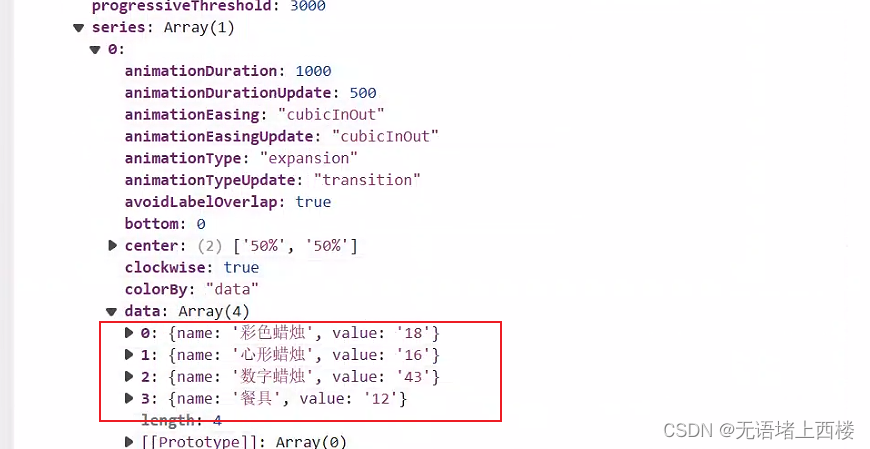
optionToContent: function (opt) {
console.log(opt)
//该函数可以自定义列表为table,opt是给我们提供的原始数据的obj。 可打印出来数据结构查看
// var axisData = opt.xAxis[0].data; //坐标轴
var series = opt.series[0].data; //折线图的数据
var tdHeads =
'<td style="margin-top:10px; padding: 0 15px">原料</td>'; //表头
var tdBodys = "";
// series.forEach(function (item) {
tdHeads += '<td style="padding:5px 15px">'+"消耗"+'</td>';
// });
var table = '<table border="1" style="margin-left:20px;border-collapse:collapse;font-size:14px;text-align:center;"><tbody><tr>'+tdHeads+'</tr>';
// for (var i = 0, l = axisData.length; i < l; i++) {
for (var j = 0; j < series.length; j++) {
// console.log(i+"-"+j+":"+series[j].data[i])
if (series[j] == null) {
tdBodys += `<td>${"-"}</td>`;
} else {
tdBodys += '<td>'+series[j].name+'</td>';
}
table += '<tr><td style="padding: 0 15px">'+series[j].value+'</td>'+tdBodys+'</tr>';
tdBodys = "";
}
// }
table += "</tbody></table>";
return table;
},
},
magicType: {show: true, type: ['line']},
// restore: {show: true},
saveAsImage: {show: true}
}
},效果图

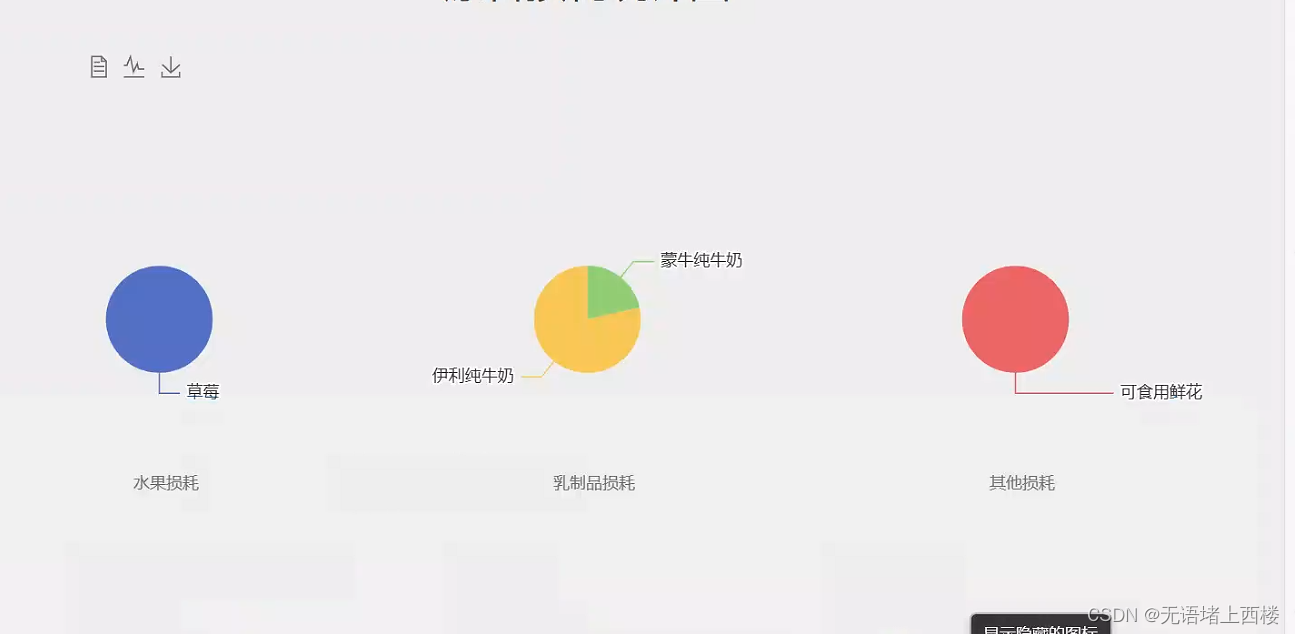
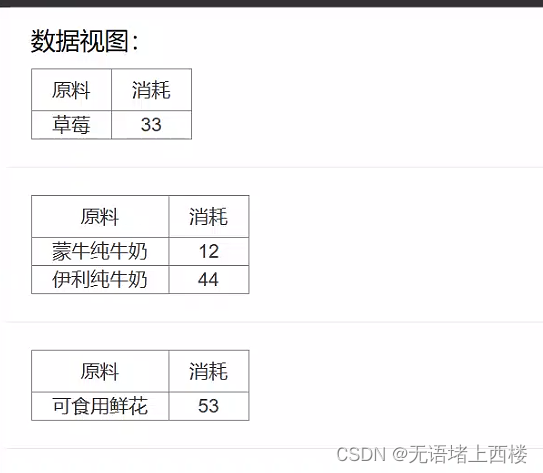
多饼图转表格
多个饼图
多个饼图转表格的代码
toolbox: {
   left:100,
   // top:10,
   feature: {
      dataView: {
         show: true,
         title: '数据视图',
         lang: ['数据视图:', '关闭', '导出Excel'],    // 按钮
         contentToOption: function (opts) {
            $("#main").table2excel({
               exclude: ".noExl", //过滤位置的 css 类名, 有class = “noExl” 的行不被导出
               filename: "其他损耗表", // 文件名称
               name: "Excel Document Name.xls",
               exclude_img: true,
               exclude_links: true,
               exclude_inputs: true
            });
         },
         optionToContent: function (opt) {
            // console.log(opt)
            //该函数可以自定义列表为table,opt是给我们提供的原始数据的obj。 可打印出来数据结构查看
            // var axisData = opt.xAxis[0].data; //坐标轴
            var series = opt.series; //折线图的数据
            let rt='<div>'
            for (var i = 0; i < series.length; i++) {

               var tdHeads = '<td  style="margin-top:10px; padding: 0 15px">原料</td>'; //表头
               var tdBodys = "";
               // series.forEach(function (item) {
               tdHeads += '<td style="padding:5px 15px">'+"消耗"+'</td>';
               // });
               var table = '<table border="1" style="margin-left:20px;border-collapse:collapse;font-size:14px;text-align:center;"><tbody><tr>'+tdHeads+'</tr>';

               // for (var i = 0, l = axisData.length; i < l; i++) {
               for (var j = 0; j < series[i].data.length; j++) {
                  // console.log(":"+series[i].data[j])
                  if (series[i].data[j] == null) {
                     tdBodys += `<td>${"-"}</td>`;
                  } else {
                     tdBodys += '<td>'+series[i].data[j].value+'</td>';
                  }
                  table += '<tr><td style="padding: 0 15px">'+series[i].data[j].name+'</td>'+tdBodys+'</tr>';
                  tdBodys = "";
               }
               // }
               table += "</tbody></table><hr>";
               rt+=table
            }
            rt+="</div>"
            return rt;
         },
      },
效果图


 8858
8858

 被折叠的 条评论
为什么被折叠?
被折叠的 条评论
为什么被折叠?
 到【灌水乐园】发言


