


1.echarts图表
代码
<template>
<div class="TwelvePointsOverview">
<div class="header_container">
数据统计时间:
<el-date-picker
v-model="searchForm.time"
type="date"
placeholder="选择日期"
size="mini"
value-format="yyyy-MM-dd"
:picker-options="{
disabledDate(time) {
// 今天之后的日期不允许选择
return +new Date(time) > +new Date()
}
}"
/>
所在部门:
<el-select v-model="searchForm.ssbm" placeholder="请选择" size="mini" clearable>
<el-option
v-for="item in glbmOptions"
:key="item.value"
:label="item.label"
:value="item.value"
/>
</el-select>
</div>
<div class="main_container">
<div class="top">
<div class="top_item">
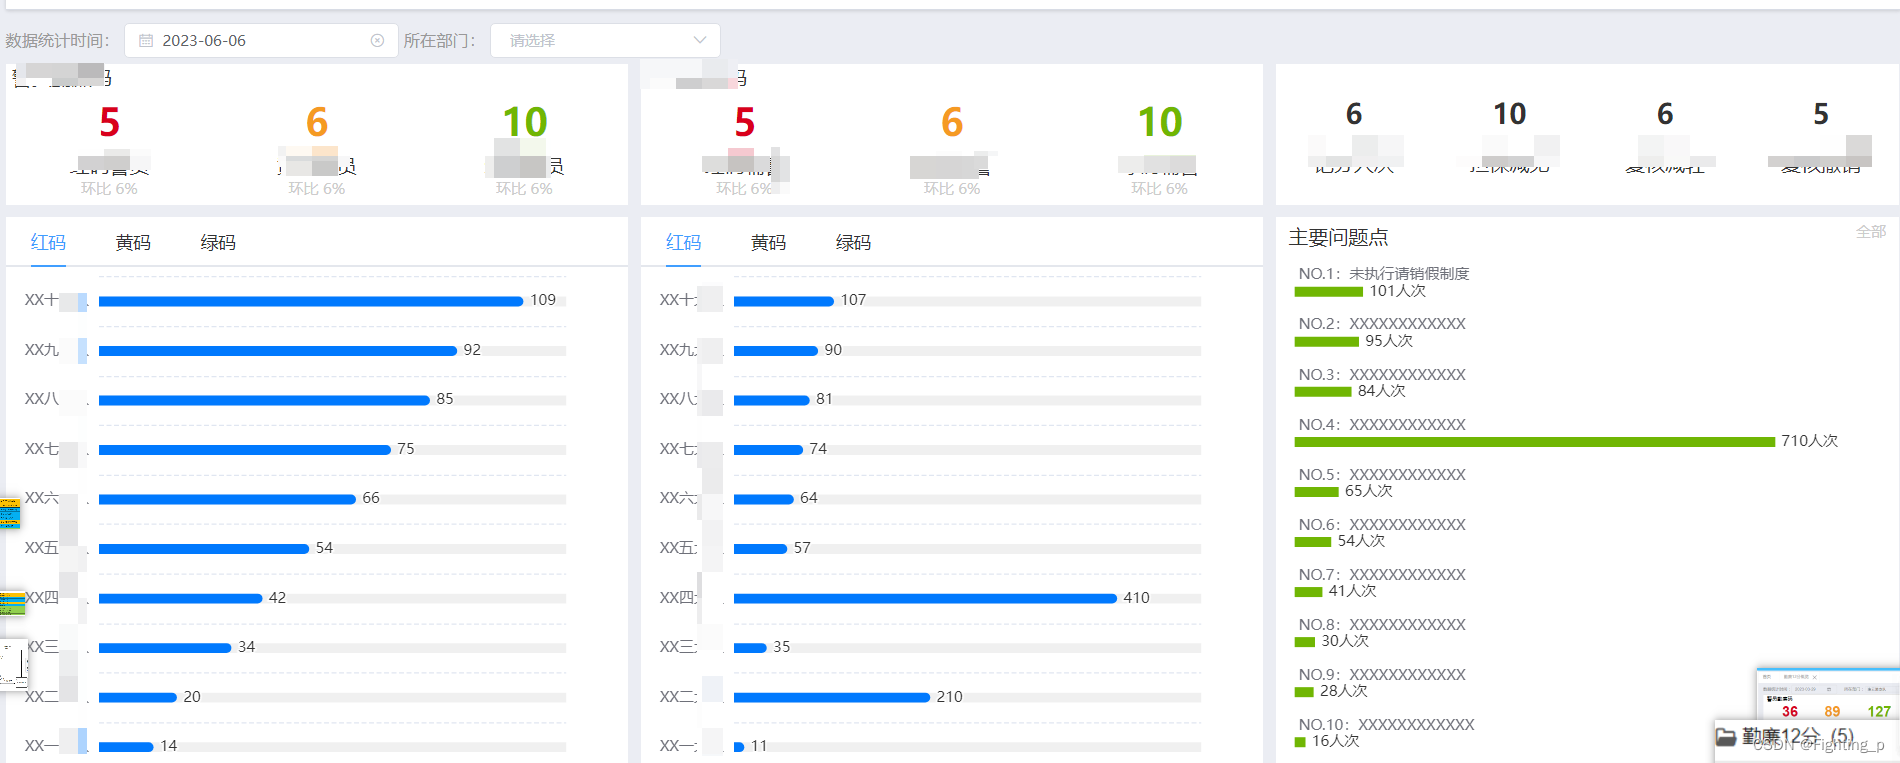
<div class="top_item_title">警员勤廉码</div>
<div class="top_item_container">
<div class="top_item_container_item">
<div class="count red">{{ mockData.red }}</div>
<div class="text">红码警员</div>
<div class="precent">环比 6%</div>
</div>
<div class="top_item_container_item">
<div class="count yellow">{{ mockData.yellow }}</div>
<div class="text">黄码警员</div>
<div class="precent">环比 6%</div>
</div>
<div class="top_item_container_item">
<div class="count green">{{ mockData.green }}</div>
<div class="text">绿码警员</div>
<div class="precent">环比 6%</div>
</div>
</div>
</div>
<div class="top_item">
<div class="top_item_title">辅警勤廉码</div>
<div class="top_item_container">
<div class="top_item_container_item">
<div class="count red">{{ mockData.red }}</div>
<div class="text">红码辅警</div>
<div class="precent">环比 6%</div>
</div>
<div class="top_item_container_item">
<div class="count yellow">{{ mockData.yellow }}</div>
<div class="text">黄码辅警</div>
<div class="precent">环比 6%</div>
</div>
<div class="top_item_container_item">
<div class="count green">{{ mockData.green }}</div>
<div class="text">绿码辅警</div>
<div class="precent">环比 6%</div>
</div>
</div>
</div>
<div class="top_item">
<div class="top_item_container">
<div class="top_item_container_item">
<div class="counts">{{ mockData.jfrc }}</div>
<div class="text">记分人次</div>
</div>
<div class="top_item_container_item">
<div class="counts">{{ mockData.dbjm }}</div>
<div class="text">担保减免</div>
</div>
<div class="top_item_container_item">
<div class="counts">{{ mockData.fhjq }}</div>
<div class="text">复核减轻</div>
</div>
<div class="top_item_container_item">
<div class="counts">{{ mockData.fhcx }}</div>
<div class="text">复核撤销</div>
</div>
</div>
</div>
</div>
<div class="bottom">
<div class="bottom_item">
<div class="bottom_item_header">
<el-tabs v-model="activeNameJY" @tab-click="echartsInit('jy')">
<el-tab-pane label="红码" name="red" />
<el-tab-pane label="黄码" name="yellow" />
<el-tab-pane label="绿码" name="green" />
</el-tabs>
</div>
<div class="bottom_item_content">
<div id="jy_echarts" />
</div>
</div>
<div class="bottom_item">
<div class="bottom_item_header">
<el-tabs v-model="activeNameFJ" @tab-click="echartsInit('fj')">
<el-tab-pane label="红码" name="red" />
<el-tab-pane label="黄码" name="yellow" />
<el-tab-pane label="绿码" name="green" />
</el-tabs>
</div>
<div class="bottom_item_content">
<div id="fj_echarts" />
</div>
</div>
<div class="bottom_item">
<div class="bottom_item_header zywtd">
主要问题点
<span class="all">全部</span>
</div>
<div class="bottom_item_content">
<div id="zywtd_echarts" />
</div>
</div>
</div>
</div>
</div>
</template>
<script>
import { mapGetters } from 'vuex'
export default {
name: 'TwelvePointsOverview',
components: {},
data() {
return {
searchForm: {
time: '',
ssbm: ''
},
activeNameJY: 'red',
activeNameFJ: 'red',
jyEcharts: null, // 警员勤廉码数据
fjEcharts: null, // 辅警勤廉码数据
zywtdEcharts: null, // 主要问题点 echarts
mockData: {
red: 1,
yellow: 2,
green: 3,
jfrc: 4,
dbjm: 5,
fhjq: 6,
fhcx: 7
},
mockDataList: [1, 2, 3, 4, 5, 6, 7, 8, 9, 10],
mockYAxisList: [
'XX一大队',
'XX二大队',
'XX三大队',
'XX四大队',
'XX五大队',
'XX六大队',
'XX七大队',
'XX八大队',
'XX九大队',
'XX十大队'
],
mockYAxisList1: [
'NO.10:XXXXXXXXXXXX',
'NO.9:XXXXXXXXXXXX',
'NO.8:XXXXXXXXXXXX',
'NO.7:XXXXXXXXXXXX',
'NO.6:XXXXXXXXXXXX',
'NO.5:XXXXXXXXXXXX',
'NO.4:XXXXXXXXXXXX',
'NO.3:XXXXXXXXXXXX',
'NO.2:XXXXXXXXXXXX',
'NO.1:未执行请销假制度'
]
}
},
computed: {
...mapGetters(['glbmOptions'])
},
watch: {
searchForm: {
handler(val) {
if (
document.getElementById('jy_echarts') &&
document.getElementById('fj_echarts') &&
document.getElementById('zywtd_echarts')
) {
// 页面 dom 渲染 完之后才可以 init 主要用于页面顶部的搜索区域数据改变
this.init()
/** ** test start ****/
for (const key in this.mockData) {
this.mockData[key] = (Math.random() * 10).toFixed(0)
}
/** ** test end ****/
}
},
immediate: true,
deep: true
}
},
created() {},
mounted() {
this.init()
window.addEventListener('resize', () => {
if (document.getElementById('jy_echarts')) {
this.jyEcharts = this.$echarts.init(document.getElementById('jy_echarts'))
this.jyEcharts.resize()
}
if (document.getElementById('fj_echarts')) {
this.fjEcharts = this.$echarts.init(document.getElementById('fj_echarts'))
this.fjEcharts.resize()
}
if (document.getElementById('zywtd_echarts')) {
this.zywtdEcharts = this.$echarts.init(document.getElementById('zywtd_echarts'))
this.zywtdEcharts.resize()
}
})
},
methods: {
init() {
this.echartsInit('jy')
this.echartsInit('fj')
this.zywtdEchartsInit()
},
echartsInit(type) {
// 销毁之前的 echarts 图表(避免出现 echarts.js:2218 There is a chart instance already initialized on the dom. 警告)
if (this[type + 'Echarts']) {
this[type + 'Echarts'].dispose()
}
// echarts 初始化
this[type + 'Echarts'] = this.$echarts.init(document.getElementById(type + '_echarts'))
const options = {
tooltip: {
trigger: 'none',
axisPointer: {
type: 'shadow'
}
},
grid: {
top: '2%',
left: '3%',
right: '10%',
bottom: '1%',
containLabel: true
// show: false,
},
xAxis: {
type: 'value',
show: false
},
yAxis: {
type: 'category',
axisLine: {
show: false
},
axisTick: {
show: false
},
splitLine: {
show: true,
lineStyle: {
type: 'dashed'
}
},
data: this.mockYAxisList
},
series: [
{
name: '数量',
type: 'bar',
stack: 'total',
barWidth: '20%', // 15
showBackground: true,
// cursor: type === 'fj' ? 'default' : 'pointer', // 鼠标悬浮样式
label: {
show: true,
position: 'right'
// formatter: (params) => {
// return params.value + '%'
// }
},
itemStyle: {
color: 'rgba(0, 121, 254, 1)',
borderRadius: [0, 100, 100, 0]
},
emphasis: {
focus: 'series'
},
data: this.mockDataList.map((item) => item + (Math.random() * 10).toFixed(0))
}
]
}
this[type + 'Echarts'].setOption(options)
this[type + 'Echarts'].on('click', (params) => {
console.log('params----', params)
console.log('params.name----', params.name)
console.log('params.value----', params.value)
})
},
zywtdEchartsInit() {
// 销毁之前的 echarts 图表(避免出现 echarts.js:2218 There is a chart instance already initialized on the dom. 警告)
if (this.zywtdEcharts) {
this.zywtdEcharts.dispose()
}
// echarts 初始化
this.zywtdEcharts = this.$echarts.init(document.getElementById('zywtd_echarts'))
const options = {
tooltip: {
trigger: 'none',
axisPointer: {
type: 'shadow'
}
},
grid: {
top: '2%',
left: '3%',
right: '10%',
bottom: '0%',
containLabel: true
// show: false,
},
xAxis: {
type: 'value',
show: false
},
yAxis: {
type: 'category',
axisLine: {
show: false
},
axisTick: {
show: false
},
splitLine: {
// show: true,
// lineStyle: {
// type: 'dashed'
// }
},
// offset: -10.5,
axisLabel: {
// show: true,
inside: true,
verticalAlign: 'bottom',
// lineHeight: 20
padding: [0, 0, 7, -5]
},
data: this.mockYAxisList1
},
series: [
{
name: '数量',
type: 'bar',
stack: 'total',
barWidth: '20%', // 15
// showBackground: true,
label: {
show: true,
position: 'right',
formatter: (params) => {
return params.value + '人次'
}
},
itemStyle: {
color: 'rgba(112, 182, 3, 1)'
// borderRadius: [0, 100, 100, 0]
},
emphasis: {
focus: 'series'
},
data: this.mockDataList.map((item) => item + (Math.random() * 10).toFixed(0))
}
]
}
this.zywtdEcharts.setOption(options)
}
}
}
</script>
<style lang='scss' scoped>
.TwelvePointsOverview {
height: 100%;
}
.header_container {
color: #999;
text-align: left;
font-size: 13px;
}
.main_container {
display: flex;
flex-direction: column;
height: calc(100% - 30px);
margin-top: 5px;
.top {
display: flex;
margin-bottom: 10px;
.top_item {
flex: 1;
background-color: #fff;
padding-bottom: 5px;
&:nth-child(2) {
margin: 0 10px;
}
.top_item_title {
text-align: left;
padding-left: 5px;
}
.top_item_container {
display: flex;
.top_item_container_item {
flex: 1;
.count {
font-size: 30px;
font-weight: 700;
margin: 5px 0;
}
.counts {
font-size: 22px;
font-weight: 700;
margin: 25px 0 15px;
}
.text {
}
.precent {
font-size: 12px;
color: #ccc;
}
.red {
color: #d9001b;
}
.yellow {
color: #f59a23;
}
.green {
color: #70b603;
}
}
}
}
}
.bottom {
flex: 1;
display: flex;
.bottom_item {
flex: 1;
background-color: #fff;
&:nth-child(2) {
margin: 0 10px;
}
.bottom_item_header {
::v-deep .el-tabs__nav-wrap {
padding: 0 20px;
}
::v-deep .el-tabs__header {
margin-bottom: unset;
}
}
.zywtd {
position: relative;
padding: 5px 10px;
text-align: left;
.all {
position: absolute;
top: 3px;
right: 10px;
font-size: 12px;
color: #ccc;
cursor: pointer;
}
}
.bottom_item_content {
width: 100%;
height: calc(100% - 40px);
#jy_echarts,
#fj_echarts,
#zywtd_echarts {
width: 100%;
height: 100%;
}
}
}
}
}
.blue-theme {
.bottom_item,
.top_item {
background-color: #0b3b6e !important;
}
.top,
.zywtd {
color: #fff;
}
}
.night-theme {
.bottom_item,
.top_item {
background-color: #2c3f5d !important;
}
.top,
.zywtd {
color: #fff;
}
}
</style>
页面展示
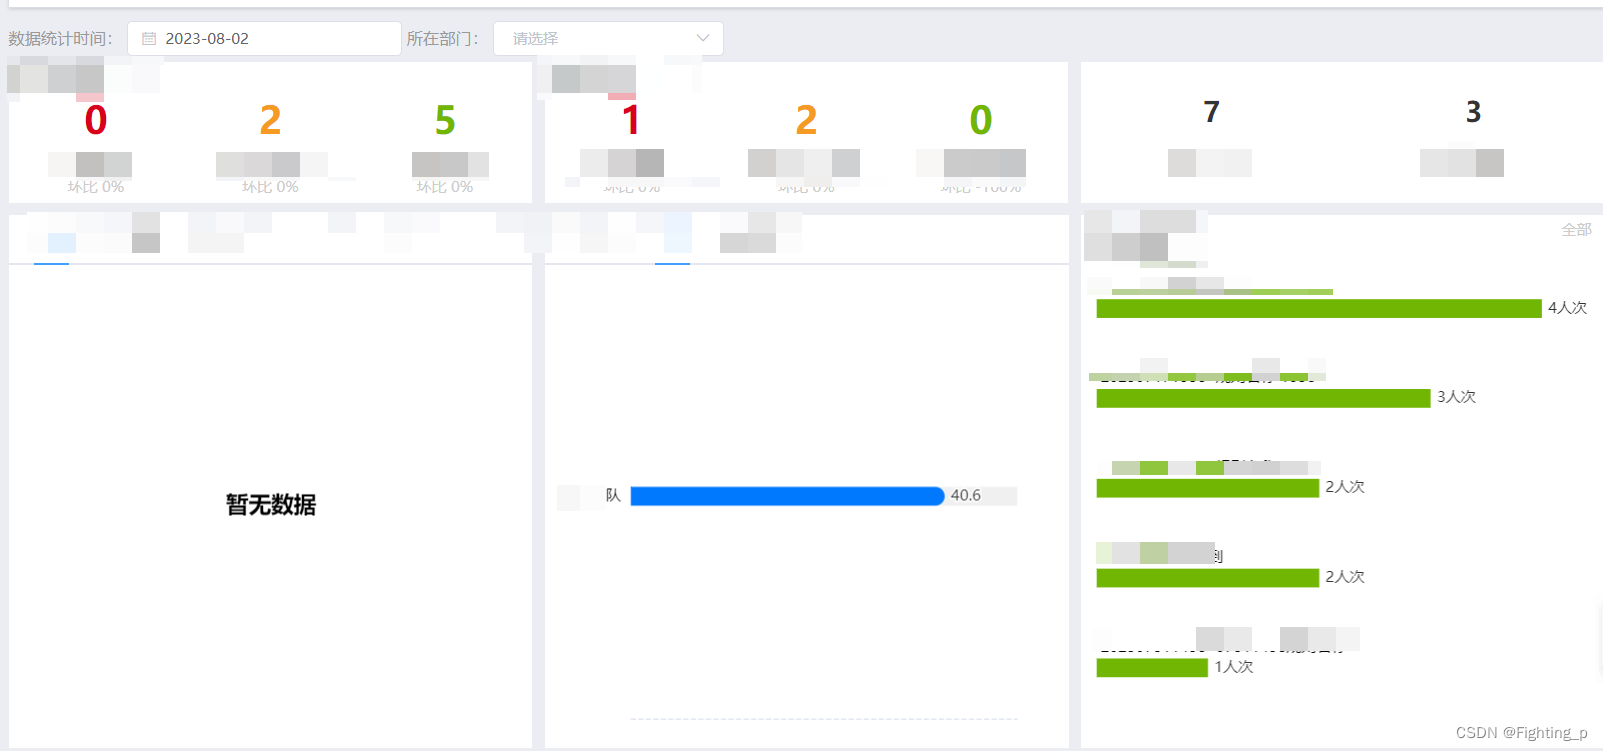
优化 - 无数据时展示“暂无数据”
<!-- 概览 -->
<template>
<div class="TwelvePointsOverview">
<div class="header_container">
数据统计时间:
<el-date-picker
v-model="searchForm.queryTime"
type="date"
placeholder="选择日期"
size="mini"
value-format="yyyy-MM-dd"
:picker-options="{
disabledDate(time) {
// 今天之后的日期不允许选择
return +new Date(time) > +new Date()
}
}"
/>
所在部门:
<el-select v-model="searchForm.policeDwdm" placeholder="请选择" size="mini" clearable>
<el-option
v-for="item in glbmOptions"
:key="item.value"
:label="item.label"
:value="item.value"
/>
</el-select>
</div>
<div class="main_container">
<div class="top">
<div v-loading="qinLianInfoLoading2" class="top_item">
<div class="top_item_title">警员勤廉码</div>
<div class="top_item_container">
<div class="top_item_container_item pointer" @click="toDetail('red')">
<div class="count red">{{ qinLianInfo2.redPoliceCount || 0 }}</div>
<div class="text">红码警员</div>
<div class="precent">环比 {{ qinLianInfo2.redPoliceHb || 0 }}%</div>
</div>
<div class="top_item_container_item pointer" @click="toDetail('yellow')">
<div class="count yellow">{{ qinLianInfo2.yellowPoliceCount || 0 }}</div>
<div class="text">黄码警员</div>
<div class="precent">环比 {{ qinLianInfo2.yellowPoliceHb || 0 }}%</div>
</div>
<div class="top_item_container_item pointer" @click="toDetail('green')">
<div class="count green">{{ qinLianInfo2.greenPoliceCount || 0 }}</div>
<div class="text">绿码警员</div>
<div class="precent">环比 {{ qinLianInfo2.greenPoliceHb || 0 }}%</div>
</div>
</div>
</div>
<div v-loading="qinLianInfoLoading1" class="top_item">
<div class="top_item_title">辅警勤廉码</div>
<div class="top_item_container">
<div class="top_item_container_item pointer" @click="toDetail('red')">
<div class="count red">{{ qinLianInfo1.redPoliceCount || 0 }}</div>
<div class="text">红码辅警</div>
<div class="precent">环比 {{ qinLianInfo1.redPoliceHb || 0 }}%</div>
</div>
<div class="top_item_container_item pointer" @click="toDetail('yellow')">
<div class="count yellow">{{ qinLianInfo1.yellowPoliceCount || 0 }}</div>
<div class="text">黄码辅警</div>
<div class="precent">环比 {{ qinLianInfo1.yellowPoliceHb || 0 }}%</div>
</div>
<div class="top_item_container_item pointer" @click="toDetail('green')">
<div class="count green">{{ qinLianInfo1.greenPoliceCount || 0 }}</div>
<div class="text">绿码辅警</div>
<div class="precent">环比 {{ qinLianInfo1.greenPoliceHb || 0 }}%</div>
</div>
</div>
</div>
<div v-loading="zywtdLoading" class="top_item">
<div class="top_item_container">
<div class="top_item_container_item">
<div class="counts">{{ recordScoreInfo.scorePoliceCount || 0 }}</div>
<div class="text">记分人次</div>
</div>
<!-- <div class="top_item_container_item">
<div class="counts">{{ recordScoreInfo.scoreGuaranteeCount || 0 }}</div>
<div class="text">担保减免</div>
</div>
<div class="top_item_container_item">
<div class="counts">{{ recordScoreInfo.scoreRecheckCount || 0 }}</div>
<div class="text">复核减轻</div>
</div> -->
<div class="top_item_container_item">
<div class="counts">{{ recordScoreInfo.scoreRecheckCancelCount || 0 }}</div>
<div class="text">复核撤销</div>
</div>
</div>
</div>
</div>
<div class="bottom">
<div class="bottom_item">
<div class="bottom_item_header">
<el-tabs v-model="activeNameJY" @tab-click="echartsInit('jy', '2')">
<el-tab-pane label="红码" name="red" />
<el-tab-pane label="黄码" name="yellow" />
<el-tab-pane label="绿码" name="green" />
</el-tabs>
</div>
<div v-loading="qinLianDwInfoLoading2" class="bottom_item_content">
<div id="jy_echarts" />
</div>
</div>
<div class="bottom_item">
<div class="bottom_item_header">
<el-tabs v-model="activeNameFJ" @tab-click="echartsInit('fj', '1')">
<el-tab-pane label="红码" name="red" />
<el-tab-pane label="黄码" name="yellow" />
<el-tab-pane label="绿码" name="green" />
</el-tabs>
</div>
<div v-loading="qinLianDwInfoLoading1" class="bottom_item_content">
<div id="fj_echarts" />
</div>
</div>
<div class="bottom_item">
<div class="bottom_item_header zywtd">
主要问题点
<span class="all" @click="$refs.AllProblemDialogRef.open()">全部</span>
</div>
<div v-loading="zywtdLoading" class="bottom_item_content">
<div id="zywtd_echarts" />
</div>
</div>
</div>
</div>
<!-- 所有问题点预览 -->
<AllProblemDialog ref="AllProblemDialogRef" @showEcharts="zywtdEchartsInit" />
</div>
</template>
<script>
import { mapGetters } from 'vuex'
import {
getPoliceColorCount,
getPoliceColorDwdmCount,
getPoliceScoreCount
} from '@/api/twelve-points'
import dayjs from 'dayjs'
import _ from 'lodash.clonedeep'
import AllProblemDialog from './components/AllProblemDialog'
export default {
name: 'TwelvePointsOverview',
components: {
AllProblemDialog
},
data() {
return {
searchForm: {
queryTime: dayjs(new Date()).format('YYYY-MM-DD'),
policeDwdm: ''
},
activeNameJY: 'red',
activeNameFJ: 'red',
jyEcharts: null, // 警员勤廉码数据
fjEcharts: null, // 辅警勤廉码数据
zywtdEcharts: null, // 主要问题点 echarts
qinLianInfo1: {}, // 辅警勤廉码统计数据
qinLianInfo2: {}, // 民警勤廉码统计数据
qinLianInfoLoading1: false,
qinLianInfoLoading2: false,
qinLianDwInfo1: {
red: { text: [], count: [] },
yellow: { text: [], count: [] },
green: { text: [], count: [] }
}, // 辅警按单位统计数据
qinLianDwInfo2: {
red: { text: [], count: [] },
yellow: { text: [], count: [] },
green: { text: [], count: [] }
}, // 民警按单位统计数据
qinLianDwInfoLoading1: false,
qinLianDwInfoLoading2: false,
recordScoreInfo: {}, // 记分统计数量信息
zywtdLoading: false,
mainProblemPointsInfo: {
text: [],
count: []
} // 主要问题点列表
}
},
computed: {
...mapGetters(['glbmOptions', 'theme'])
},
watch: {
searchForm: {
async handler(val) {
if (
document.getElementById('jy_echarts') &&
document.getElementById('fj_echarts') &&
document.getElementById('zywtd_echarts')
) {
// 页面 dom 渲染 完之后才可以 init 主要用于页面顶部的搜索区域数据改变
this.init(val)
}
},
immediate: true,
deep: true
},
theme: {
handler(val) {
this.echartsInit('jy', '2')
this.echartsInit('fj', '1')
this.zywtdEchartsInit('zywtd_echarts', 8)
}
}
},
created() {},
mounted() {
this.init(this.searchForm)
window.addEventListener('resize', () => {
if (document.getElementById('jy_echarts')) {
this.jyEcharts = this.$echarts.init(document.getElementById('jy_echarts'))
this.jyEcharts.resize()
}
if (document.getElementById('fj_echarts')) {
this.fjEcharts = this.$echarts.init(document.getElementById('fj_echarts'))
this.fjEcharts.resize()
}
if (document.getElementById('zywtd_echarts')) {
this.zywtdEcharts = this.$echarts.init(document.getElementById('zywtd_echarts'))
this.zywtdEcharts.resize()
}
if (document.getElementById('all_zywtd_echarts')) {
this.zywtdEcharts = this.$echarts.init(document.getElementById('all_zywtd_echarts'))
this.zywtdEcharts.resize()
}
})
},
methods: {
init(val = {}) {
this.getPoliceColorCount({ ...val, ryzt: '1' } || {})
this.getPoliceColorCount({ ...val, ryzt: '2' } || {})
Promise.all([this.getPoliceColorDwdmCount({ ...val, ryzt: '1' } || {})]).then(() => {
this.echartsInit('fj', '1')
})
Promise.all([this.getPoliceColorDwdmCount({ ...val, ryzt: '2' } || {})]).then(() => {
this.echartsInit('jy', '2')
})
Promise.all([this.getPoliceScoreCount(val || {})]).then(() => {
this.zywtdEchartsInit('zywtd_echarts', 8)
})
},
echartsInit(type, jyzt) {
if (this[type + 'Echarts']) {
this[type + 'Echarts'].dispose()
}
this[type + 'Echarts'] = this.$echarts.init(document.getElementById(type + '_echarts'))
let info = this['qinLianDwInfo' + jyzt][this['activeName' + type.toUpperCase()]]
const options = {
title: {
show: !info.bmInfo.length, // 无数据时展示“暂无数据”
text: '暂无数据',
left: 'center', // 水平居中
top: 'center', // 垂直居中
textStyle: {
color: this.theme !== 'light-theme' ? '#fff' : '#000' // 换肤颜色改变
}
},
tooltip: {
trigger: 'none',
axisPointer: {
type: 'shadow'
}
},
grid: {
top: '2%',
left: '3%',
right: '10%',
bottom: '1%',
containLabel: true
// show: false,
},
xAxis: {
type: 'value',
show: false
},
yAxis: {
type: 'category',
axisLine: {
show: false
},
axisTick: {
show: false
},
splitLine: {
show: true,
lineStyle: {
type: 'dashed',
color: this.theme !== 'light-theme' ? '#1f5693' : '#e0e6f1' // 换肤颜色改变
}
},
axisLabel: {
color: this.theme !== 'light-theme' ? '#fff' : '#000' // 换肤颜色改变
},
data: info.bmInfo.map((item) => item.name)
},
series: [
{
name: '数量',
type: 'bar',
stack: 'total',
// barWidth: '20%',
barWidth: 15,
showBackground: true,
// cursor: type === 'fj' ? 'default' : 'pointer', // 鼠标悬浮样式
label: {
show: true,
position: 'right'
// formatter: (params) => {
// return params.value + '%'
// }
},
itemStyle: {
color: 'rgba(0, 121, 254, 1)',
borderRadius: [0, 100, 100, 0]
},
emphasis: {
focus: 'series'
},
data: info.count
}
]
}
this[type + 'Echarts'].setOption(options)
this[type + 'Echarts'].on('click', (params) => {
const bmList = info.bmInfo
const currentBm = bmList.filter((item) => item.name === params.name)
this.$router.push({
path: '/twelve-points/police-officer-scoring-results',
query: {
ssbm: (currentBm && currentBm.length && currentBm[0].code) || '',
color: this['activeName' + type.toUpperCase()]
}
})
})
},
zywtdEchartsInit(dom, num = this.mainProblemPointsInfo.text.length) {
if (this.zywtdEcharts && !this.$refs.AllProblemDialogRef.dialogVisible) {
this.zywtdEcharts.dispose()
}
this.zywtdEcharts = this.$echarts.init(document.getElementById(dom))
const options = {
title: {
show: !this.mainProblemPointsInfo.text.length, // 无数据时展示“暂无数据”
text: '暂无数据',
left: 'center', // 水平居中
top: 'center', // 垂直居中
textStyle: {
color: this.theme !== 'light-theme' ? '#fff' : '#000' // 换肤颜色改变
}
},
tooltip: {
trigger: 'none',
axisPointer: {
type: 'shadow'
}
},
grid: {
top: '2%',
left: '3%',
right: 50,
bottom: '0%',
containLabel: true
// show: false,
},
xAxis: {
type: 'value',
show: false
},
yAxis: {
type: 'category',
axisLine: {
show: false
},
axisTick: {
show: false
},
splitLine: {
// show: true,
// lineStyle: {
// type: 'dashed'
// }
},
// offset: -10.5,
axisLabel: {
// show: true,
inside: true,
verticalAlign: 'bottom',
// lineHeight: 20
padding: [0, 0, 10, -5],
color: this.theme !== 'light-theme' ? '#fff' : '#000' // 换肤颜色改变
},
data: this.mainProblemPointsInfo.text.slice(0, num)
},
series: [
{
name: '数量',
type: 'bar',
stack: 'total',
// barWidth: '20%',
barWidth: 15,
// showBackground: true,
cursor: 'default', // 鼠标悬浮样式
label: {
show: true,
position: 'right',
formatter: (params) => {
return params.value + '人次'
}
},
itemStyle: {
color: 'rgba(112, 182, 3, 1)'
// borderRadius: [0, 100, 100, 0]
},
emphasis: {
focus: 'series'
},
data: this.mainProblemPointsInfo.count.slice(0, num)
}
]
}
this.zywtdEcharts.setOption(options)
},
// 获取勤廉码警员统计数量
getPoliceColorCount(val = {}) {
this['qinLianInfoLoading' + val.ryzt] = true
return new Promise((resolve, reject) => {
getPoliceColorCount(val)
.then((res) => {
this.$common.CheckCode(
res,
null,
() => {
const {
redPoliceCount,
redPoliceHb,
yellowPoliceCount,
yellowPoliceHb,
greenPoliceCount,
greenPoliceHb
} = res.data
this['qinLianInfo' + val.ryzt] = {
redPoliceCount,
redPoliceHb,
yellowPoliceCount,
yellowPoliceHb,
greenPoliceCount,
greenPoliceHb
}
resolve()
},
() => {
reject()
}
)
})
.catch(() => {
reject()
})
.finally(() => {
this['qinLianInfoLoading' + val.ryzt] = false
})
})
},
// 获取勤廉码警员按单位统计数量
getPoliceColorDwdmCount(val = {}) {
this['qinLianDwInfoLoading' + val.ryzt] = true
return new Promise((resolve, reject) => {
getPoliceColorDwdmCount(val)
.then((res) => {
this.$common.CheckCode(
res,
null,
() => {
const { redPoliceMap, yellowPoliceMap, greenPoliceMap } = res.data
;[
{ red: redPoliceMap || {} },
{ yellow: yellowPoliceMap || {} },
{ green: greenPoliceMap || {} }
].map((item) => {
const key = (Object.keys(item) && Object.keys(item)[0]) || ''
const textList = Object.keys(item[key] || {})
const bmInfo = textList.map((i, index) => {
return {
name: i || '',
code:
(item[key] &&
item[key][i] &&
item[key][i][0] &&
item[key][i][0].policeDwdm) ||
0
}
})
const count = textList.map((i, index) => {
const currentCount =
(item[key] &&
item[key][i] &&
item[key][i]
.map((currentCountItem) => currentCountItem.finalScore || 0)
.reduce((prev, curr) => prev + curr)) ||
0
return currentCount
})
this['qinLianDwInfo' + val.ryzt][key] = {
bmInfo,
count
}
})
resolve()
},
() => {
reject()
}
)
})
.catch(() => {
reject()
})
.finally(() => {
this['qinLianDwInfoLoading' + val.ryzt] = false
})
})
},
// 获取记分统计信息
getPoliceScoreCount(val) {
this.zywtdLoading = true
return new Promise((resolve, reject) => {
getPoliceScoreCount(val)
.then((res) => {
console.log('res----', res)
this.$common.CheckCode(
res,
null,
() => {
const {
scoreGuaranteeCount,
scorePoliceCount,
scoreRecheckCount,
scoreRecheckCancelCount
} = res.data
this.recordScoreInfo = {
scorePoliceCount, // 记分人次
scoreGuaranteeCount, // 担保减免
scoreRecheckCount, // 复核减轻
scoreRecheckCancelCount // 复核撤销
}
if (res.data.scoreRuleCount) {
this.mainProblemPointsInfo.text = Object.keys(res.data.scoreRuleCount)
this.mainProblemPointsInfo.count = Object.keys(res.data.scoreRuleCount).map(
(key) => res.data.scoreRuleCount[key]
)
}
resolve()
},
() => {
reject()
}
)
})
.catch(() => {
reject()
})
.finally(() => {
this.zywtdLoading = false
})
})
},
// 跳转到“警员记分结果”页面
toDetail(color = '') {
this.$router.push({
path: '/twelve-points/police-officer-scoring-results',
query: {
ssbm: this.searchForm.policeDwdm || '',
color
}
})
}
}
}
</script>
<style lang='scss' scoped>
.TwelvePointsOverview {
height: 100%;
}
.header_container {
color: #999;
text-align: left;
font-size: 13px;
}
.main_container {
display: flex;
flex-direction: column;
height: calc(100% - 30px);
margin-top: 5px;
.top {
display: flex;
margin-bottom: 10px;
.top_item {
flex: 1;
background-color: #fff;
padding-bottom: 5px;
&:nth-child(2) {
margin: 0 10px;
}
.top_item_title {
text-align: left;
padding-left: 5px;
}
.top_item_container {
display: flex;
.top_item_container_item {
flex: 1;
.count {
font-size: 30px;
font-weight: 700;
margin: 5px 0;
}
.counts {
font-size: 22px;
font-weight: 700;
margin: 25px 0 15px;
}
.text {
}
.precent {
font-size: 12px;
color: #ccc;
}
.red {
color: #d9001b;
}
.yellow {
color: #f59a23;
}
.green {
color: #70b603;
}
}
.pointer {
cursor: pointer;
}
}
}
}
.bottom {
flex: 1;
display: flex;
.bottom_item {
flex: 1;
background-color: #fff;
&:nth-child(2) {
margin: 0 10px;
}
.bottom_item_header {
::v-deep .el-tabs__nav-wrap {
padding: 0 20px;
}
::v-deep .el-tabs__header {
margin-bottom: unset;
}
}
.zywtd {
position: relative;
padding: 5px 10px;
text-align: left;
.all {
position: absolute;
top: 3px;
right: 10px;
font-size: 12px;
color: #ccc;
cursor: pointer;
}
}
.bottom_item_content {
width: 100%;
height: calc(100% - 40px);
#jy_echarts,
#fj_echarts,
#zywtd_echarts {
width: 100%;
height: 100%;
}
}
}
}
}
.blue-theme {
.bottom_item,
.top_item {
background-color: #0b3b6e !important;
}
.top,
.zywtd {
color: #fff;
}
}
.night-theme {
.bottom_item,
.top_item {
background-color: #2c3f5d !important;
}
.top,
.zywtd {
color: #fff;
}
}
</style>
优化页面展示
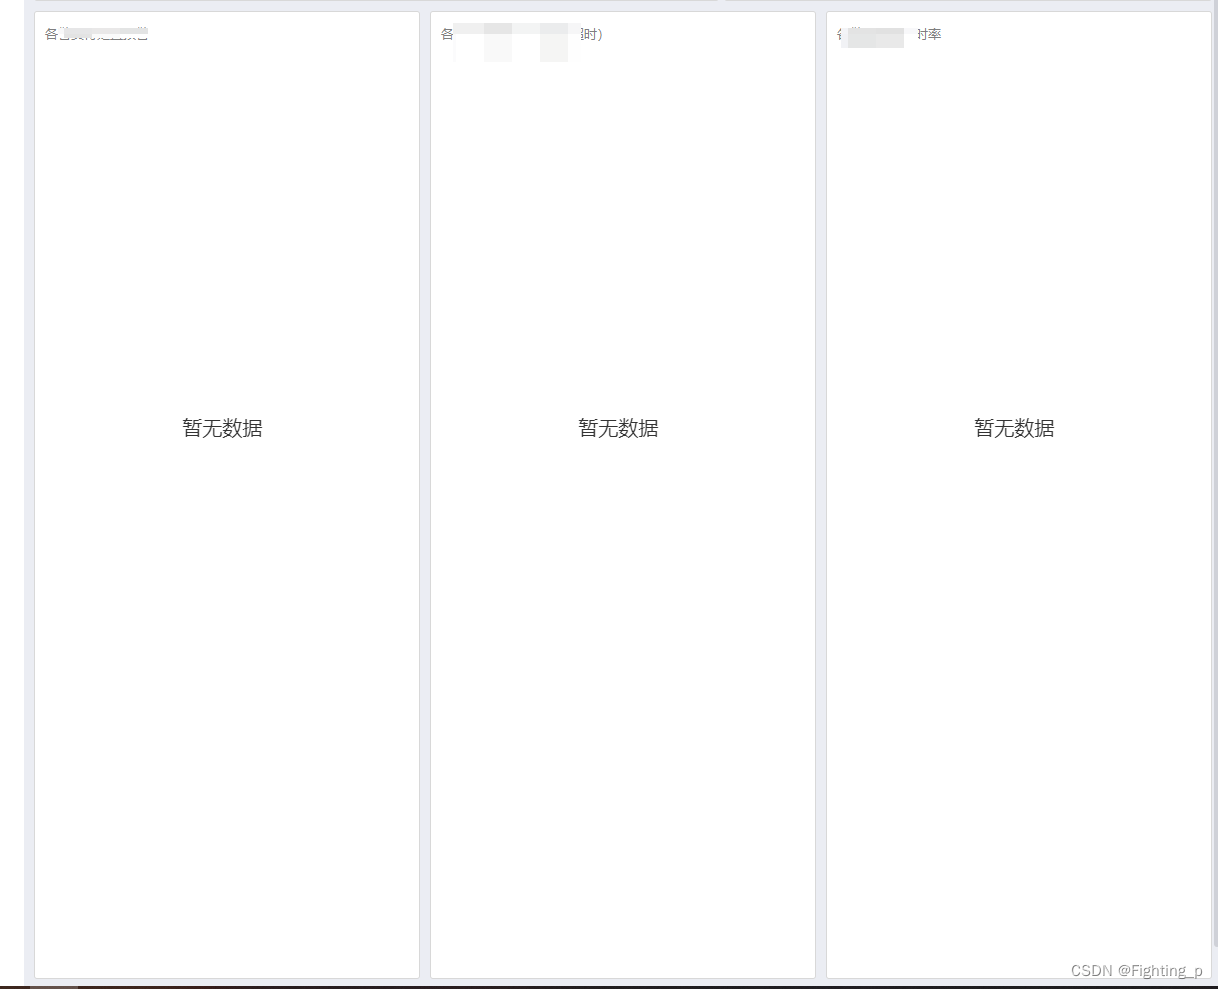
另一种“暂无数据”展示
个人觉得上一种“暂无数据”展示方法简单点
- 代码
var noDataOptions = { grid: { right: '-10%' }, xAxis: { show: false, max: 230 }, yAxis: { show: false, max: 100 }, series: [ { data: ['60'], type: 'line', symbolSize: [0.01, 0.01], itemStyle: { color: '#fff' }, label: { show: true, position: 'right', formatter: (params) => { return '暂无数据' }, fontSize: 20 } } ] } - 页面
2.饼图 轮播
【注意】如果重新绘制饼图的话需要把之前的定时器清除掉,否则会多个定时器累加,轮播速度快于初始设定速度
代码
data(){
return {
......
changePieInterval: null, // 轮播定时器返回值,用于清除定时器
currentIndex: -1 // 当前高亮图形在饼图数据中的下标
......
}
},
mounted() {
window.addEventListener('resize', () => {
......
if (document.getElementById('business_num_pie')) {
const myChart3 = this.$echarts.init(document.getElementById('business_num_pie'))
myChart3.resize()
}
......
})
/**** 【注意】页面销毁时清除定时器 ****/
this.$once('hook:beforeDestroy', () => {
window.clearInterval(this.changePieInterval)
this.changePieInterval = null
})
},
methods: {
init() {
......
this.business_num_pie(this.activeName, this.activeName === 'ywlxCount' ? 'ywlxView' : 'mxmc')
.......
},
business_num_pie(msgTitle, textView) {
/**** 【注意】每次绘制echarts图表时,需要将定时器清除掉,避免多个定时器叠加导致轮播时间加快 ****/
window.clearInterval(this.changePieInterval)
this.changePieInterval = null
setTimeout(() => {
const myChart3 = this.$echarts.init(document.getElementById('business_num_pie'))
let seriesList = {}
for (let i = 0; i < this.centerDatas.length; i++) {
if (this.centerDatas[i].msgTitle === msgTitle) {
seriesList = this.centerDatas[i].msgContent
.filter((item) => item.count !== 0)
.map((item) => {
item.name = item[textView]
item.value = item.count
return item
})
}
}
const options = {
tooltip: {
trigger: 'item'
},
legend: {
width: 300,
orient: 'vertical', // 'vertical'
bottom: '10%',
right: 0,
formatter: function (name) {
for (let i = 0; i < seriesList.length; i++) {
if (seriesList[i].name === name) {
const count = seriesList[i].count
const percent = `${seriesList[i].zb}%`
return `{name| ${name}} {count| ${count}笔 |} {percent| ${percent}} `
}
}
},
textStyle: {
// rich放在textStyle里面
rich: {
name: {
color: this.echartsLegendColor,
fontSize: 14
},
count: {
color: this.echartsLegendColor,
fontSize: 14
},
percent: {
color: this.echartsLegendColor,
fontSize: 14
}
}
}
},
series: [
{
itemStyle: {
borderRadius: 0,
borderColor: '#fff',
borderWidth: 2
},
name: '业务预警',
type: 'pie',
radius: ['50%', '70%'],
center: ['24%', '50%'],
avoidLabelOverlap: false,
label: {
normal: {
show: false,
position: 'center',
color: '#4c4a4a',
formatter(data) {
let name = ''
let value = ''
for (let i = 0; i < seriesList.length; i++) {
if (seriesList[i][textView] === data.name) {
name = data.name
value = seriesList[i].count
return `{name| ${name}} \n\n {value| ${value}}`
// return `${data.name} \n\r ${familyZfzlNumData[i].value}`
}
}
},
rich: {
name: {
fontSize: 16,
fontFamily: '微软雅黑',
color: this.echartsColor
},
value: {
fontFamily: '微软雅黑',
fontSize: 28,
color: this.echartsColor,
lineHeight: 30
}
}
},
emphasis: {
// 中间文字显示
show: true
}
},
emphasis: {
label: {
show: true,
fontSize: '20',
fontWeight: 'bold'
}
},
labelLine: {
show: false
},
data: seriesList
}
],
grid: {
containLabel: true
}
}
myChart3.setOption(options)
myChart3.on('click', (params) => {
this.$router.push({
path: '/warning-manage-common/warning-query',
query: {
xtlb: params.data.ywlx,
date: JSON.stringify({
kssj: this.$common.getDay(0, '-'),
jssj: this.$common.getDay(0, '-')
}),
yclx: JSON.stringify(['supervise'])
}
})
})
/**** 饼图轮播 start ****/
const that = this
this.changePieInterval = setInterval(selectPie, 1000) // 设置自动切换高亮图形的定时器
function highlightPie() {
/** ** 取消所有高亮并高亮当前图形 ****/
// 遍历饼图数据,取消所有图形的高亮效果
for (var idx in options.series[0].data) {
myChart3.dispatchAction({
type: 'downplay',
seriesIndex: 0,
dataIndex: idx
})
}
// 高亮当前图形
myChart3.dispatchAction({
type: 'highlight',
seriesIndex: 0,
dataIndex: that.currentIndex
})
}
myChart3.on('mouseover', (params) => {
// 用户鼠标悬浮到某一图形时,停止自动切换并高亮鼠标悬浮的图形
window.clearInterval(this.changePieInterval)
this.changePieInterval = null
this.currentIndex = params.dataIndex
highlightPie()
})
myChart3.on('mouseout', (params) => {
// 用户鼠标移出时,重新开始自动切换
if (this.changePieInterval) {
window.clearInterval(this.changePieInterval)
this.changePieInterval = null
}
this.changePieInterval = setInterval(selectPie, 1000)
})
function selectPie() {
console.log('13456----', 13456)
// 高亮效果切换到下一个图形
var dataLen = options.series[0].data.length
that.currentIndex = (that.currentIndex + 1) % dataLen
highlightPie()
}
/**** 饼图轮播 end ****/
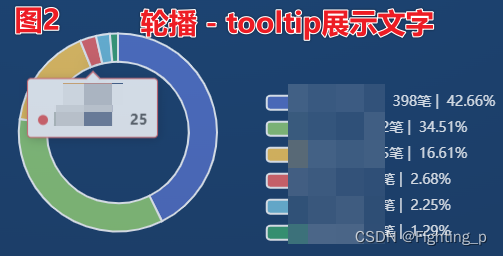
/** ** ---------以下为饼图轮播另一种方法,但是展示的文字是tooltip显示,不是在饼图内展示(未详细尝试_还有bug - 如图二)--------- ****/
// let currentIndex = -1
// setInterval(function () {
// // 不选中
// var dataLen = options.series[0].data.length
// myChart3.dispatchAction({
// type: 'pieUnSelect',
// seriesIndex: 0,
// dataIndex: currentIndex
// })
// currentIndex = (currentIndex + 1) % dataLen
// // 选中
// myChart3.dispatchAction({
// type: 'pieSelect',
// seriesIndex: 0,
// dataIndex: currentIndex
// })
// // 显示 tooltip
// myChart3.dispatchAction({
// type: 'showTip',
// seriesIndex: 0,
// dataIndex: currentIndex
// })
// }, 1000)
}, 10)
},
}
效果展示

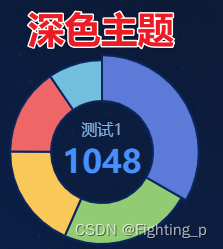
3.饼图静态当前高亮
<!-- 执法办案积分 -->
<template>
  <div id="LawCaseIntegral" />
</template>

<script>
export default {
  name: 'LawCaseIntegral',
  components: {},

  props: {
    theme: {
      type: String,
      required: true
    },
    lightEchartsNoDataColor: {
      type: String,
      required: true
    },
    blueEchartsNoDataColor: {
      type: String,
      required: true
    }
  },

  data() {
    return {
      Echarts: null
    }
  },

  computed: {
    options() {
      return {
        title: {
          show: false,
          text: '暂无数据',
          left: 'center',
          top: 'center',
          textStyle: {
            color: this[this.theme + 'EchartsNoDataColor']
          }
        },
        tooltip: {
          trigger: 'item'
        },
        // legend: {
        //   top: '5%',
        //   left: 'center'
        // },
        series: [
          {
            name: '执法办案积分',
            type: 'pie',
            radius: ['50%', '90%'],
            avoidLabelOverlap: false,
            itemStyle: {
              // borderRadius: 10,
              borderWidth: 2,
              borderColor: this.theme === 'light' ? '#fff' : '#0c265d'
            },
            label: {
              show: false,
              position: 'center'
            },
            emphasis: {
              label: {
                show: true,
                fontSize: 20,
                fontWeight: 'bold',
                // renderMode: 'html', // 此处无该属性
                // formatter: (params) => {
                //   console.log('params----', params)
                //   return `
                //     <div>${params.seriesName}</div>
                //     <div>${params.value}</div>
                //     `
                // } // 【模板字符串无法解析 html 标签】,使用如下 rich 属性

                formatter: ['{b|{b}}', '{c|{c}}'].join('\n'),
                // 在 rich 里面,可以自定义富文本样式。利用富文本样式,可以在标签中做出非常丰富的效果。
                // 参考地址:https://echarts.apache.org/zh/option.html#series-pie.emphasis.label.rich.%3Cstyle_name%3E
                rich: {
                  b: {
                    color: this.theme === 'light' ? '#a5a9ae' : '#81b4e1',
                    fontSize: 16,
                    padding: [0, 0, 10, 0]
                  },
                  c: {
                    fontSize: 32,
                    color: '#468ffd',
                    fontWeight: 'bold'
                  }
                }
              }
            },
            labelLine: {
              show: false
            },
            data: [
              { value: 1048, name: '测试1' },
              { value: 735, name: '测试2' },
              { value: 580, name: '测试3' },
              { value: 484, name: '测试4' },
              { value: 300, name: '测试5' }
            ]
          }
        ]
      }
    }
  },

  watch: {
    theme() {
      this.init()
    }
  },

  created() {},
  mounted() {
    window.addEventListener('resize', () => {
      if (document.getElementById('LawCaseIntegral')) {
        this.Echarts = this.$echarts.init(document.getElementById('LawCaseIntegral'))
        this.Echarts.resize()
      }
    })

    this.init()
  },

  methods: {
    init() {
      console.log('"init"----', 'init')
      if (this.Echarts) {
        this.Echarts.dispose()
      }
      this.Echarts = this.$echarts.init(document.getElementById('LawCaseIntegral'))

      this.Echarts.setOption(this.options)
      // 高亮
      let currentIndex = 0
      this.Echarts.dispatchAction({
        type: 'highlight',
        seriesIndex: 0,
        dataIndex: currentIndex
      })
      this.Echarts.on('mouseover', (params) => {
        // 取消之前高亮
        this.Echarts.dispatchAction({
          type: 'downplay',
          seriesIndex: 0,
          dataIndex: currentIndex
        })
        // 获取当前高亮索引
        currentIndex = params.dataIndex
        // 设置当前高亮
        this.Echarts.dispatchAction({
          type: 'highlight',
          seriesIndex: 0,
          dataIndex: params.dataIndex
        })
      })
    }
  }
}
</script>

<style lang='scss' scoped>
#LawCaseIntegral {
  width: 100%;
  height: 100%;
}
</style>

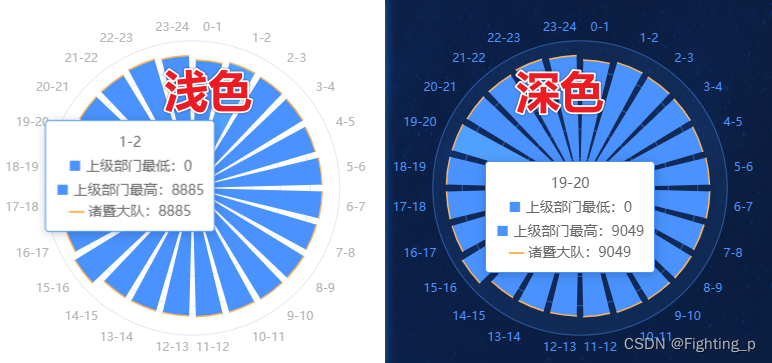
4.柱状图画时间段
<!-- 时段分布 - 组件代码 -->
<template>
  <div id="ScenePunishTime" />
</template>

<script>
export default {
  name: 'ScenePunishTime',
  components: {},

  props: {
    theme: {
      type: String,
      required: true
    },
    lightEchartsNoDataColor: {
      type: String,
      required: true
    },
    blueEchartsNoDataColor: {
      type: String,
      required: true
    },
    dataList: {
      type: Array,
      required: true
    },
    sjdw: {
      type: String,
      required: true
    },
    dwdmmc: {
      type: String,
      required: true
    }
  },

  data() {
    return {
      Echarts: null
    }
  },

  computed: {
    options() {
      const data = [...Array(24).keys()].map((item) => [0, 0, 0]) // ['上级部门最低', '上级部门最高', '当前部门']
      // 当前部门数据处理
      this.dataList[0].forEach((item) => {
        data[item.time * 1][2] = item.total
      })
      // 上级部门数据处理(最高)
      this.dataList[1].forEach((item) => {
        data[item.time * 1][1] = item.total
      })

      const cities = [...Array(24).keys()].map((item) => `${item}-${item + 1}`)
      const barHeight = 50

      return {
        title: {
          show: !(this.dataList[0].length || this.dataList[1].length),
          text: '暂无数据',
          left: 'center',
          top: 'center',
          textStyle: {
            color: this[this.theme + 'EchartsNoDataColor']
          }
        },
        // legend: {
        //   show: false
        // },
        grid: {
          top: 100
        },
        angleAxis: {
          type: 'category',
          axisLine: {
            show: false
          },
          axisTick: {
            show: false
          },
          axisLabel: {
            color: this.theme === 'light' ? '#b3b6ba' : '#4992ff'
          },
          splitArea: {
            show: true,
            areaStyle: {
              color: [this.theme === 'light' ? 'transparent' : '#4992ff19']
            }
          },
          data: cities
        },
        tooltip: {
          show: true,
          formatter: (params) => {
            const id = params.dataIndex

            return (
              cities[id] +
              `<br><i style="color: #4992ff;font-size: 22px;">■</i> ${
                this.sjdw || '上级部门'
              }最低:` +
              data[id][0] +
              `<br><i style="color: #4992ff;font-size: 22px;">■</i> ${
                this.sjdw || '上级部门'
              }最高:` +
              data[id][1] +
              `<br><i style="color: #ffb556;font-weight:bold;">—</i> ${this.dwdmmc || '当前部门'}:` +
              data[id][2]
            )
          }
        },
        radiusAxis: {
          axisLine: {
            show: false
          },
          axisTick: {
            show: false
          },
          axisLabel: {
            show: false
          },
          splitLine: {
            lineStyle: {
              color: this.theme === 'light' ? '#c7d0e780' : '#4992ff80'
            }
          }
        },
        polar: {},
        series: [
          {
            type: 'bar',
            itemStyle: {
              color: 'transparent'
            },
            data: data.map((d) => d[0]),
            coordinateSystem: 'polar',
            stack: 'Min Max',
            silent: true
          },
          {
            type: 'bar',
            itemStyle: {
              color: '#4992ff'
            },
            data: data.map((d) => d[1] - d[0]),
            coordinateSystem: 'polar',
            name: this.sjdw || '上级部门',
            stack: 'Min Max'
          },
          {
            type: 'bar',
            itemStyle: {
              color: 'transparent'
            },
            data: data.map((d) => d[2] - barHeight),
            coordinateSystem: 'polar',
            stack: 'Average',
            silent: true,
            z: 10
          },
          {
            type: 'bar',
            itemStyle: {
              color: '#ffb556'
            },
            data: data.map((d) =>
              this.dataList[0].length || this.dataList[1].length ? barHeight * 2 : 0
            ),
            coordinateSystem: 'polar',
            name: this.dwdmmc || '当前部门',
            stack: 'Average',
            barGap: '-100%',
            z: 10
          }
        ]
      }
    }
  },

  watch: {
    theme() {
      this.init()
    },
    dataList() {
      this.init()
    }
  },

  created() {},
  mounted() {
    window.addEventListener('resize', () => {
      if (document.getElementById('ScenePunishTime')) {
        this.Echarts = this.$echarts.init(document.getElementById('ScenePunishTime'))
        this.Echarts.resize()
      }
    })

    this.init()
  },

  methods: {
    init() {
      console.log('"init"----', 'init')
      if (this.Echarts) {
        this.Echarts.dispose()
      }
      this.Echarts = this.$echarts.init(document.getElementById('ScenePunishTime'))

      this.Echarts.setOption(this.options)
    }
  }
}
</script>

<style lang='scss' scoped>
#ScenePunishTime {
  width: 100%;
  height: 100%;
}
</style>
dataList 数据
const dataList = [
	[
		{ time: '0', total: 8705 },
		{ time: '1', total: 8885 },
		{ time: '10', total: 8800 },
		{ time: '11', total: 8749 },
		{ time: '12', total: 8694 },
		{ time: '13', total: 8715 },
		{ time: '14', total: 8729 },
		{ time: '15', total: 9378 },
		{ time: '16', total: 9059 },
		{ time: '17', total: 9065 },
		{ time: '18', total: 9072 },
		{ time: '19', total: 9049 },
		{ time: '2', total: 8829 },
		{ time: '20', total: 9002 },
		{ time: '21', total: 9001 },
		{ time: '22', total: 9119 },
		{ time: '23', total: 8999 },
		{ time: '3', total: 8792 },
		{ time: '4', total: 8709 },
		{ time: '5', total: 8796 },
		{ time: '6', total: 8817 },
		{ time: '7', total: 8790 },
		{ time: '8', total: 8870 },
		{ time: '9', total: 8860 },
	],
	[
		{ time: '0', total: 8705 },
		{ time: '1', total: 8885 },
		{ time: '10', total: 8800 },
		{ time: '11', total: 8749 },
		{ time: '12', total: 8694 },
		{ time: '13', total: 8715 },
		{ time: '14', total: 8729 },
		{ time: '15', total: 9378 },
		{ time: '16', total: 9059 },
		{ time: '17', total: 9065 },
		{ time: '18', total: 9072 },
		{ time: '19', total: 9049 },
		{ time: '2', total: 8829 },
		{ time: '20', total: 9002 },
		{ time: '21', total: 9001 },
		{ time: '22', total: 9119 },
		{ time: '23', total: 8999 },
		{ time: '3', total: 8792 },
		{ time: '4', total: 8709 },
		{ time: '5', total: 8796 },
		{ time: '6', total: 8817 },
		{ time: '7', total: 8790 },
		{ time: '8', total: 8870 },
		{ time: '9', total: 8862 },
	],
]
效果展示


 688
688


 被折叠的 条评论
为什么被折叠?
被折叠的 条评论
为什么被折叠?
 到【灌水乐园】发言


