


本文记录小提琴图绘图模板。
目录
0. 导入数据
#加载包
library(ggplot2) # Create Elegant Data Visualisations Using the Grammar of Graphics
library(palmerpenguins) # Palmer Archipelago (Antarctica) Penguin Data
library(tidyverse) # Easily Install and Load the 'Tidyverse'
library(ggforce) # Accelerating 'ggplot2'
library(gghalves) # Compose Half-Half Plots Using Your Favourite Geoms
library(ggdist) # Visualizations of Distributions and Uncertainty

#使用palmerpenguin包中的数据
df <- penguins
# df <- read.table("data.txt", header = 1, check.names = F, sep = "\t")
#使用tidyverse包对数据进行处理
df <- df %>%
  drop_na()
1. 无数据点小提琴图
p1 <- ggplot(df, aes(x=species, y=flipper_length_mm, fill=species))+#指定数据
  geom_violin()+
  scale_fill_manual(values = c("#5cc3e8","#ffdb00","#79ceb8"))+
  theme_bw()+
  theme(panel.grid = element_blank(),
        axis.text = element_text(color = 'black',size=12),
        axis.title = element_text(color = 'black',size=15),
        legend.position = "none")
p1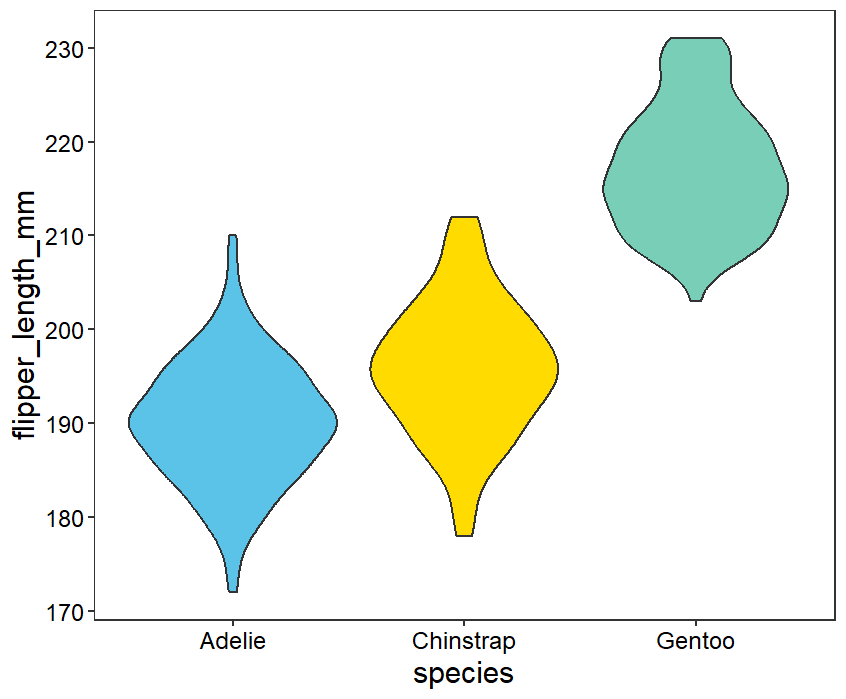
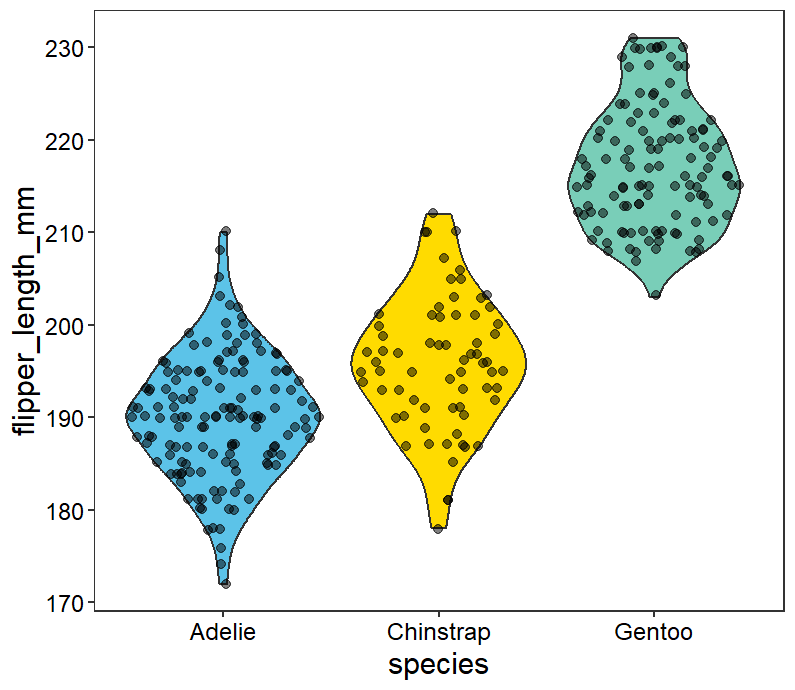
2. 有数据点小提琴图
3. 分组小提琴
p3 <- ggplot(df, aes(x=species, y=flipper_length_mm, fill=sex))+#指定数据
  geom_violin()+
  geom_sina(alpha=0.5,size=2,color="black")+
  scale_fill_manual(values = c("#5cc3e8","#ffdb00"))+
  theme_bw()+
  theme(panel.grid = element_blank(),
        axis.text = element_text(color = 'black',size=12),
        axis.title = element_text(color = 'black',size=15),
        legend.title = element_text(color = 'red',size=15),
        legend.text = element_text(color = 'black',size=10))
p3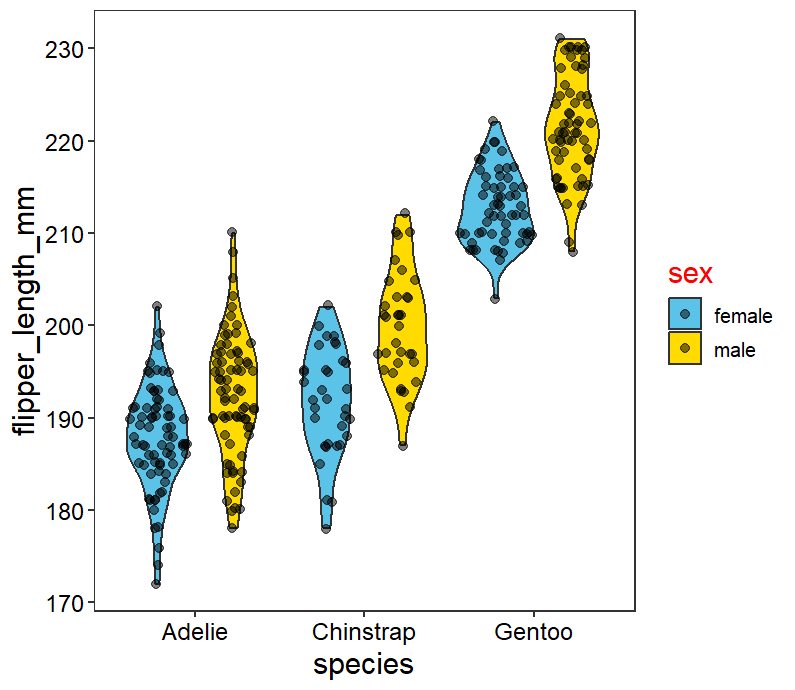
4. 半小提琴
p4 <- ggplot(df, aes(x=species, y=flipper_length_mm, fill=species))+#指定数据
  geom_half_violin()+
  scale_fill_manual(values = c("#5cc3e8","#ffdb00","#79ceb8"))+
  theme_bw()+
  theme(panel.grid = element_blank(),
        axis.text = element_text(color = 'black',size=12),
        axis.title = element_text(color = 'black',size=15),
        legend.position = "none")
p4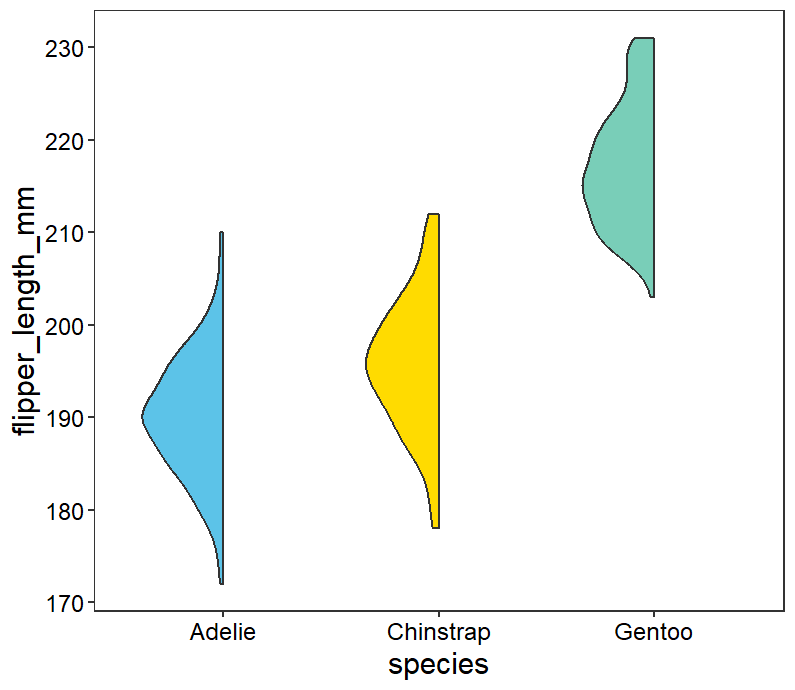
5. 半小提琴图联合散点图、箱线图复杂图形
p5 <- ggplot(df,aes(species,flipper_length_mm,fill=species))+
  geom_half_violin(position = position_nudge(x=0.25),side = "r",width=0.8,color=NA)+
  geom_boxplot(width=0.4,size=1.2,outlier.color =NA)+
  geom_jitter(aes(fill=species),shape=21,size=2.5,width=0.2)+
  scale_fill_manual(values = c("#5cc3e8","#ffdb00","#79ceb8"))+
  theme_bw()+
  theme(panel.grid = element_blank(),
        axis.text = element_text(color = 'black',size=12),
        axis.title = element_text(color = 'black',size=15),
        legend.position = "none")
p5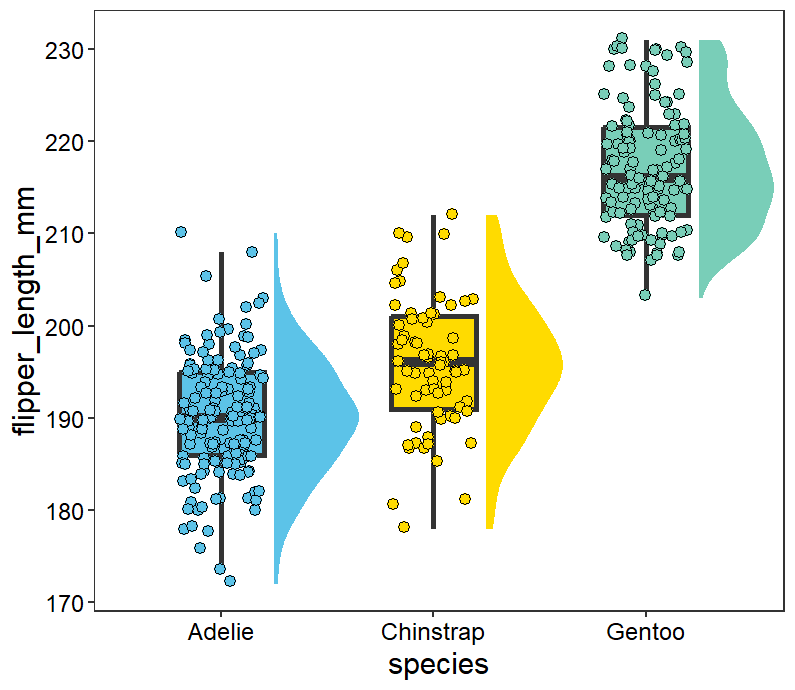
6. 云雨图
p6 <- ggplot(df,aes(species,flipper_length_mm,fill=species))+
  stat_slab(aes(thickness = after_stat(pdf * n)),scale = 0.7)+#绘制半小提琴图
  stat_dotsinterval(side = "bottom",
                    scale = 0.7,
                    slab_size = NA)+#通过添加“stat_dotsinterval”功能,可以制作雨云图
  coord_flip()+
  scale_fill_manual(values = c("#5cc3e8","#ffdb00","#79ceb8"))+
  theme_bw()+
  theme(panel.grid = element_blank(),
        axis.text = element_text(color = 'black',size=12),
        axis.title = element_text(color = 'black',size=15),
        legend.position = "none")
p6 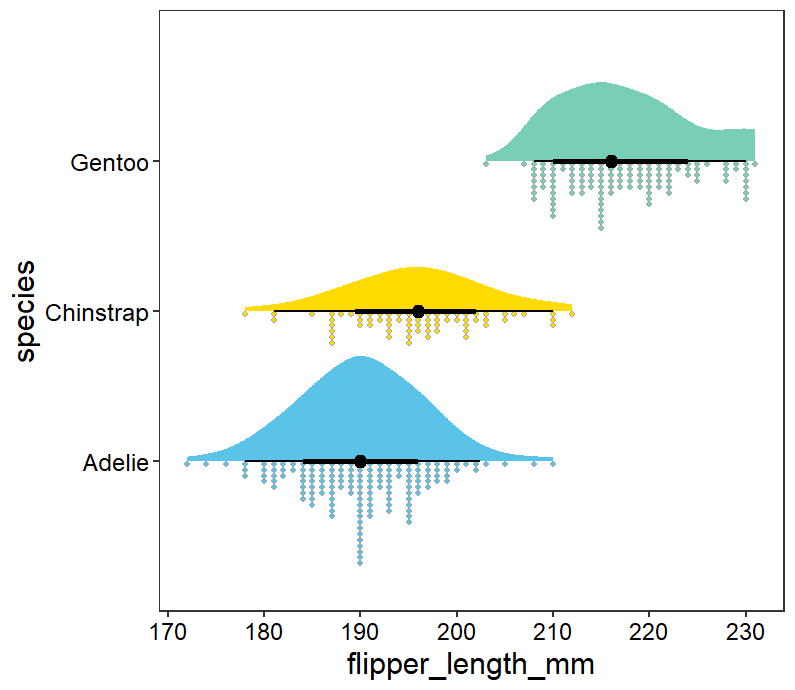


 被折叠的 条评论
为什么被折叠?
被折叠的 条评论
为什么被折叠?
 到【灌水乐园】发言


