


1. 总览
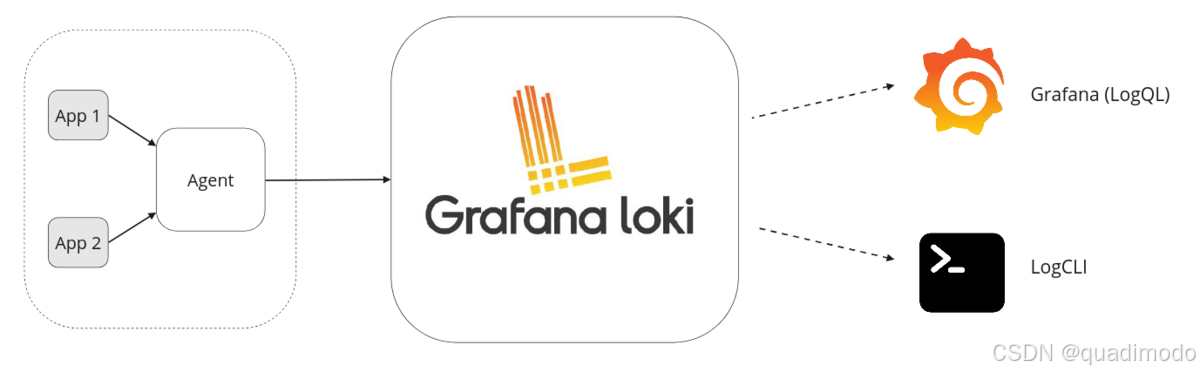
APP: nginx 服务或其他日志生成方
Agent: 例如 Grafana Alloy 或 Promtail。代理抓取日志,通过添加标签将日志转换为流,并通过 HTTP API 将流推送到 Loki
Loki: 主服务器,负责摄取和存储日志以及处理查询
Grafana: Grafana用于查询和显示日志数据。您还可以从命令行查询日志,使用LogCLI或直接使用Loki API
1.1 组件及版本
| 名称 | 镜像 | 功能 | 备注 |
|---|---|---|---|
| nginx | bitnami/nginx | nginx 服务 | bitnami/nginx服务已经集成了geoip功能组件,链接如下https://github.com/bitnami/charts/issues/4857 |
| promtail | grafana/promtail | 日志收集服务 | |
| loki | grafana/loki:3.3.2 | 日志存储及查询服务 | |
| grafana | grafana/grafana:11.4.0 | 查询和显示日志数据 |
2. 组件安装步骤
2.1 nginx
2.1.1 准备 geoip数据库
在日常工作中有时候我们需要获取用户所在的地区以便做一些特殊处理,比如根据地区展示不同的内容,或者限制某些地区的访问等,以及统计不同地区访问的情况。该模块不是必须,若没有此需求可以跳过
bitnami/nginx镜像已经安装 ngx_http_geoip2_module 模块。我们需要下载 GeoIP2 数据库,注册好账号后即可免费下载,注意要选择 mmdb 格式的数据库,如需获取客户端的城市信息要选择 City 数据库下载:
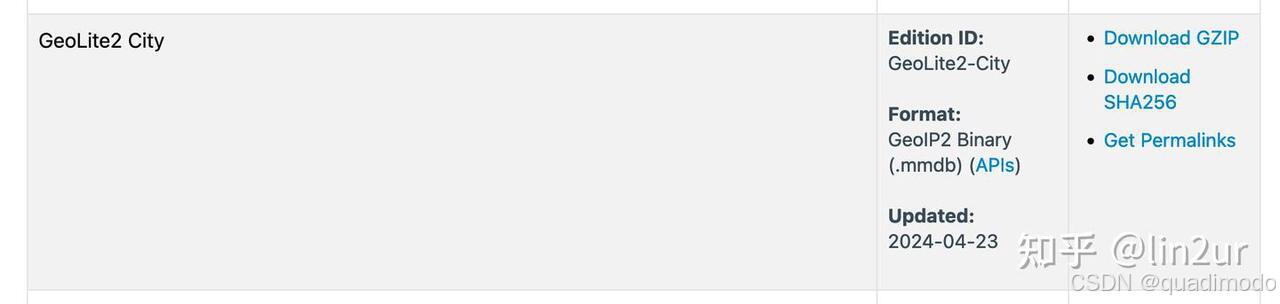
嫌麻烦的同学可以从 镜像站 下载
下载好数据库后解压得到 GeoLite2-City.mmdb 文件准备工作就结束了
2.1.2 配置 nginx
配置 nginx,各组件配置顺序有要求,若排序有错误,nginx 启动会报错
如下文件是从 bitnami/nginx 默认配置文件复制出来,标黄色背景为添加的内容
# Based on https://www.nginx.com/resources/wiki/start/topics/examples/full/#nginx-conf
# user              www www;  ## Default: nobody

worker_processes  auto;
error_log         "/opt/bitnami/nginx/logs/error.log";
pid               "/opt/bitnami/nginx/tmp/nginx.pid";

load_module modules/ngx_http_geoip2_module.so;

events {
    worker_connections  1024;
}

http {
    include       mime.types;
    default_type  application/octet-stream;
    # 增加变量哈希表最大大小
    variables_hash_max_size 2048;
    # 增加变量哈希表桶大小
    variables_hash_bucket_size 128;
    log_format    main '$remote_addr - $remote_user [$time_local] '
                       '"$request" $status $body_bytes_sent "$http_referer" '
                       '"$http_user_agent" "$http_x_forwarded_for"';
    geoip2 /usr/share/GeoIP/GeoLite2-City.mmdb {
      $geoip_cty_name default=unknown source=$remote_addr country iso_code;
      $geoip_province_name default=unknown source=$remote_addr subdivisions 0 iso_code;
      $geoip_city_name default=unknown source=$remote_addr city names en;
    }
    access_log    "/opt/bitnami/nginx/logs/access.log" main;
    log_format json_analytics escape=json '{'
                            '"msec": "$msec", ' # request unixtime in seconds with a milliseconds resolution
                            '"connection": "$connection", ' # connection serial number
                            '"connection_requests": "$connection_requests", ' # number of requests made in connection
                    '"pid": "$pid", ' # process pid
                    '"request_id": "$request_id", ' # the unique request id
                    '"request_length": "$request_length", ' # request length (including headers and body)
                    '"remote_addr": "$remote_addr", ' # client IP
                    '"remote_user": "$remote_user", ' # client HTTP username
                    '"remote_port": "$remote_port", ' # client port
                    '"time_local": "$time_local", '
                    '"time_iso8601": "$time_iso8601", ' # local time in the ISO 8601 standard format
                    '"request": "$request", ' # full path no arguments if the request
                    '"request_uri": "$request_uri", ' # full path and arguments if the request
                    '"args": "$args", ' # args
                    '"status": "$status", ' # response status code
                    '"body_bytes_sent": "$body_bytes_sent", ' # the number of body bytes exclude headers sent to a client
                    '"bytes_sent": "$bytes_sent", ' # the number of bytes sent to a client
                    '"http_referer": "$http_referer", ' # HTTP referer
                    '"http_user_agent": "$http_user_agent", ' # user agent
                    '"http_x_forwarded_for": "$http_x_forwarded_for", ' # http_x_forwarded_for
                    '"http_host": "$http_host", ' # the request Host: header
                    '"server_name": "$server_name", ' # the name of the vhost serving the request
                    '"request_time": "$request_time", ' # request processing time in seconds with msec resolution
                    '"upstream": "$upstream_addr", ' # upstream backend server for proxied requests
                    '"upstream_connect_time": "$upstream_connect_time", ' # upstream handshake time incl. TLS
                    '"upstream_header_time": "$upstream_header_time", ' # time spent receiving upstream headers
                    '"upstream_response_time": "$upstream_response_time", ' # time spend receiving upstream body
                    '"upstream_response_length": "$upstream_response_length", ' # upstream response length
                    '"upstream_cache_status": "$upstream_cache_status", ' # cache HIT/MISS where applicable
                    '"ssl_protocol": "$ssl_protocol", ' # TLS protocol
                    '"ssl_cipher": "$ssl_cipher", ' # TLS cipher
                    '"scheme": "$scheme", ' # http or https
                    '"request_method": "$request_method", ' # request method
                    '"server_protocol": "$server_protocol", ' # request protocol, like HTTP/1.1 or HTTP/2.0
                    '"pipe": "$pipe", ' # "p" if request was pipelined, "." otherwise
                    '"gzip_ratio": "$gzip_ratio", '
                    '"http_cf_ray": "$http_cf_ray",'
                    '"geoip_country_name": "$geoip_cty_name",'
                    '"geoip_province_name": "$geoip_province_name",'
                    '"geoip_city_name": "$geoip_city_name"'
                    '}';
    add_header    X-Frame-Options SAMEORIGIN;

    client_body_temp_path  "/opt/bitnami/nginx/tmp/client_body" 1 2;
    proxy_temp_path        "/opt/bitnami/nginx/tmp/proxy" 1 2;
    fastcgi_temp_path      "/opt/bitnami/nginx/tmp/fastcgi" 1 2;
    scgi_temp_path         "/opt/bitnami/nginx/tmp/scgi" 1 2;
    uwsgi_temp_path        "/opt/bitnami/nginx/tmp/uwsgi" 1 2;

    sendfile           on;
    tcp_nopush         on;
    tcp_nodelay        off;
    gzip               on;
    gzip_http_version  1.0;
    gzip_comp_level    2;
    gzip_proxied       any;
    gzip_types         text/plain text/css application/javascript text/xml application/xml+rss;
    keepalive_timeout  65;
    ssl_protocols      TLSv1.2 TLSv1.3;
    ssl_ciphers ECDHE-ECDSA-AES128-GCM-SHA256:ECDHE-RSA-AES128-GCM-SHA256:ECDHE-ECDSA-AES256-GCM-SHA384:ECDHE-RSA-AES256-GCM-SHA384:ECDHE-ECDSA-CHACHA20-POLY1305:ECDHE-RSA-CHACHA20-POLY1305:DHE-RSA-AES128-GCM-SHA256:DHE-RSA-AES256-GCM-SHA384:DHE-RSA-CHACHA20-POLY1305;
    client_max_body_size 80M;
    server_tokens off;

    absolute_redirect  off;
    port_in_redirect   off;

    include  "/opt/bitnami/nginx/conf/server_blocks/*.conf";

    # HTTP Server
    server {
        # Port to listen on, can also be set in IP:PORT format
        listen  8080;

        include  "/opt/bitnami/nginx/conf/bitnami/*.conf";

        location /status {
            stub_status on;
            access_log   off;
            allow all;
            deny all;
        }
    }
}
- load_module:
加载geoip2模块,需要放在 events 块前,放在下方会报错
- variables_hash_max_size:
设置变量哈希表的最大size(容量),默认值是 512。variables_hash_max_size的设置会影响Nginx的性能。如果设置得太小,可能会导致哈希冲突增加,降低查找效率;如果设置得太大,则会消耗更多的内存资源。因此,需要根据实际需求合理设置该参数
- variables_hash_bucket_size:
设置变量哈希桶大小,默认 64 ,啥是哈希表?为了快速处理静态的数据集合,诸如虚拟主机名、 map指令的值、 MIME类型和请求头的字段名,nginx使用了哈希表
- geoip2块:
http {
  geoip2 <db_path> {
    <$variable_name> default=<default_value> source=<$variable> <path>;
    // ...
  }
}
解释一下 geoip2 指令的参数:
-
db_path是 GeoIP2 数据库的路径,可以是绝对路径也可以是相对路径,如果是相对路径则相对于 Nginx 的安装目录; -
variable_name是自定义变量名,用于存储获取到的地理位置信息,比如geoip2_city_namegeoip2_country_name等; -
default_value当获取不到地理位置信息时的默认值; -
source是 IP 地址的来源,默认使用内置的$remote_addr变量,如果 Nginx 前面还有负载均衡或者网关,可以根据实际情况使用$http_x_forwarded_for$http_x_real_ip等变量; -
path是 GeoIP2 数据库中的 字段 路径,可以使用 mmdblookup 工具查看
- log_format
为了便于分析,这是一个 json 格式的日志,如下是日志实例
{
    "msec": "1736821808.307",
    "connection": "11556",
    "connection_requests": "1",
    "pid": "49",
    "request_id": "d935acd759ca3c445f9723a5d94c4bbe",
    "request_length": "857",
    "remote_addr": "1.1.1.1",
    "remote_user": "",
    "remote_port": "8229",
    "time_local": "14/Jan/2025:10:30:08 +0800",
    "time_iso8601": "2025-01-14T10:30:08+08:00",
    "request": "GET /admin-api/get-unread-count HTTP/1.1",
    "request_uri": "/admin-api/get-unread-count",
    "args": "",
    "status": "200",
    "body_bytes_sent": "39",
    "bytes_sent": "488",
    "http_referer": "https://admin.xxx.com/hair/MFtask",
    "http_user_agent": "Mozilla/5.0 (Windows NT 10.0; Win64; x64) AppleWebKit/537.36 (KHTML, like Gecko) Chrome/131.0.0.0 Safari/537.36",
    "http_x_forwarded_for": "",
    "http_host": "admin.xxx.com",
    "server_name": "admin.xxx.com",
    "request_time": "0.009",
    "upstream": "2.2.2.2:48080",
    "upstream_connect_time": "0.000",
    "upstream_header_time": "0.008",
    "upstream_response_time": "0.009",
    "upstream_response_length": "39",
    "upstream_cache_status": "",
    "ssl_protocol": "TLSv1.3",
    "ssl_cipher": "TLS_AES_128_GCM_SHA256",
    "scheme": "https",
    "request_method": "GET",
    "server_protocol": "HTTP/1.1",
    "pipe": ".",
    "gzip_ratio": "",
    "http_cf_ray": "",
    "geoip_country_name": "CN",
    "geoip_province_name": "GD",
    "geoip_city_name": "Shenzhen"
}
2.1.3 业务conf配置
将刚才配置的json_analytics日志在业务模块中添加
server {
            listen       4430;
             server_name admin.xxx.com;
      access_log "/opt/bitnami/nginx/logs/access.log" json_analytics;
      //...
}
2.1.4 docker-compose配置
admin-ssl.conf: 业务 conf 配置文件
nginx.conf: nginx 配置文件
GeoLite2-City.mmdb: geoip数据库
logs: 需要 promtail 读取的日志文件夹
services:
  web-proxy:
    image: bitnami/nginx
    container_name: web-proxy
    environment:
      TZ: Asia/Shanghai
    restart: always
    ports:
      - "8443:4430"
    volumes:
      - "/opt/app/admin-ssl.conf:/opt/bitnami/nginx/conf/server_blocks/admin-ssl.conf"
      - "/opt/app/nginx.conf:/opt/bitnami/nginx/conf/nginx.conf"
      - "/opt/app/geoip2-city/GeoLite2-City.mmdb:/usr/share/GeoIP/GeoLite2-City.mmdb"
      - "/opt/app/logs:/opt/bitnami/nginx/logs"
2.2 promtail
2.2.1 promtail配置
以下配置是基础配置,需要了解详细配置情况,访问官网配置文档
server:
  http_listen_port: 9080
  grpc_listen_port: 0

positions:
  filename: /tmp/positions.yaml

clients:
  - url: http://192.168.1.2:3100/loki/api/v1/push

scrape_configs:
  # myapp Config
  - job_name: nginx_myapp
    static_configs:
      - targets:
          - localhost
        labels:
          job: nginx_wz
          __path__: /var/log/web/*log
    pipeline_stages:
      - json:
          expressions:
            timestamp: time_iso8601
      - timestamp:
          source: timestamp
          format: RFC3339
          action_on_failure: 'skip'
2.2.2 docker-compose配置
需要将 nginx挂载的 logs 文件夹挂载到 promtail 下,路径要与__path__ 配置项保持一致
  services:
    promtail:
      image: grafana/promtail
      container_name: promtail
      volumes:
        - "/opt/app/logs:/var/log/web"
        - "/opt/app/promtail-config.yaml:/etc/promtail/config.yml"
      command: -config.file=/etc/promtail/config.yml
      restart: unless-stopped
2.3 loki
2.3.1 loki 配置文件
loki支持多种存储,filesystem 或者对象存储,主流对象存储均支持,我使用的是阿里云 oss 对象存储
具体其他配置可以查看 loki 配置文件Configuration | Grafana Loki documentation
auth_enabled: 如果需要忽略验证,这里需要指定为 false,否则 promtail 请求 loki 日志会报 401 错误
common.ring.kvstore: 若此项不进行配置,会报错 http://127.0.0.1:8500 connection refused ,因为默认的kv 存储引擎是 consul,我指定了inmemory 忽略 consul 配置,若需要了解使用 consul 作为kv 存储,自行查看配置项
storage_config.alibabacloud: 这里是官方支持的阿里云 oss 存储配置,aws s3 等其他存储,详细参考配置链接文件
# This partial configuration uses Alibaba for chunk storage.
auth_enabled: false

common:
  path_prefix: /tmp/loki
  replication_factor: 1
  ring:
    kvstore:
      store: inmemory

schema_config:
  configs:
  - from: 2020-05-15
    store: tsdb
    object_store: alibabacloud
    schema: v13
    index:
      prefix: index_
      period: 24h

storage_config:
  tsdb_shipper:
    active_index_directory: /loki/index
    cache_location: /loki/index_cache
  alibabacloud:
    bucket: <bucket>
    endpoint: <endpoint>
    access_key_id: <access_key_id>
    secret_access_key: <secret_access_key>
2.3.2 docker-compose配置
services:
  loki:
    image: grafana/loki: 3.3.2
    container_name: grafana-loki
    user: "0" # To force the container to use root user and avoid permission problems
    command: -config.file=/etc/loki/local-config.yaml
    volumes:
      - ./loki-config.yaml:/etc/loki/local-config.yaml
      - ./loki_data:/loki
    restart: unless-stopped
    environment:
      TZ: Asia/Shanghai
    ports:
      - "3100:3100"
2.4 grafana
2.4.1 docker-compose 配置
grafana 没有额外配置项
services:
    grafana:
        container_name: grafana
        image: grafana/grafana:11.4.0
        networks:
            - 1panel-network
        ports:
            - "3000:3000"
        restart: always
        user: "0"
        volumes:
            - ./data:/var/lib/grafana
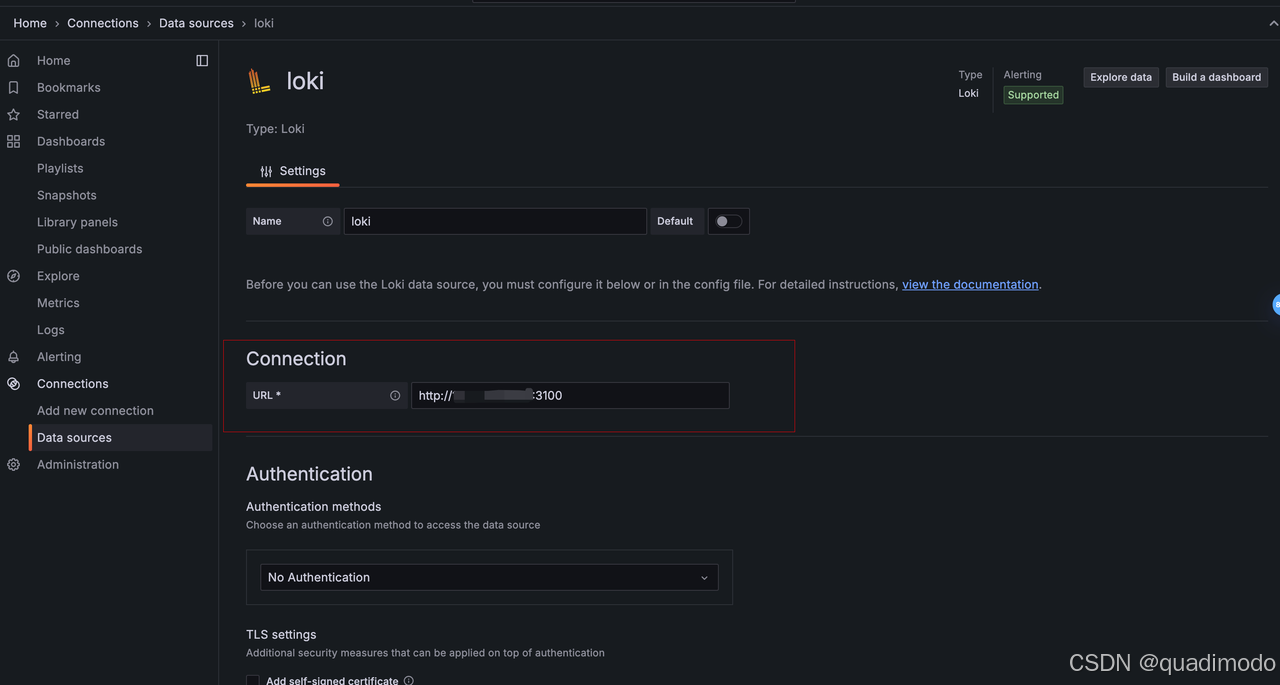
2.4.2 添加 datasource
新增 datasouce,选择类型为 loki,connection.url 选择刚才部署的 loki 服务链接
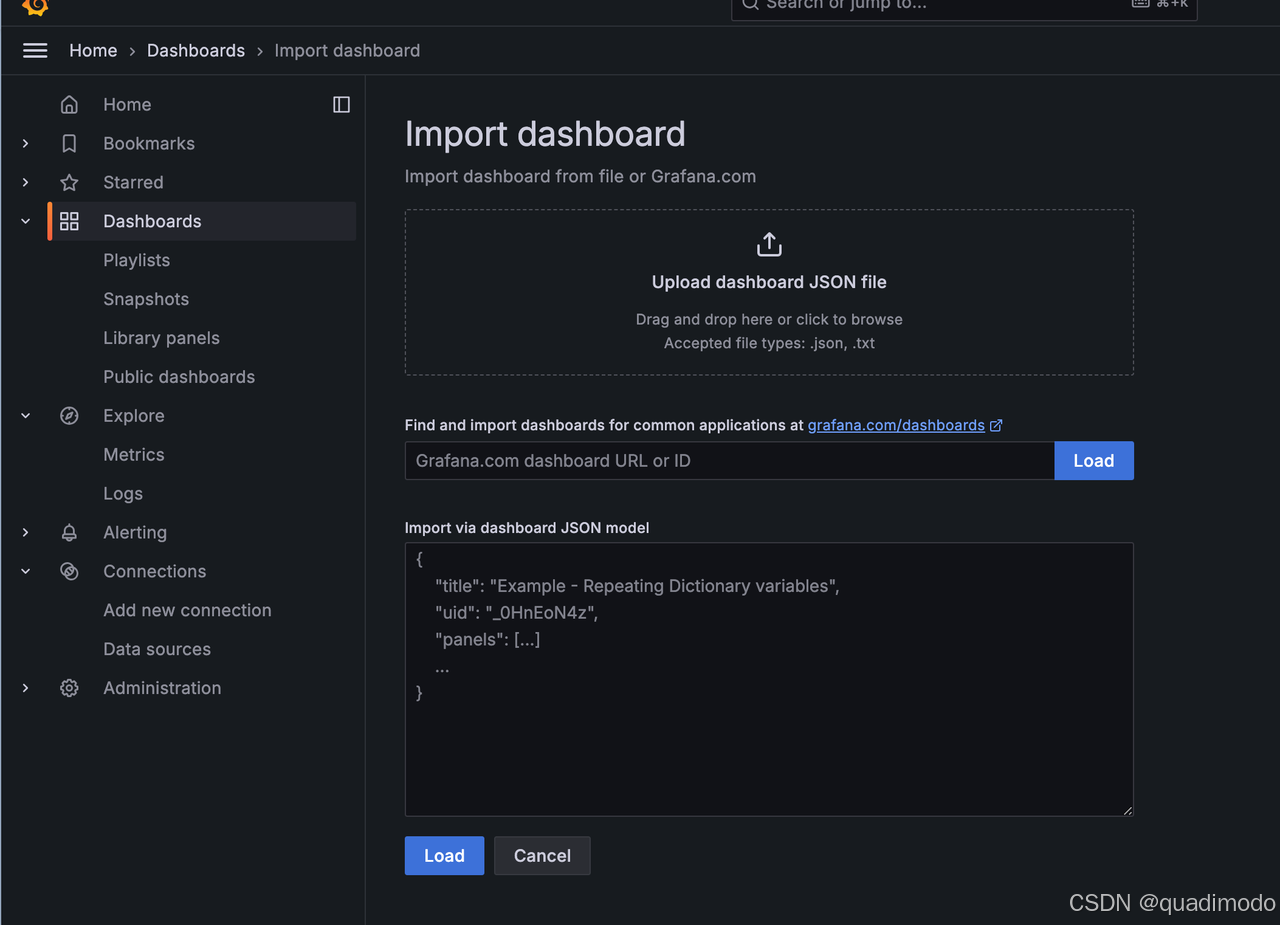
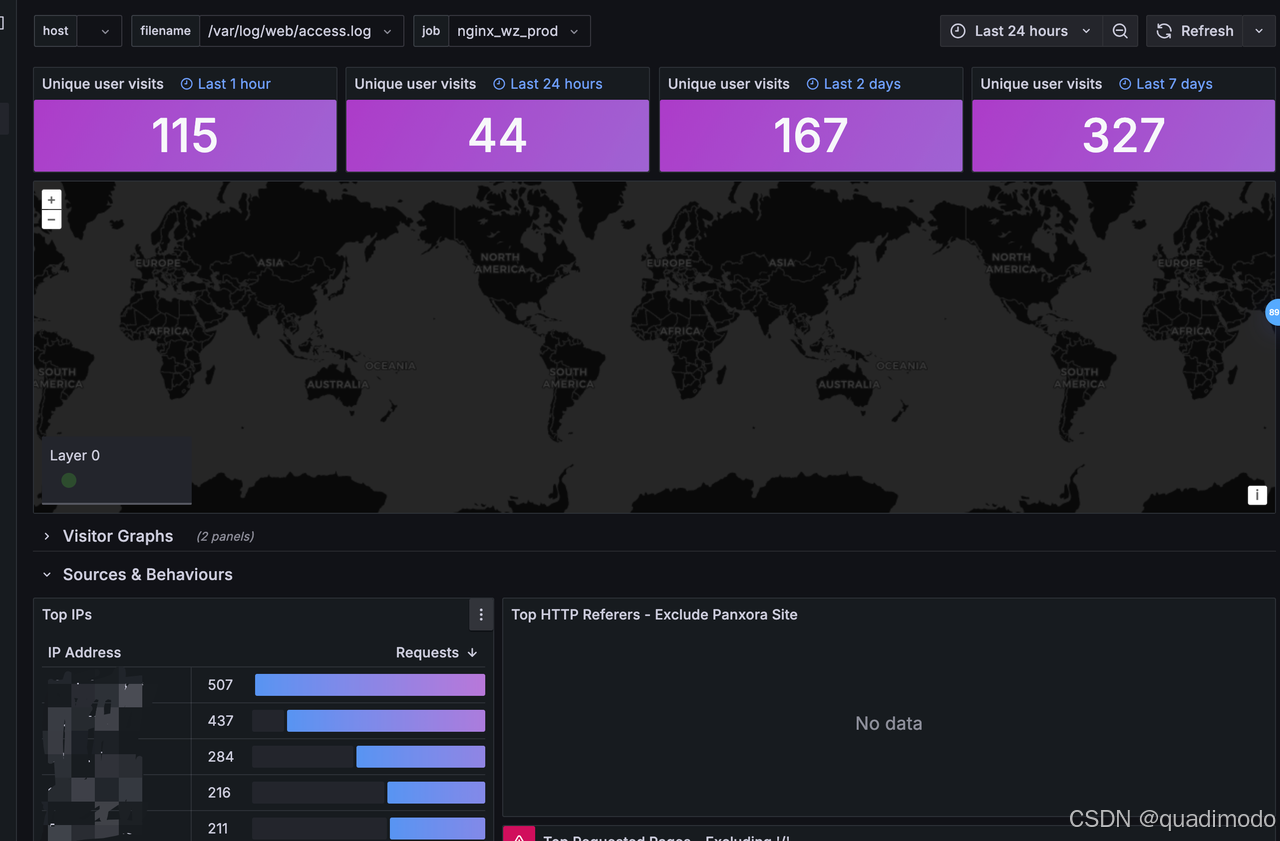
2.4.3 添加 dashboard
-
使用 grafana labs 搜索相关
-
复制模板 id = 13865
-
导入模板
将模板 id 填入后点击 load,然后选择 loki 数据源
2.4.4 配置 dashboad
地图模块(geomap)对中国适配度不太高,github 上有百度地图 echarts 插件,后续会将此插件进行集成
3. 扩展
3.1 grafana百度地图插件
3.2 nginx 日志压缩组件
4. 参考资料
使用 Nginx + GeoIP2 获取客户端地理位置及限制指定地区访问
如何在 Ubuntu 22.04 透過 Grafana Loki 來分析 NGINX 的日誌
How to Monitor Nginx Logs with Grafana, Loki & Promtail on Docker
Grafana Loki | Grafana Loki documentation
Analytics - NGINX / LOKI v2+ Data Source / Promtail v2+ Tool | Grafana Labs


 1万+
1万+

 被折叠的 条评论
为什么被折叠?
被折叠的 条评论
为什么被折叠?
 到【灌水乐园】发言


