


每周日必出故障系列,似乎是看不惯我周末休息,老美的圣诞节也没镇住老美的数据库。
数据库在圣诞节最后一刻2节点宕机了!!!!当然按照重启法则似乎能解决一切,但是这里并不适用,重启之后故障重现,给了我足够的取证和分析时间。
Oracle database version 19.5 no CDB
下面看一组alert
2021-12-25T23:28:05.264842+08:00
ARC0 (PID:12469): Archived Log entry 452730 added for T-2.S-25671 ID 0xce9c4479 LAD:1
2021-12-25T23:28:08.840050+08:00 <<<<<<<<<<<< start LMD deadlock 23:28:08
Global Enqueue Services Deadlock detected (DID = 12_1_1572). More information in file
/u01/app/oracle/diag/rdbms/xxxx/xxxx2/trace/xxxx2_lmd0_8982.trc.
2021-12-25T23:28:19.648620+08:00
Global Enqueue Services Deadlock detected (DID = 12_1_1573). More information in file
/u01/app/oracle/diag/rdbms/xxxx/xxxx2/trace/xxxx2_lmd0_8982.trc.
2021-12-25T23:28:50.740136+08:00
Global Enqueue Services Deadlock detected (DID = 12_1_1574). More information in file
/u01/app/oracle/diag/rdbms/xxxx/xxxx2/trace/xxxx2_lmd0_8982.trc.
2021-12-25T23:29:01.455790+08:00
Thread 2 advanced to log sequence 25673 (LGWR switch)
Current log# 8 seq# 25673 mem# 0: +DATAC1/xxxx/ONLINELOG/group_8.884.1090597299
2021-12-25T23:29:02.815247+08:00
ARC1 (PID:12477): Archived Log entry 452732 added for T-2.S-25672 ID 0xce9c4479 LAD:1
2021-12-25T23:29:04.722593+08:00
Global Enqueue Services Deadlock detected (DID = 12_1_1575). More information in file
/u01/app/oracle/diag/rdbms/xxxx/xxxx2/trace/xxxx2_lmd0_8982.trc.

…省略…

2021-12-25T23:46:50.130826+08:00
Global Enqueue Services Deadlock detected (DID = 12_1_1628). More information in file
/u01/app/oracle/diag/rdbms/xxxx/xxxx2/trace/xxxx2_lmd0_8982.trc.
2021-12-25T23:46:52.969550+08:00
Errors in file /u01/app/oracle/diag/rdbms/xxxx/xxxx2/trace/xxxx2_lms1_8986_8992.trc (incident=2633432): <<<<< shared pool 4031 heap(4,0),无法获取持久内存
ORA-04031: unable to allocate 168 bytes of shared memory (“shared pool”,“unknown object”,“sga heap(4,0)”,“gcs dynamic shadows lms”)
Incident details in: /u01/app/oracle/diag/rdbms/xxxx/xxxx2/incident/incdir_2633432/xxxx2_lms1_8986_8992_i2633432.trc
Use ADRCI or Support Workbench to package the incident.
See Note 411.1 at My Oracle Support for error and packaging details.
2021-12-25T23:46:53.052028+08:00
ORA-04031 heap dump being written to trace file /u01/app/oracle/diag/rdbms/xxxx/xxxx2/incident/incdir_2633432/xxxx2_lms1_8986_8992_i2633432.trc
2021-12-25T23:46:54.659917+08:00
Global Enqueue Services Deadlock detected (DID = 12_1_1629). More information in file
/u01/app/oracle/diag/rdbms/xxxx/xxxx2/trace/xxxx2_lmd0_8982.trc.
2021-12-25T23:47:04.677474+08:00
Global Enqueue Services Deadlock detected (DID = 12_1_1630). More information in file
/u01/app/oracle/diag/rdbms/xxxx/xxxx2/trace/xxxx2_lmd0_8982.trc.
2021-12-25T23:47:08.264118+08:00
Errors in file /u01/app/oracle/diag/rdbms/xxxx/xxxx2/trace/xxxx2_j006_276744.trc (incident=2634840):
ORA-04031: unable to allocate 56 bytes of shared memory (“shared pool”,“unknown object”,“KKSSP^11005”,“kglseshtSegs”)
Incident details in: /u01/app/oracle/diag/rdbms/xxxx/xxxx2/incident/incdir_2634840/xxxx2_j006_276744_i2634840.trc
Use ADRCI or Support Workbench to package the incident.
See Note 411.1 at My Oracle Support for error and packaging details.
2021-12-25T23:47:08.980300+08:00
Errors in file /u01/app/oracle/diag/rdbms/xxxx/xxxx2/trace/xxxx2_j006_276744.trc:
ORA-04031: unable to allocate 56 bytes of shared memory (“shared pool”,“unknown object”,“KKSSP^11005”,“kglseshtSegs”)
2021-12-25T23:47:09.696941+08:00
Process J006 died, see its trace file
2021-12-25T23:47:09.697025+08:00
kkjcre1p: unable to spawn jobq slave process
2021-12-25T23:47:09.697096+08:00
Errors in file /u01/app/oracle/diag/rdbms/xxxx/xxxx2/trace/xxxx2_cjq0_12905.trc:
2021-12-25T23:47:11.501606+08:00
Errors in file /u01/app/oracle/diag/rdbms/xxxx/xxxx2/trace/xxxx2_mmon_9046.trc (incident=2633640):
ORA-04031: unable to allocate 40 bytes of shared memory (“shared pool”,“select size_for_estimate, …”,“KGLH0^51522e0b”,“kglHeapInitialize:temp”)
Incident details in: /u01/app/oracle/diag/rdbms/xxxx/xxxx2/incident/incdir_2633640/xxxx2_mmon_9046_i2633640.trc
Use ADRCI or Support Workbench to package the incident.
See Note 411.1 at My Oracle Support for error and packaging details.
2021-12-25T23:48:03.057455+08:00
Errors in file /u01/app/oracle/diag/rdbms/xxxx/xxxx2/trace/xxxx2_j009_279833.trc (incident=2635032):
ORA-04031: unable to allocate 56 bytes of shared memory (“shared pool”,“unknown object”,“KKSSP^9837”,“kglseshtSegs”)
Incident details in: /u01/app/oracle/diag/rdbms/xxxx/xxxx2/incident/incdir_2635032/xxxx2_j009_279833_i2635032.trc
Use ADRCI or Support Workbench to package the incident.
See Note 411.1 at My Oracle Support for error and packaging details.
2021-12-25T23:48:03.470720+08:00
LMS1 (ospid: 8986_8992) has not called a wait for 50 secs.
2021-12-25T23:48:04.135748+08:00
Errors in file /u01/app/oracle/diag/rdbms/xxxx/xxxx2/trace/xxxx2_j009_279833.trc:
ORA-04031: unable to allocate 56 bytes of shared memory (“shared pool”,“unknown object”,“KKSSP^9837”,“kglseshtSegs”)
2021-12-25T23:48:04.481052+08:00
Process J009 died, see its trace file
2021-12-25T23:48:04.481136+08:00
kkjcre1p: unable to spawn jobq slave process
2021-12-25T23:48:04.481196+08:00
Errors in file /u01/app/oracle/diag/rdbms/xxxx/xxxx2/trace/xxxx2_cjq0_12905.trc:
<<<<<< LMS hang
2021-12-25T23:48:06.155760+08:00
Errors in file /u01/app/oracle/diag/rdbms/xxxx/xxxx2/trace/xxxx2_lmhb_9009.trc (incident=2633480):
ORA-29770: global enqueue process LMS1 (OSID 8986_8992) is hung for more than 70 seconds
Incident details in: /u01/app/oracle/diag/rdbms/xxxx/xxxx2/incident/incdir_2633480/xxxx2_lmhb_9009_i2633480.trc
2021-12-25T23:48:08.689426+08:00
LOCK_DBGRP: GCR_SYSTEST debug event locked group GR+DB_xxxx by memno 1
2021-12-25T23:48:09.325166+08:00
Process termination requested for pid 8986_8992 [source = rdbms], [info = 0] [request issued by pid: 9009, uid: 1001]
2021-12-25T23:48:09.325191+08:00
Process termination requested for pid 8984_8991 [source = rdbms], [info = 0] [request issued by pid: 9009, uid: 1001]
2021-12-25T23:48:09.325281+08:00
Process termination requested for pid 9020 [source = rdbms], [info = 0] [request issued by pid: 9009, uid: 1001]
LMHB (ospid: 9009): terminating the instance due to ORA error 29770
2021-12-25T23:48:09.350502+08:00
Cause - ‘ERROR: Some process(s) is not making progress.
LMHB (ospid: 9009) is terminating the instance.
Please check LMHB trace file for more details.
Please also check the CPU load, I/O load and other system properties for anomalous behavior
ERROR: Some process(s)’
2021-12-25T23:48:09.393157+08:00
Dumping diagnostic data in directory=[cdmp_20211225234809], requested by (instance=2, osid=9009 (LMHB)), summary=[abnormal instance termination].
2021-12-25T23:48:09.662023+08:00
ORA-1092 : opitsk aborting process
2021-12-25T23:48:09.682359+08:00
ORA-1092 : opitsk aborting process
2021-12-25T23:48:10.708035+08:00
License high water mark = 211
2021-12-25T23:48:11.562372+08:00
Instance terminated by LMHB, pid = 9009
2021-12-25T23:48:11.663362+08:00
Warning: 2 processes are still attacheded to shmid 2135162902:
(size: 2097152 bytes, creator pid: 7506, last attach/detach pid: 280327)
2021-12-25T23:48:12.708585+08:00
USER(prelim) (ospid: 280324): terminating the instance
2021-12-25T23:48:12.710943+08:00
Instance terminated by USER(prelim), pid = 280324
2021-12-25T23:48:15.646596+08:00
Starting ORACLE instance (normal) (OS id: 280415)
2021-12-25T23:48:15.665292+08:00
2021-12-25T23:28:08.840050开始数据库出现Deadlock ,从LMDtrace可以看到是业务相关SQL,从LMDtrace可以分析得出是1节点该SQL阻塞了2节点,在这一瞬间,1节点持有latch,2节点想要获取,产生了Deadlock,继续分析。
  Global Wait-For-Graph(WFG) for GES Deadlock ID=[12_1_1630]
------------------------------------------------------------------------
                       Victim : (instance=2, lock=0x5a206ff10)
      Start (master) Instance : 2
     Number of Locks involved : 4
  Number of Sessions involved : 2

User session identified by:
{
	            User Name : fedc
	         User Machine : localhost.localdomaincn
	     OS Terminal Name : UNKNOWN
	        OS Process ID : 977078
	      OS Program Name : sqlldr@localhost.localdomain (TNS V1-V3)
	     Application Name : SQL Loader Conventional Path Load V1-V3)V3)
	          Action Name : 5/load.ctl1640446941377_182108eanup Slave
	          Current SQL : INSERT INTO xxxxxxx   (ID,UDN,TIME) VALUES (:1,:2,CAST(TO_DATE(:TIME, 'yyyy-mm-dd hh24:mi:ss') AS DATE))
	       Session Number : 2918
	Session Serial Number : 16119
	Server Process ORAPID : 252
	 Server Process OSPID : 251878
	             Instance : 2
}
waiting for Lock 0x5a206ff10 (Transaction):
{
	        Lock Level : KJUSERPR
	     Resource Name : TX 0x2b8000e.0x7cee(ext 0x0,0x0)
	GES Transaction ID : FC000-0002-00000B1C
}
which is blocked by Lock 0xaf1b8a50 (Transaction):
{
	        Lock Level : KJUSERPR
	     Resource Name : TX 0x2b8000e.0x7cee(ext 0x0,0x0)
	GES Transaction ID : 21B000-0001-0000001E
}
owned by the
User session identified by:
{
	            User Name : fedc
	         User Machine : localhost.localdomaincn
	     OS Terminal Name : UNKNOWN
	        OS Process ID : 32302
	      OS Program Name : sqlldr@localhost.localdomain (TNS V1-V3)
	     Application Name : SQL Loader Conventional Path Load V1-V3)
	          Action Name : 5/load.ctl1640446930728_722208
	          Current SQL : INSERT INTO xxxxxxx   (ID,UDN,TIME) VALUES (:1,:2,CAST(TO_DATE(:TIME, 'yyyy-mm-dd hh24:mi:ss') AS DATE))
	       Session Number : 11008
	Session Serial Number : 1635
	Server Process ORAPID : 539
	 Server Process OSPID : 88755
	             Instance : 1
}
waiting for Lock 0x2e5942bc8 (Transaction):
{
	        Lock Level : KJUSERPR
	     Resource Name : TX 0xe590011.0xfcec(ext 0x0,0x0)
	GES Transaction ID : 21B000-0001-0000001E
}
2021-12-25T23:46:52.969550数据库出现内存不足 报ORA-4031,无法获取heap(4,0)即第四个subpool的0号持久内存。从trace中可以看到lms进程在等待gc message
以下是LMS trace
*** 2021-12-25T23:46:50.433900+08:00
2021-12-25 23:46:50.433 : GSIPC:LOOP: cycle time(us) 544177 active 544155 rl/rq/wq/mq 0/0/0/0
2021-12-25 23:46:50.433 : GSIPC:LOOP: wait/busy(us) 22/0 sndf 0 pmsg 0 sync 0 frez 0 fbufs 0 rcvm 544177 othr 0
===[ LM History ]===
  KJM HIST LMS1 (most recent first):
    7:0u 6:0u 10:0u 17:0u 16:0u 18:0u 12:544177u 7:0u 6:0u 10:0u
    17:0u 16:0u 14:32:0u 1:0u 12:1:0u 7:0u 6:0u 10:0u 17:0u 16:0u
    12:0u 7:0u 6:0u 10:0u 17:0u 16:0u 13:65521:0u 20:32:0u 20:32:0u 20:32:0u
    1:0u 14:32:0u 1:0u 12:2:0u 7:0u 6:0u 10:0u 17:0u 16:0u 12:0u
    7:0u 6:0u 10:0u 17:0u 16:0u 14:32:0u 1:0u 12:1:0u 7:0u 6:0u
    10:0u 17:0u 16:0u 12:0u 7:0u 6:0u 10:0u 17:0u 16:0u 14:32:0u
    1:0u 12:1:0u 7:0u 6:0u
===[ Process Comm State Object ]===
     GES MSG BUFFERS: st=emp chunk=(nil) hdr=(nil) lnk=(nil) flags=0x1000 inc=12
      outq=0 sndq=0 rmsq=0 opid=25
      prmb=(nil) : (id 0 st 0x0 where 0 curq (nil))
      smp[i]=(1 0x60dd02980) smp[b]=(1 0x60dd02e10) pmp=0x503aba6e0
      mbg[i]=(1 2482) mbg[b]=(4 0) mbg[r]=(0 0)
      fmq[i]=(30 72) fmq[b]=(20 33) fmq[r]=(0 0)
      mop[s]=1068966156 mop[q]=769906694 pendq=0 zmbq=0 tmoq=0 nonksxp_recvs=0
      SO dump_time_stamp=0
      SO SendQ=0  start_tm=0  end_tm=0
      SO FreeQ reg=72  start_tm=3deb6c  end_tm=1edf46
         SO FreeQ reg : 32:1 43:2 44:66 114:3
      SO FreeQ bth=33  start_tm=3debe3  end_tm=3ce553
         SO FreeQ bth : rsv:(tot 33 ib 0 pb 33)
         SO FreeQ bth : embed: 32:20 34:1327 36:16
      SO FreeQ rsv=0  start_tm=0  end_tm=0
===[ Session Wait History ]===
  Current Wait Stack:
    Not in wait; last wait ended 0.000393 sec ago
  Wait State:
    fixed_waits=0 flags=0x21 boundary=(nil)/-1
  Session Wait History:
      elapsed time of 0.000410 sec since last wait
   0: waited for 'gcs remote message'
      waittime=0x1e, poll=0x0, event=0x0
      wait_id=307140422 seq_num=43764 snap_id=1
      wait times: snap=0.000022 sec, exc=0.000022 sec, total=0.000022 sec
      wait times: max=infinite
      wait counts: calls=1 os=1
      occurred after 0.000005 sec of elapsed time
   1: waited for 'gcs remote message'
      waittime=0x1e, poll=0x0, event=0x0
      wait_id=307140421 seq_num=43763 snap_id=1
      wait times: snap=0.000007 sec, exc=0.000007 sec, total=0.000007 sec
      wait times: max=infinite
      wait counts: calls=1 os=1
      occurred after 0.000001 sec of elapsed time
   .......省略.........
*** 2021-12-25T23:46:52.970095+08:00
2021-12-25T23:46:52.970082+08:00
Incident 2633432 created, dump file: /u01/app/oracle/diag/rdbms/xxxx/xxxx2/incident/incdir_2633432/xxxx2_lms1_8986_8992_i2633432.trc
ORA-04031: unable to allocate 168 bytes of shared memory ("shared pool","unknown object","sga heap(4,0)","gcs dynamic shadows lms")

TOC00000 - Table of contents
TOC00001 - Error Stack
TOC00002 - Dump for incident 2633432 (ORA 4031)
| TOC00003 - Beginning of Customized Incident Dump(s)
| | TOC00004 - Call Stack Trace
| | TOC00005 - Kernel Stack Trace
| | TOC00006 - Process Map Dump
| | TOC00007 - LIBRARY CACHE DUMP
End of TOC

*** 2021-12-25T23:48:06.100278+08:00
Received ORADEBUG command (#11) 'dump KSTDUMPCURPROC 1' from process '9009'
-------------------------------------------------------------------------------
Trace Bucket Dump Begin: default bucket for process 25 (osid: 8986_8992, LMS1)
TIME(*=approx):SEQ:COMPONENT:FILE@LINE:FUNCTION:SECT/DUMP:SID:SERIAL#: [EVENT#:PID] DATA
-------------------------------------------------------------------------------
2021-12-25 23:45:54.768 :A649BD31:db_trace:ksl2.c@3492:kslwtectx():14451:2949: [10005:25] KSL WAIT END [latch: gcs resource hash] 25702449152/0x5fbfc4000 253/0xfd 0/0x0 wait_id=306599374 seq_num=26996 snap_id=1   <<<<<<<<<<<<
2021-12-25 23:45:54.768 :A649BD32:db_trace:ksl2.c@3496:kslwtectx():14451:2949: [10005:25] KSL WAIT END wait times (usecs) - snap=316, exc=316, tot=316
.....省略......
2021-12-25 23:46:51.261 :A79A1459:db_trace:ksl2.c@3496:kslwtectx():14451:2949: [10005:25] KSL WAIT END wait times (usecs) - snap=103, exc=103, tot=103
-------------------------------------------------------------------------------
Trace Bucket Dump End: default bucket for process 25 (osid: 8986_8992, LMS1)

*** 2021-12-25T23:48:06.101690+08:00
Finished processing ORADEBUG command (#11) 'dump KSTDUMPCURPROC 1'
2021-12-25T23:48:06.155760 LMHD(LOCAL MANAGER HeartBeat)进程监控到LMS进程超时达到70s,且等待事件是sga相关的。之后数据库宕机。
以下是LMDB trace
*** 2021-12-25T23:48:03.470524+08:00
==============================
LMS1 (ospid: 8986_8992) has not moved for 71 sec (1640447283.1640447212)
  : heartbeat check status 6 (no-heartbeat) (threshold 70 sec)
==================================================
=== LMS1 (ospid: 8986_8992) Heartbeat Report
==================================================
LMS1 (ospid: 8986_8992) has no heartbeats for 71 sec. (threshold 70)   <<<<
  : heartbeat state 0x2.ffff () pso-flag 0x100
  : Not in wait; last wait ended 50 secs ago.
  : last wait_id 307162779 at 'latch: shared pool'.
==============================
Dumping PROCESS LMS1 (ospid: 8986_8992) States
==============================
===[ System Load State ]===
  CPU Total 25 Raw 25 Core 48 Socket 2
  Load normal: Cur 2856 Highmark 122880 (11.15 480.00)
===[ Latch State ]===
  Not in Latch Get
===[ Session State Object ]===
  ----------------------------------------
  SO: 0x623e95c00, type: session (4), map: 0x61e1d07d0
      state: LIVE (0x4532), flags: 0x5
      owner: 0x623fe0458, proc: 0x623fe0458
      link: 0x623e95c20[0x61bd43ab8, 0x54bed7c28]
      child list count: 1, link: 0x623e95c70[0x603fb84c0, 0x603fb84c0]
      pg: 1
  SOC: 0x61e1d07d0, type: session (4), map: 0x623e95c00
       state: LIVE (0x99fc), flags: INIT (0x1)
  (session) sid: 14451 ser: 2949 trans: (nil), creator: 0x62000f978
            flags: (0x80000011) USR/- flags2: (0x409) -/-/INC
            flags_idl: (0x1) status: BSY/-/-/- kill: -/-/-/-
            DID: 0000-0019-000000030000-0000-00000000, short-term DID:
            txn branch: (nil)
            edition#: 0            user#/name: 0/SYS
            oct: 0, prv: 0, sql: (nil), psql: (nil)
            stats: 0x5fede9c98, PX stats: 0x129fa544
  service name: SYS$BACKGROUND
  Current Wait Stack:
    Not in wait; last wait ended 51.130431 sec ago
  Wait State:
    fixed_waits=0 flags=0x20 boundary=(nil)/-1
  Session Wait History:
      elapsed time of 51.130459 sec since last wait
   0: waited for 'latch: shared pool'            <<<<
      address=0x608c20c8, number=0x26b, why=0x60187f18
      wait_id=307162779 seq_num=611 snap_id=1
      wait times: snap=0.001530 sec, exc=0.001530 sec, total=0.001530 sec
      wait times: max=infinite
      wait counts: calls=0 os=0
      occurred after 19.636973 sec of elapsed time
   1: waited for 'PGA memory operation'            <<<<
      =0x130000, =0x1, =0x0
      wait_id=307162778 seq_num=610 snap_id=1
      wait times: snap=0.000006 sec, exc=0.000006 sec, total=0.000006 sec
      wait times: max=infinite
      wait counts: calls=0 os=0
      occurred after 0.078517 sec of elapsed time
   2: waited for 'SGA: allocation forcing component growth'           <<<<
      =0x0, =0x0, =0x0
      wait_id=307162752 seq_num=609 snap_id=26
      wait times: snap=0.000000 sec, exc=0.259441 sec, total=0.263625 sec
      wait times: max=infinite
      wait counts: calls=25 os=25
      occurred after 0.000000 sec of elapsed time
  .......省略......
分析到这里思路略有清晰,开始怀疑是不是内存问题导致的,DeadLock 和sga到底谁是因谁是果,陷入沉思!!!既然要确定因果那么就看下dba_hist_active_sess_history吧.
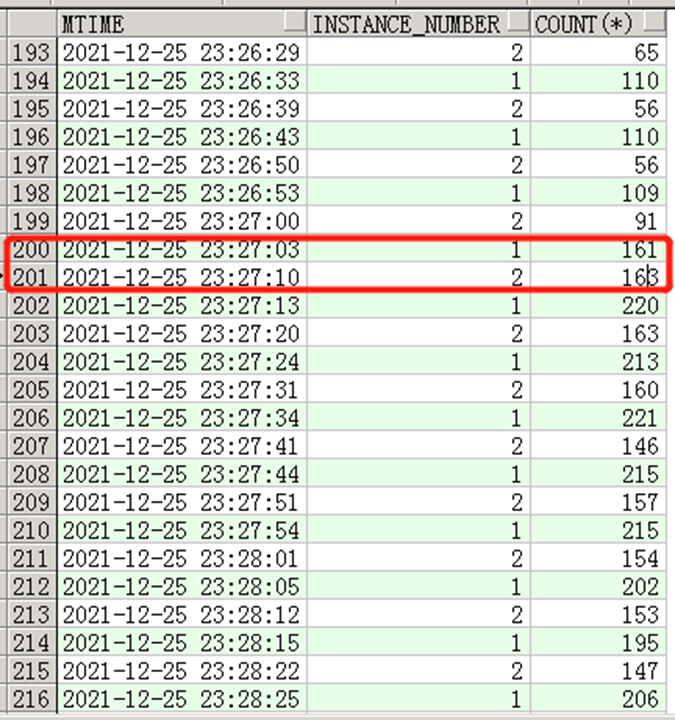
分析完日志似乎并不能得到准确答案,接下来进入数据库查一些问题,从下图看到在23:27分开始两个节点执行次数是开始增长的,对比alert日志(23:28:08开始抛出的死锁信息)
select  to_char(sample_time,'YYYY-MM-DD hh24:mi:ss')  mtime,instance_number,count(*)
 from  awr_1225 where
sample_time > to_date('2021-12-25 23:10:00','YYYY-MM-DD hh24:mi:ss')
and
sample_time< to_date('2021-12-25 23:50:00','YYYY-MM-DD hh24:mi:ss')
group by to_char(sample_time,'YYYY-MM-DD hh24:mi:ss')   ,instance_number
order by 1,2,3
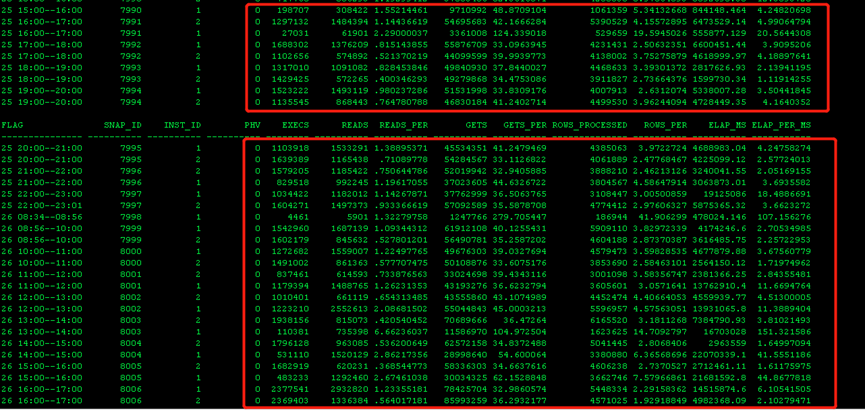
继续分析,发现执行次数突增的SQL并没有一些规律,似乎所有SQL都慢。
select * from (
select  to_char(sample_time,'YYYY-MM-DD hh24:mi:ss')  mtime,instance_number,sql_id,count(*)  coun
 from awr_1225 where
sample_time > to_date('2021-12-25 23:10','YYYY-MM-DD hh24:mi:ss')
and  sample_time< to_date('2021-12-25 23:50','YYYY-MM-DD hh24:mi:ss')
group by to_char(sample_time,'YYYY-MM-DD hh24:mi:ss')   ,instance_number,sql_id
order by 1,2,4 ) where coun >8
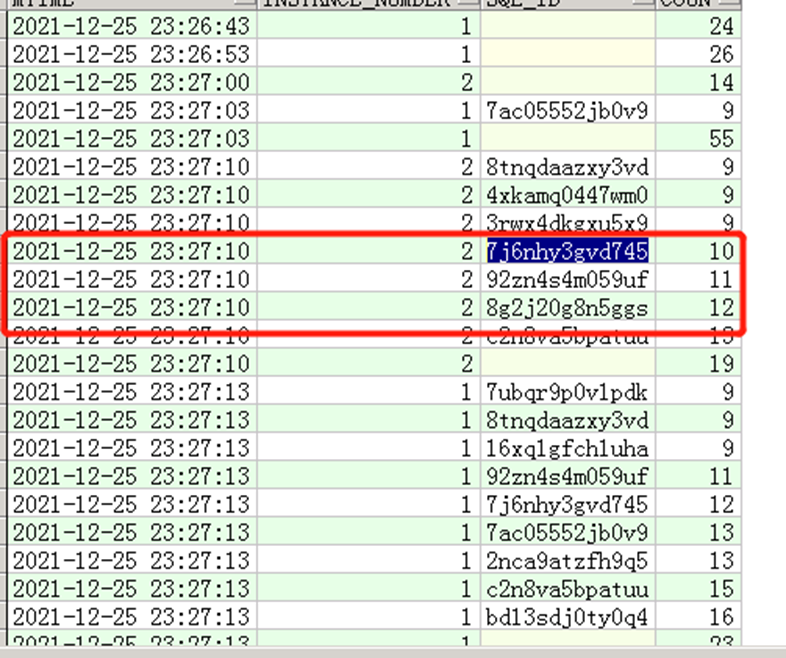
针对以上圈出的三个SQL我们查一下等待事件
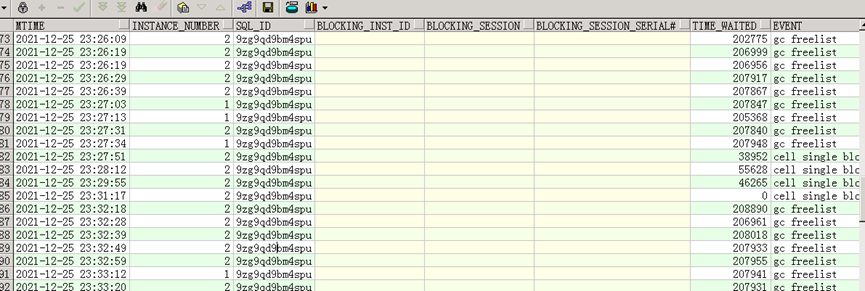

等待事件过多的是gc freelist,看到这里一点一点确认内存可能真的有些问题了,但分析问题还是要论证清楚。
DeadLock报出的SQL我们也要看下。
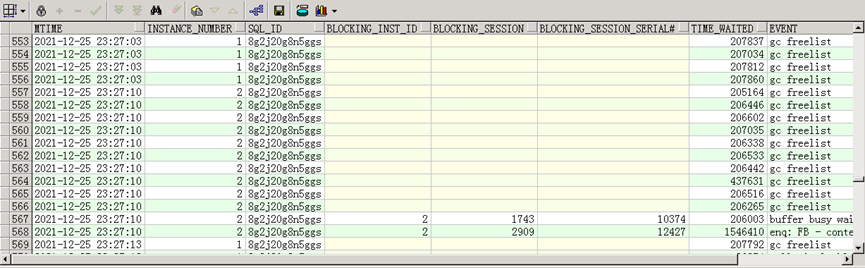
select  to_char(sample_time,'YYYY-MM-DD hh24:mi:ss')  mtime,instance_number,sql_id, blocking_inst_id,
blocking_session,blocking_session_serial#,time_waited,event
 from awr_1225 where   sql_id=' c2n8va5bpatuu ' and
sample_time > to_date('2021-12-25 23:10','YYYY-MM-DD hh24:mi:ss')
and  sample_time< to_date('2021-12-25 23:50','YYYY-MM-DD hh24:mi:ss')
order by 1
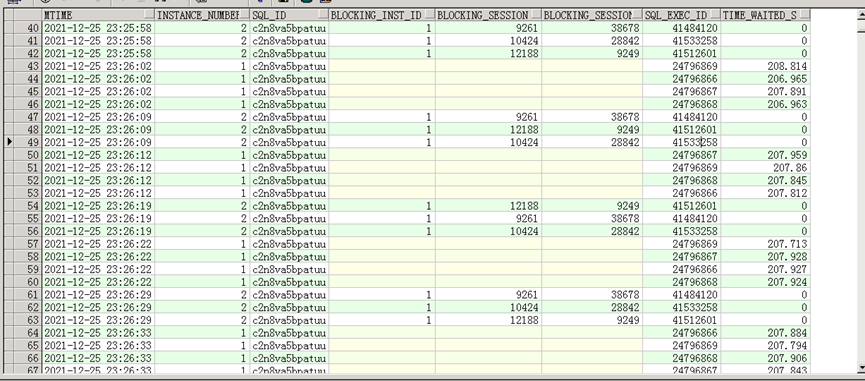
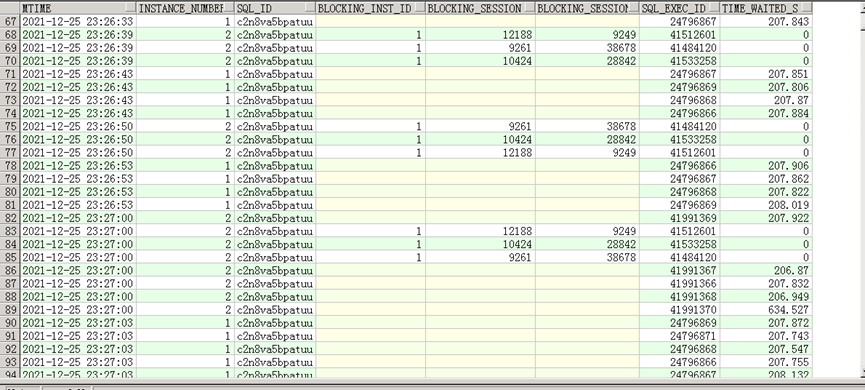
而阻塞c2n8va5bpatuu的三个session又十分有意思,从sql_exec_id确认这是一次执行,执行了至少4分钟没有执行完,这个SQL也又必须要看下。


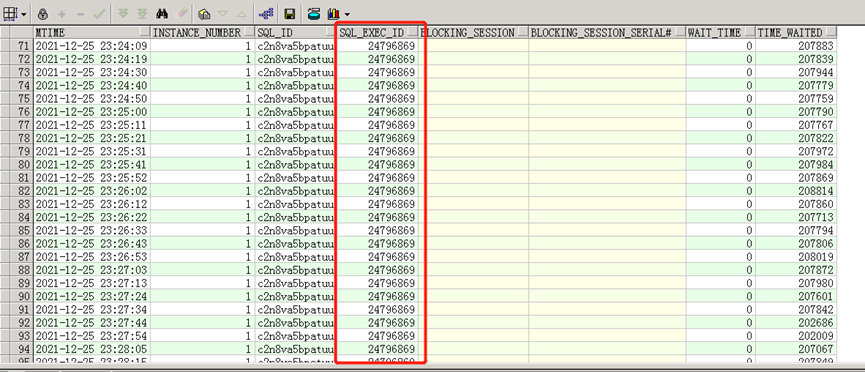
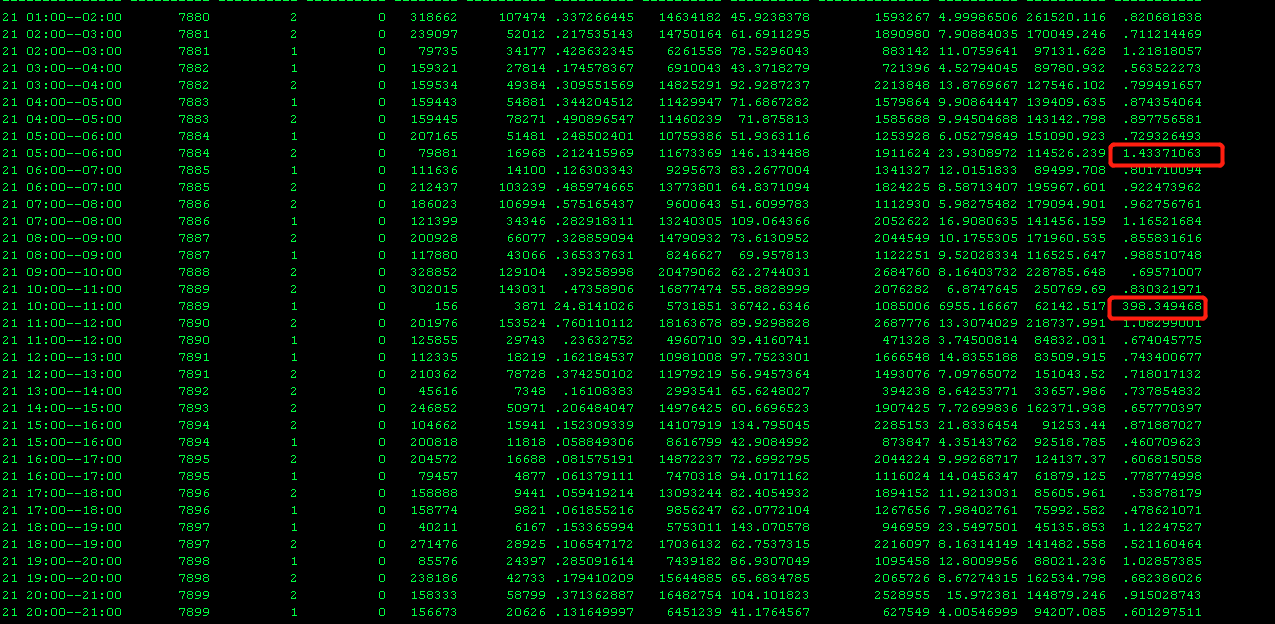
接下来看下这个SQL的历史执行情况,由于是sqlloader导入的,sql_plan_hash_value是0,一瞬间我看一个insert要需要数毫秒至数百毫秒(这是一小时内的平均值,上面那三个session执行数分钟),—这一定有问题。
可当我看到21号的执行情况时打消了我对这个SQL的怀疑,21号也有398毫秒的情况,这个跟一次导入的数据量有一定关系,但是这里看到的insert需要数毫秒至数百毫秒也不是根。
追根溯源,那么这个根在哪
2021-12-25T23:28:08.840050 数据库开始deadlock ,产生deadlock的SQL在这个时间段内增长并不典型,且执行效率慢并不能确定是根。
2021-12-25T23:46:52.969550 数据库开始出现内存不足,直接导致数据库宕机,产生的等待是sga相关内存等待。
在故障之前active session在300左右,主要的SQL等待事件23:26分开始是gc freelist,甚至在23:18分也有gc freelist等待。
问题开始浮出水面
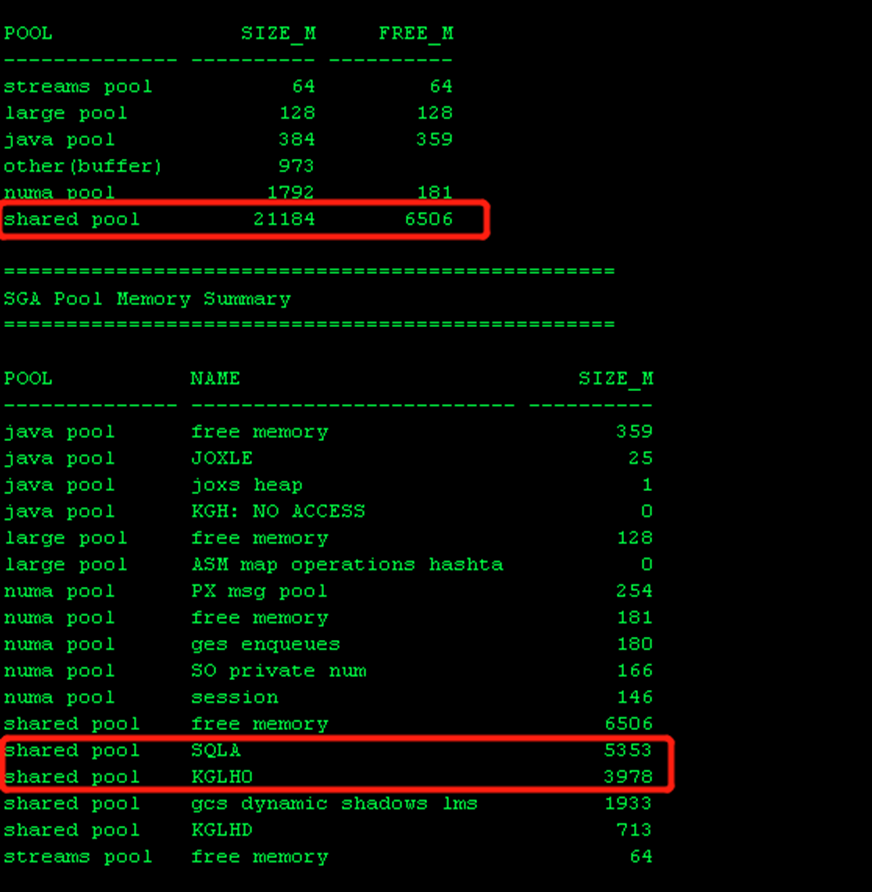
24G的sga,shared pool居然占到了21G,buffer cache可用不足1G,难怪一直报free list。继续看占用sharedpool比较大的是 SQLA和KGLHO,SQLA存放的是SQL文本,KGLHO(Kernel Generic Library Handle)是用来管理library cache内存分配的。这两个占了9G,需要看下数据库硬解析了。
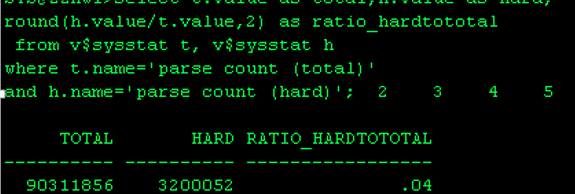
看到这里问题已经明确了,硬解析比率占到了4%,这已经很高了
select substr(a.SQL_TEXT,1,80),count(*) cont
from v$sqlarea a
group by substr(a.SQL_TEXT,1,80)
having count(*) > 10
order by  cont desc ;
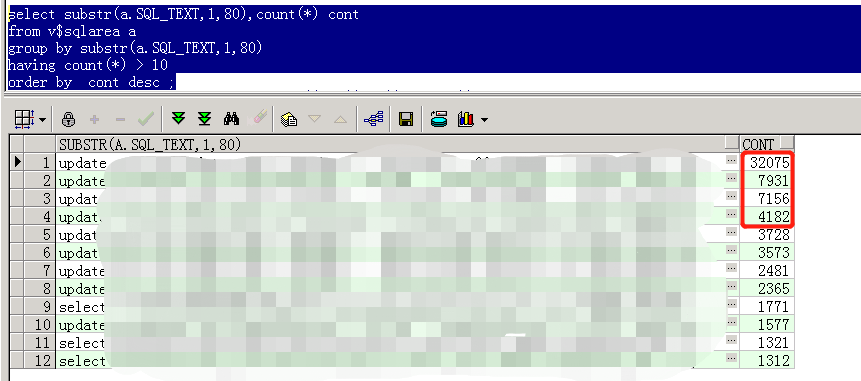
追根溯源,到底是硬解析占用了内存导致圣诞节也不平安。
温故而知新。
数据库硬解析较高,占用了大量内存(9G,sga 24G),致使ASMM管理下的sharedpool在极具膨胀,受罪的就是buffer(不足1G),一条SQL执行是需要buffer来缓存storage数据块的,那么buffer cache中的LRU list就会快速老化,不断频繁的从buffer中申请内存和等待申请内存,原本正常执行的SQL就增加了等待内存分配的时间,反过来 shared pool持有latch时间也随之边长,需要更多的shared pool,在不断地占地盘,直至4031,2节点无法分配内存来存储1节点返回来的gc message,lms等待71s,自动重启。


 9353
9353


 被折叠的 条评论
为什么被折叠?
被折叠的 条评论
为什么被折叠?
 到【灌水乐园】发言


