


当大佬给发这两张图的时候,啊,我的眼睛!定睛一看都要看瞎了好么。
再看跟随的话语,能筛掉一多半来面试前端的人?
好家伙还是一道前端面试题么。
nonono,这不是div堆叠做的,这么多div你想累死浏览器啊。
这个显然是用canvas api画出来的。
我们都知道,图片绚丽,颜色各不相同,但是实际上,对计算机来说,只是一堆数据罢了。都是一个一个字节,一个一个bit。
计算机可能也能感受到这些数据的美,这谁能知道呢。
图片,不是位图的话,都是一个一个像素点。位图就是类似svg这种,不会因为缩放而失真的图片。
一个像素点由4个字节,分别表示R,G,B,A,各个字节所代表的的意思,如下图。

虽然是一堆字节,但是也是有排列顺序的。
按照从上到下行的顺序,行内是从左到右的列的顺序。
这样排布下来的,这就是图片在计算机里的真相。
所以,我们就去造出这个真相不就能造出一副图片来了么?
<!DOCTYPE HTML>
<html>
<body>
<canvas id="canvas" height=256 width=256></canvas>
<script>
// 绘制在Canvas上
var context = canvas.getContext('2d');
var imagedata = context.createImageData(256, 256);
// 给对应坐标位置的数据设置色值黑色
for (var x = 0; x < 256; x+=4) {
    for (var y = 0; y <= 256; y+= 4) {
        var index = 4 * (y*256 + x);
        var index1 = 4 * ((y+1)*256 + x);
        var index2 = 4 * (y*256 + (x+1));
        var index3 = 4 * ((y+1)*256 + (x+1));
        // 变为黑色,色值依次是0, 0, 0, 256
        imagedata.data[index] = 0;
        imagedata.data[index + 1] = 0;
        imagedata.data[index + 2] = 0;
        imagedata.data[index + 3] = 255;
        imagedata.data[index1] = 0;
        imagedata.data[index1 + 1] = 0;
        imagedata.data[index1 + 2] = 0;
        imagedata.data[index1 + 3] = 255;
        imagedata.data[index2] = 0;
        imagedata.data[index2 + 1] = 0;
        imagedata.data[index2 + 2] = 0;
        imagedata.data[index2 + 3] = 255;
        imagedata.data[index3] = 0;
        imagedata.data[index3 + 1] = 0;
        imagedata.data[index3 + 2] = 0;
        imagedata.data[index3 + 3] = 255;
    }
}
// 再重绘
context.putImageData(imagedata, 0, 0);
</script>

</body>
</html>

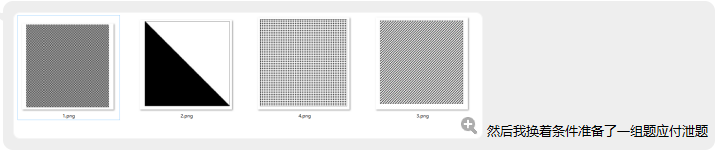
上述代码,画的是要求里的第三幅图片,也是 最基本的一张图片,因为黑色像素块的边长如果只为1的大小的话,也太小了,所以设置了2为边长,跳跃就是2*2=4
context.createImageData(256, 256);
这个就是canvas api造出的真相,也是原始的图片字节数组。
我们只要修改这个字节数组为我们想要的值,就能造出一幅图。
默认的真相,是白纸一张,并且是透明的,因为数组默认值都为0。
<!DOCTYPE HTML>
<html>
<body>
<canvas id="canvas" height=256 width=256></canvas>
<script>
// 绘制在Canvas上
var context = canvas.getContext('2d');
var imagedata = context.createImageData(256, 256);
// 给对应坐标位置的数据设置色值黑色
for (var x = 0; x < 256; x+=1) {
    for (var y = 0; y <= 256; y+= 1) {
    	if(x<=y){
        	var index = 4 * (y*256 + x);
          // 变为黑色,色值依次是0, 0, 0, 256
          imagedata.data[index] = 0;
          imagedata.data[index + 1] = 0;
          imagedata.data[index + 2] = 0;
          imagedata.data[index + 3] = 255;
        }

    }
}
// 再重绘
context.putImageData(imagedata, 0, 0);
</script>

</body>
</html>

这个对应要求的第二张图咯。
<!DOCTYPE HTML>
<html>
<body>
<canvas id="canvas" height=256 width=256></canvas>
<script>
// 绘制在Canvas上
var context = canvas.getContext('2d');
var imagedata = context.createImageData(256, 256);
// 给对应坐标位置的数据设置色值黑色
for (var x = 0; x < 256; x+=4) {
    for (var y = 0; y <= 256; y+= 4) {
    	var index = 4 * (y*256 + x);
        var index1 = 4 * ((y+1)*256 + x);
          var index2 = 4 * ((y+1)*256 + x);
          var index3 = 4 * (y*256 + (x+1));
          // 变为黑色,色值依次是0, 0, 0, 256
          imagedata.data[index] = 0;
          imagedata.data[index + 1] = 0;
          imagedata.data[index + 2] = 0;
          imagedata.data[index + 3] = 255;
        	imagedata.data[index1] = 0;
          imagedata.data[index1 + 1] = 0;
          imagedata.data[index1 + 2] = 0;
          imagedata.data[index1 + 3] = 255;
          imagedata.data[index2] = 0;
          imagedata.data[index2 + 1] = 0;
          imagedata.data[index2 + 2] = 0;
          imagedata.data[index2 + 3] = 255;
          imagedata.data[index3] = 0;
          imagedata.data[index3 + 1] = 0;
          imagedata.data[index3 + 2] = 0;
          imagedata.data[index3+ 3] = 255;
          var index4 = 4 * ((y+2)*256 + (x+2));
        var index5 = 4 * ((y+3)*256 + (x+2));
          var index6 = 4 * ((y+3)*256 + (x+2));
          var index7 = 4 * ((y+2)*256 + (x+3));
          imagedata.data[index4] = 0;
          imagedata.data[index4 + 1] = 0;
          imagedata.data[index4 + 2] = 0;
          imagedata.data[index4 + 3] = 255;
          imagedata.data[index5] = 0;
          imagedata.data[index5 + 1] = 0;
          imagedata.data[index5 + 2] = 0;
          imagedata.data[index5 + 3] = 255;
          imagedata.data[index6] = 0;
          imagedata.data[index6 + 1] = 0;
          imagedata.data[index6 + 2] = 0;
          imagedata.data[index6 + 3] = 255;
          imagedata.data[index7] = 0;
          imagedata.data[index7 + 1] = 0;
          imagedata.data[index7 + 2] = 0;
          imagedata.data[index7 + 3] = 255;

    }
}
// 再重绘
context.putImageData(imagedata, 0, 0);
</script>

</body>
</html>

第四张图
第一张看不清了,就酱吧。
还是蛮有意思的。


 966
966


 被折叠的 条评论
为什么被折叠?
被折叠的 条评论
为什么被折叠?
 到【灌水乐园】发言


