


案例2:东方财富股吧文本分析----code模块封装命令行运行版
0. 先导语
Python代码模块化是指将大型的代码分割成小的、可重用的代码块,这些代码块被称为模块。模块可以通过import语句导入到其他代码中,从而提供了一种有效的组织和重用代码的方法。Python代码模块化有以下几个好处:
-
1. 提高代码的可读性和可维护性:模块化将代码分解为更小、更容易理解的组件,可以更容易地理解每个模块所做的工作,使得代码更加清晰易懂,提高代码的可读性。可以更容易地找到和修复问题。有助于代码的可维护性。
-
2. 降低代码的复杂度:模块化使得代码更加模块化、组合和重用,从而降低了代码的复杂度,避免了代码过于臃肿和混乱。可以更容易地管理代码,并且可以更容易地添加、修改或删除功能。
-
3. 加快开发效率:模块化使得代码可以被多个人共同开发和维护,从而加快了开发效率。
-
4. 提高代码的可重用性:模块化使得代码可以被多个程序和项目共同使用,如果需要多次使用相同的代码,只需要将代码保存在一个模块中,然后在需要的地方导入即可。从而提高了代码的可重用性,减少了重复开发的工作。
-
5. 便于测试和调试:模块化将代码分解为更小的组件,可以更容易地编写单元测试,使得测试和调试变得更加容易,以确保每个模块都按照预期工作。从而提高了程序的稳定性和可靠性。
总的来说,代码模块化是一个非常重要的编程技巧,能够使得代码更加清晰易懂、可维护性更高、开发效率更高、可重用性更高,也更容易测试和调试。
1.东方财富股吧文本信息爬取
1.1 模块getGuBaNews.py的内容
getGuBaNews.py下载地址
getGuBaNews.py文件中的函数 get_guba_news_onePage用下面的代码替换,之前的代码是东方财富贴吧之前网页结构的爬取code,现在网页进行了更新,所以爬取路径略有改动。
import requests
from bs4 import BeautifulSoup
import pandas as pd
import time

headers={
    "User-Agent":"你自己的User-Agent",
    "Cookie":"你自己的Cookie"
    }

# 获取单页股吧新闻
def get_guba_news_onePage(url):
    response=requests.get(url=url,headers=headers)
    html_content = response.text
    soup = BeautifulSoup(html_content, "html.parser")
    guba_news = soup.find('tbody', {'class': 'listbody'})
#     read_num = list(map(lambda x:x.text,guba_news.find_all('span', {'class': 'l1 a1'})[1:]))
    read_num = []
    for read in guba_news.find_all('div', {'class': 'read'})[1:]:
        if '万' in read.text:
            read_num.append(int(float(read.text.replace('万', '')) * 10000))
        else:
             read_num.append(int(read.text))
#     comment_num = list(map(lambda x:x.text,guba_news.find_all('span', {'class': 'l2 a2'})[1:]))
    comment_num = []
    for comment in guba_news.find_all('div', {'class': 'reply'})[1:]:
        if '万' in comment.text:
            comment_num.append(int(float(comment.text.replace('万', '')) * 10000))
        else:
             comment_num.append(int(comment.text))
    title_content = list(map(lambda x:x.text,guba_news.find_all('div', {'class': 'title'})[1:]))
    author_name = list(map(lambda x:x.text,guba_news.find_all('div', {'class': 'author'})[1:]))
    update_time = list(map(lambda x:'2023-'+x.text,guba_news.find_all('div', {'class': 'update'})[1:]))
    guba_news = pd.DataFrame({
        'read_num': read_num,
        'comment_num': comment_num,
        'title_content':title_content,
        'author_name':author_name,
        'update_time':update_time
    })
    return guba_news

def get_guba_news_batch(stockID,start_page,end_page):
    save_file = './data/guba_news_'+stockID+f'_pages{start_page}-{end_page}'+'.csv'
    for page_num in range(start_page,end_page+1):
        time.sleep(1)
        url = "https://guba.eastmoney.com/list,{}_{}.html".format(stockID,page_num)
        if page_num==start_page:
            guba_news = get_guba_news_onePage(url)
            guba_news.to_csv(save_file, index=False)
            print(f'第{page_num}页数据已保存。')
        else:
            guba_news = pd.concat([pd.read_csv(save_file), get_guba_news_onePage(url)], axis=0)
            guba_news.to_csv(save_file, index=False)
            print(f'第{page_num}页数据已保存。')
1.2 东方财富股吧文本信息爬取主运行文件run_main_getnews.py内容
import getGuBaNews
import warnings
warnings.filterwarnings('ignore')
import sys

stockID = sys.argv[1]
start_page = int(sys.argv[2])
end_page = int(sys.argv[3])
getGuBaNews.get_guba_news_batch(stockID,start_page,end_page)
1.3 命令行运行
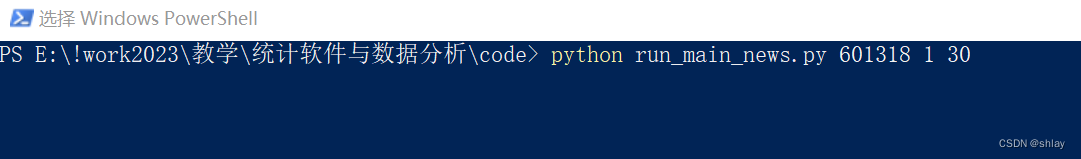
在文件getGuBaNews.py和run_main_getnews.py的同级目录下shift_右键打开PowerShell 窗口,然后输入下面的命令运行:
python run_main_getnews.py 601318 1 30
601318 1 30分别表示run_main_getnews.py中需要输入的三个参数:
- stockID = sys.argv[1]
- start_page = int(sys.argv[2])
- end_page = int(sys.argv[3])
多个参数之间用空格分开
2.东方财富股吧文本信息分析
2.1 模块gubaNewsAnalyse.py的内容
import pandas as pd
import re
import matplotlib.pyplot as plt
import seaborn as sns
import jieba
from wordcloud import WordCloud
from snownlp import SnowNLP, sentiment#情感分析库
import networkx as nx
#中文字符设定
plt.rcParams['font.sans-serif']=['SimHei']
plt.rcParams['axes.unicode_minus']=False

def loadData(file):
    guba_news = pd.read_csv(file)
    guba_news['update_time'] = pd.to_datetime(guba_news['update_time'], format='%Y-%m-%d %H:%M:%S')
    return guba_news

def hotTopicAnalyse(df,top_num=10):
    # 按照阅读数排序
    guba_news = df.sort_values(by='read_num', ascending=False)

    # 获取前20条数据
    top = guba_news.head(top_num)
    print('热门话题排行榜:')
    print(top)

    # 绘制阅读数和评论数的关系图
    plt.figure(figsize=(8, 6))
    sns.scatterplot(x=guba_news['read_num'], y=guba_news['comment_num'])
    plt.title('阅读数与评论数的关系')
    plt.xlabel('阅读数')
    plt.ylabel('评论数')
    plt.show()

    # 分词
    text = ' '.join(guba_news['title_content'].tolist())
    words = list(jieba.cut(text))

    # 去除停用词
    stopwords = [' ','[',']',',', '。', '!', '?', '的', '了', '在', '是', '我', '你', '他', '她', '它', '我们', '你们', '他们', '她们', '它们','今天','明天','中国','平安','都','资讯','2023']
#     stopwords = pd.read_csv("data/stopwords.txt",index_col=False,quoting=3,sep="\t",names=['stopword'],encoding='utf-8')  #quoting=3全部引用
    words = [w for w in words if w not in stopwords and len(w)>=2]
    word_count = {}
    for word in words:
        if word in word_count:
            word = re.escape(word)
            word_count[word] += guba_news[guba_news['title_content'].str.contains(word)]['read_num'].sum()
        else:
            word = re.escape(word)
            word_count[word] = guba_news[guba_news['title_content'].str.contains(word)]['read_num'].sum()

    # 绘制主题词词云图
    wordcloud = WordCloud(width=800,height=600,background_color="white",font_path="msyh.ttc")
    wordcloud.generate_from_frequencies(word_count)
    plt.imshow(wordcloud, interpolation="bilinear")
    plt.axis("off")
    plt.show()
    return word_count


def investSentimentAnalyse(df, sentiment_thres=0.5):
    titles = df['title_content'].tolist()
    sentiments = []
    for title in titles:
        s = SnowNLP(title)
        sentiments.append(s.sentiments)

    # 统计情感分布
    positive_num = len(
        [sentiment for sentiment in sentiments if sentiment > sentiment_thres])
    negative_num = len(
        [sentiment for sentiment in sentiments if sentiment < sentiment_thres])
    neutral_num = len([
        sentiment for sentiment in sentiments if sentiment == sentiment_thres
    ])

    # 输出结果
    print(f'积极评论数:{positive_num},占比:{positive_num/len(sentiments):.2%}')
    print(f'消极评论数:{negative_num},占比:{negative_num/len(sentiments):.2%}')
    print(f'中性评论数:{neutral_num},占比:{neutral_num/len(sentiments):.2%}')


def postTimeAnalyse(df):
    # 统计每个小时的帖子数量
    post_count_by_hour = df.groupby(df['update_time'].dt.hour)['title_content'].count()

    # 统计每个小时的评论数量
    comment_count_by_hour = df.groupby(df['update_time'].dt.hour)['comment_num'].sum()

    # 统计每天的帖子数量
    post_count_by_day = df.groupby(df['update_time'].dt.date)['title_content'].count()

    # 统计每天的评论数量
    comment_count_by_day = df.groupby(df['update_time'].dt.date)['comment_num'].sum()

    # 可视化绘制图表
    fig, ax = plt.subplots(2, 2, figsize=(10, 6))
    post_count_by_hour.plot(ax=ax[0, 0], title='帖子数量按小时统计')
    comment_count_by_hour.plot(ax=ax[0, 1], title='评论数量按小时统计')
    post_count_by_day.plot(ax=ax[1, 0], title='帖子数量按天统计')
    comment_count_by_day.plot(ax=ax[1, 1], title='评论数量按天统计')
    plt.tight_layout()
    plt.show()

def topicRelationAnalyse(df,top_num=10):
    # 将主题进行分词
    df['seg_title'] = df['title_content'].apply(lambda x: ' '.join(jieba.cut(x)))

    text = ' '.join(df['title_content'].tolist())
    words = list(jieba.cut(text))
    # 去除停用词
    stopwords = [' ','[',']',',', '。', '!', '?', '的', '了', '在', '是', '我', '你', '他', '她', '它', '我们', '你们', '他们', '她们', '它们','今天','明天','中国','平安','都','资讯','2023']
    words = [w for w in words if w not in stopwords and len(w)>=2]

    word_count={}
    for word in words:
        if word in word_count:
            word_count[word]+= df[df['title_content'].str.contains(word)]['read_num'].sum()
        else:
            word_count[word] = df[df['title_content'].str.contains(word)]['read_num'].sum()

    # 取出出现次数最多的前top_num个词汇
    sorted_word_count = sorted(word_count.items(), key=lambda x: x[1], reverse=True)
    top_words = [x[0] for x in sorted_word_count[:top_num]]
    print(f"出现次数最多的前{top_num}个词汇:")
    print(top_words)
    df['seg_title'] = df['title_content'].apply(lambda x: ' '.join(jieba.cut(x)))


    # 构建图
    G = nx.Graph()
    for text in df['seg_title']:
        words = set(text.split())
        for word1 in words:
            if word1 in top_words:
                for word2 in words:
                    if word1 != word2 and word2 in top_words:
                        if G.has_edge(word1, word2):
                            G[word1][word2]['weight'] += 1
                        else:
                            G.add_edge(word1, word2, weight=1)

    # 绘制图
    plt.figure(figsize=(10, 10))
    pos = nx.spring_layout(G, k=0.5)
    nx.draw_networkx_nodes(G, pos, node_size=2000, node_color='lightblue')
    nx.draw_networkx_edges(G, pos, width=[G[u][v]['weight']*0.1 for u, v in G.edges()])
    nx.draw_networkx_labels(G, pos, font_size=20, font_family='Microsoft YaHei')
    plt.axis('off')
    plt.show()
def userActionAnalyse(df,top_post_user_Num=10):

    # 统计每个作者的发帖数量、阅读数和评论数量
    author_post_count = df.groupby('author_name')['title_content'].count()
    read_count = df.groupby('author_name')['read_num'].sum()
    comment_count = df.groupby('author_name')['comment_num'].sum()

    # 合并数据
    df1 = pd.concat([author_post_count,read_count,comment_count], axis=1)
    df1.columns = ['发帖数', '阅读数','评论数']
    # 根据发帖数进行排序
    df1 = df1.sort_values(by='发帖数', ascending=False)
    df_topUser = df1[1:1+top_post_user_Num]

    # 分析每个作者的平均发帖和评论时间间隔

    filtered_author_df = df[df['author_name'].isin(list(df_topUser.index))]
    df_sorted = filtered_author_df.sort_values(['author_name', 'update_time'])
    df_sorted['time_interval'] = df_sorted.groupby('author_name')['update_time'].diff().dt.total_seconds()

    # 可视化作者发帖数量和评论数量
    fig, ax = plt.subplots(2, 2, figsize=(10, 10))

    df_topUser['发帖数'].plot(kind='bar', ax=ax[0, 0])
    ax[0, 0].set_title('作者发帖数')
    ax[0, 0].set_xlabel('作者')
    ax[0, 0].set_ylabel('发帖数')

    df_topUser['阅读数'].plot(kind='bar', ax=ax[0, 1])
    ax[0, 1].set_title('作者帖子阅读数')
    ax[0, 1].set_xlabel('作者')
    ax[0, 1].set_ylabel('阅读数')

    df_topUser['评论数'].plot(kind='bar', ax=ax[1, 0])
    ax[1, 0].set_title('作者帖子评论数')
    ax[1, 0].set_xlabel('作者')
    ax[1, 0].set_ylabel('评论数')

    # 可视化每个作者的平均发帖和评论时间间隔
    author_mean_time_interval = df_sorted.groupby('author_name')['time_interval'].mean().dropna()
    author_mean_time_interval.plot(kind='bar', ax=ax[1, 1])
    ax[1, 1].set_title('作者发帖的平均时间间隔')
    ax[1, 1].set_xlabel('作者')
    ax[1, 1].set_ylabel('时间间隔 (秒)')

    plt.tight_layout()
    plt.show()
    return df1
2.2 东方财富股吧文本信息分析主运行文件run_main_gubaNews.py内容
import warnings
warnings.filterwarnings('ignore')
import sys
import gubaNewsAnalyse as gna
file = sys.argv[1]
what_analyse = sys.argv[2]

df = gna.loadData(file)
what_analyse = what_analyse.split('#')

if '1' in what_analyse:
    print('正在进行热门话题分析>>>>>>>>>>>>>>>>>>')
    gna.hotTopicAnalyse(df)
if '2' in what_analyse:
    print('正在进行投资情绪分析>>>>>>>>>>>>>>>>>>')
    gna.investSentimentAnalyse(df)
if '3' in what_analyse:
    print('正在进行发帖时间分析>>>>>>>>>>>>>>>>>>')
    gna.postTimeAnalyse(df)
if '4' in what_analyse:
    print('正在进行热门主题关联分析>>>>>>>>>>>>>>>>>>')
    gna.topicRelationAnalyse(df)
if '5' in what_analyse:
    print('正在进行用户行为分析>>>>>>>>>>>>>>>>>>')
    gna.userActionAnalyse(df)

print('已完成所有分析!')
2.3 命令行运行
多个参数之间用空格分开
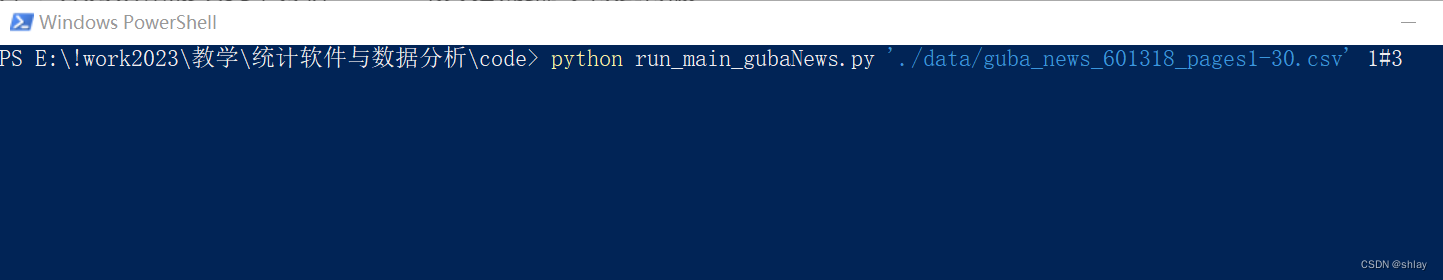
在文件gubaNewsAnalyse.py和run_main_gubaNews.py的同级目录下shift+右键打开PowerShell 窗口,然后输入下面的命令运行:
python run_main_gubaNews.py './data/guba_news_601318_pages1-30.csv' 1#3
‘./data/guba_news_601318_pages1-30.csv’ 1#3分别表示run_main_gubaNews.py中需要输入的两个参数:
- file = sys.argv[1] #数据文件路径及文件名
- what_analyse = sys.argv[2] #需要执行的一种或多种文本分析
若仅执行其中一种文本分析(如2:投资情绪分析)则直接:
python run_main_gubaNews.py './data/guba_news_601318_pages1-30.csv' 2
若执行其中某几种文本分析(如2:投资情绪分析,3:发帖时间分析,5:用户行为分析)则用#连接各文本分析对应的数字代码即可:
python run_main_gubaNews.py './data/guba_news_601318_pages1-30.csv' 2#3#5


 970
970

 被折叠的 条评论
为什么被折叠?
被折叠的 条评论
为什么被折叠?
 到【灌水乐园】发言


