


前言
在.NET应用开发中数据集的交互式显示是一个非常常见的功能,如需要创建折线图、柱状图、饼图、散点图等不同类型的图表将数据呈现出来,帮助人们更好地理解数据、发现规律,并支持决策和沟通。本文我们将一起来学习一下如何使用ScottPlot库在.NET WinForms中快速实现大型数据集的交互式显示。
ScottPlot类库介绍
ScottPlot是一个免费、开源(采用MIT许可证)的强大.NET交互式绘图库,能够轻松地实现大型数据集的交互式显示。使用几行代码即可快速创建折线图、柱状图、饼图、散点图等不同类型的图表。
ScottPlot类库支持平台和框架
Console Application、WinForms、WPF、Avalonia、Blazor、WinUI等多个平台和框架。
ScottPlot类库源代码
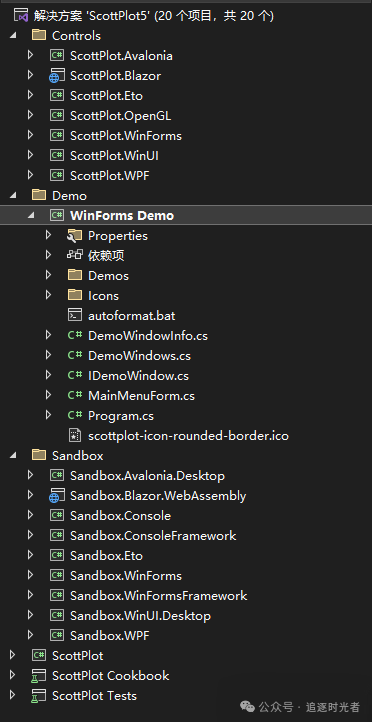
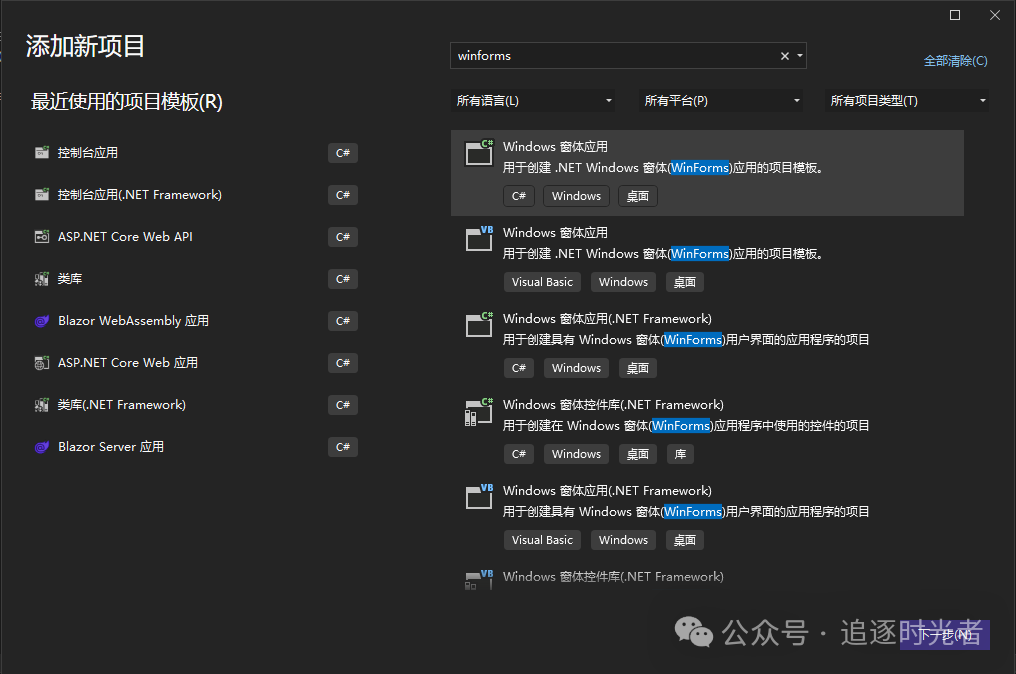
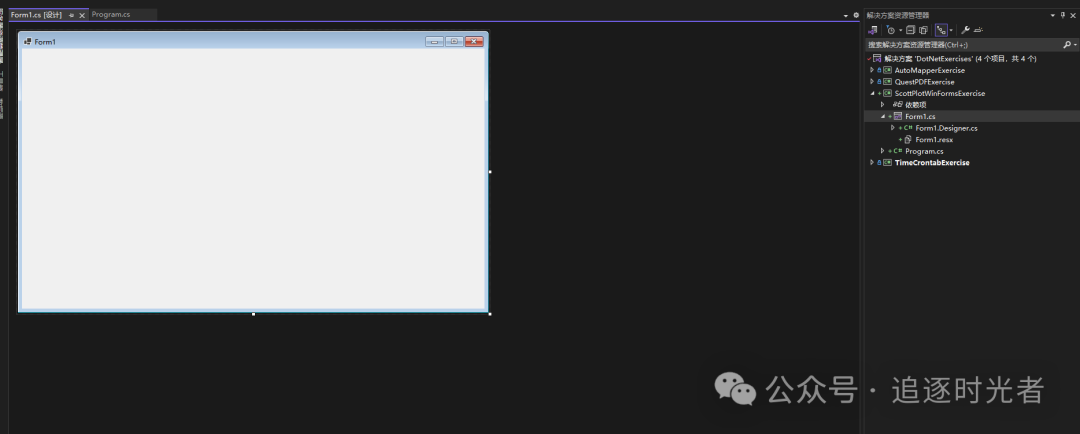
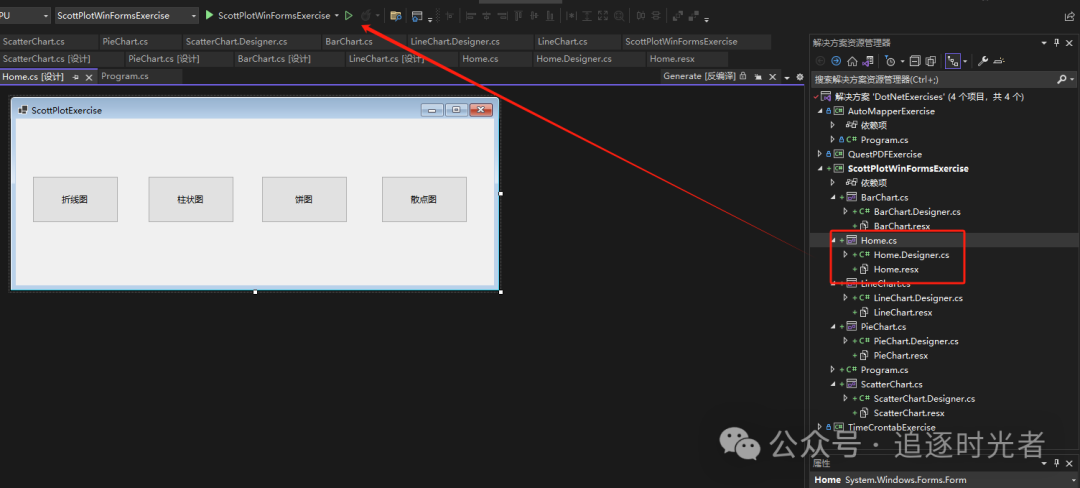
新建WinForms项目
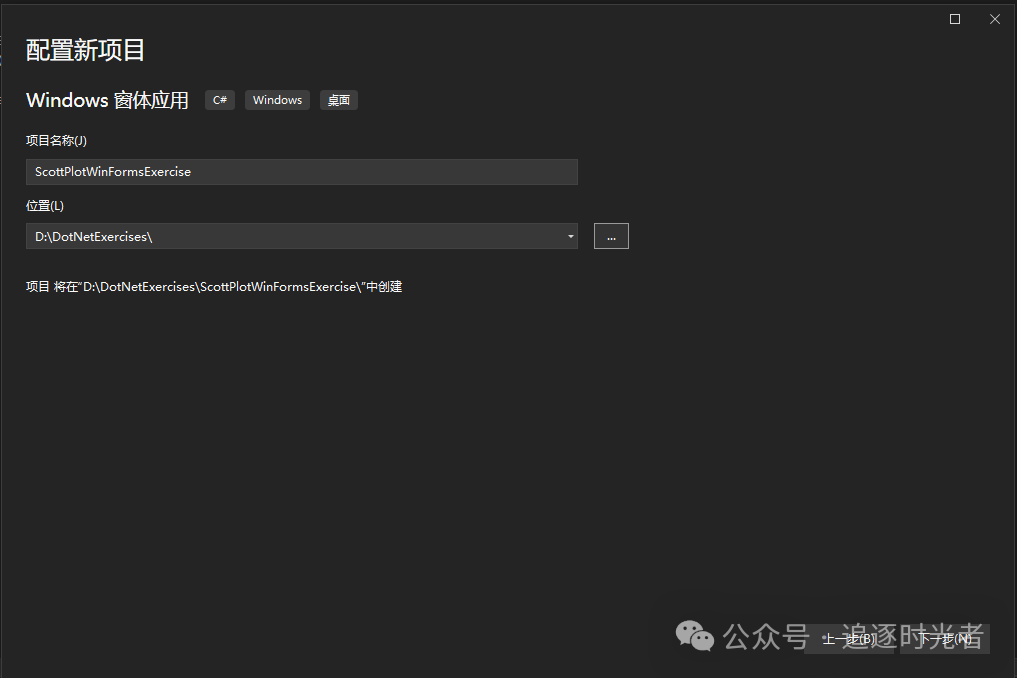
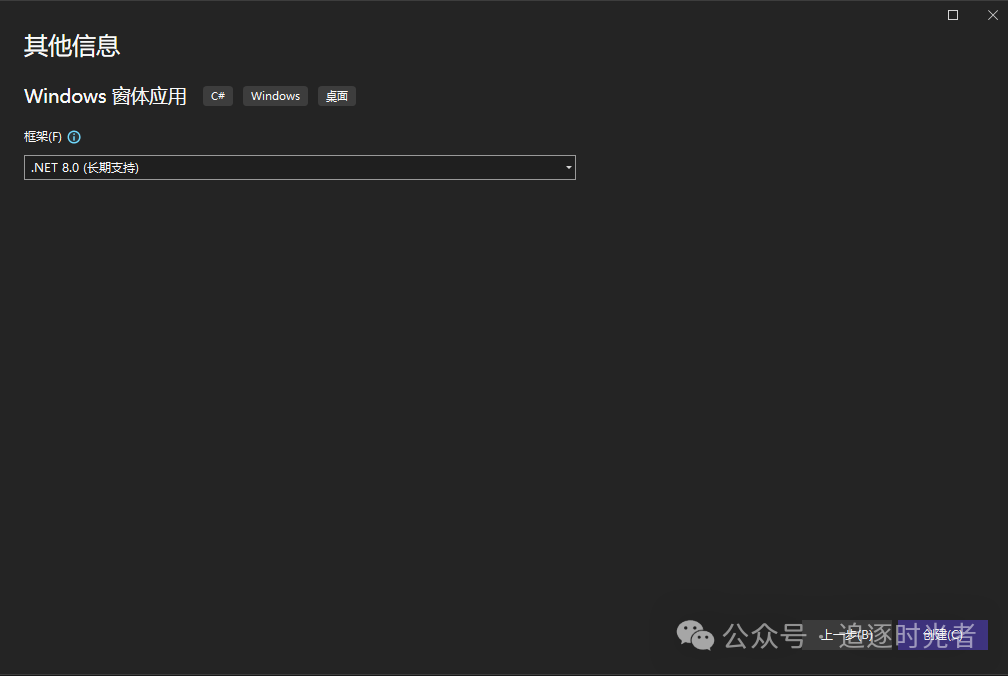
新建一个名为ScottPlotWinFormsExercise的项目。
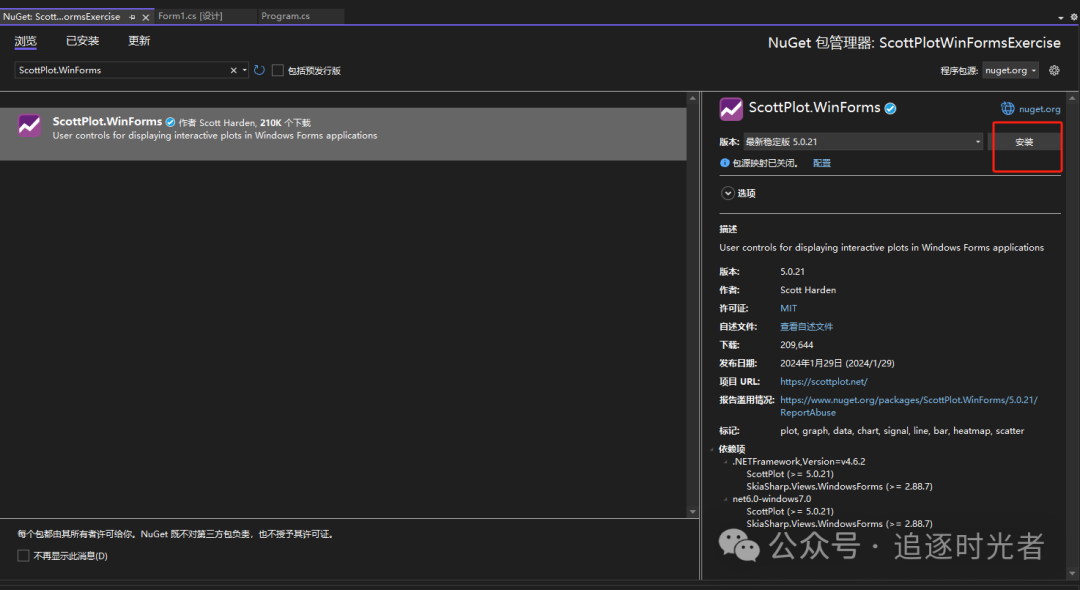
安装ScottPlot.WinForms包
搜索ScottPlot.WinForms包安装:
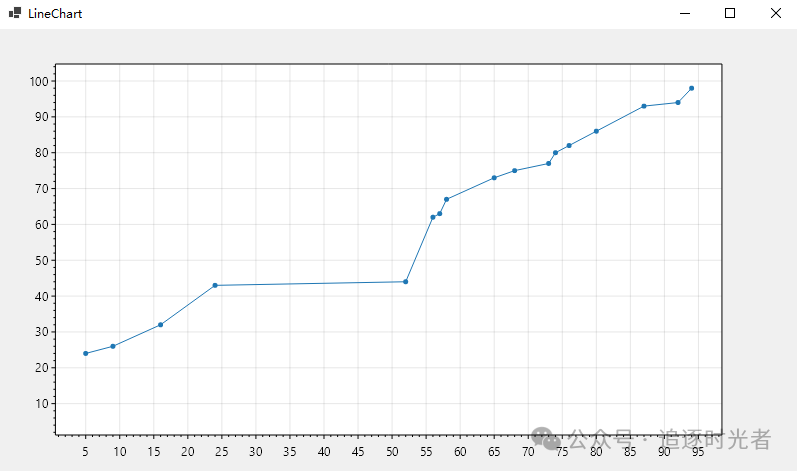
折线图实现
创建名为:LineChart窗体。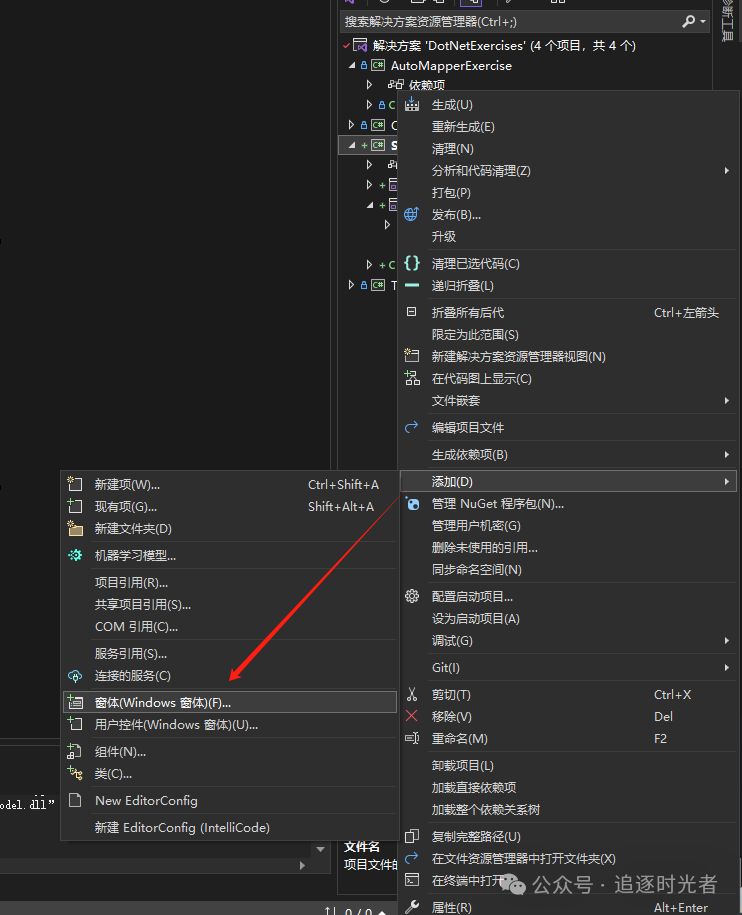

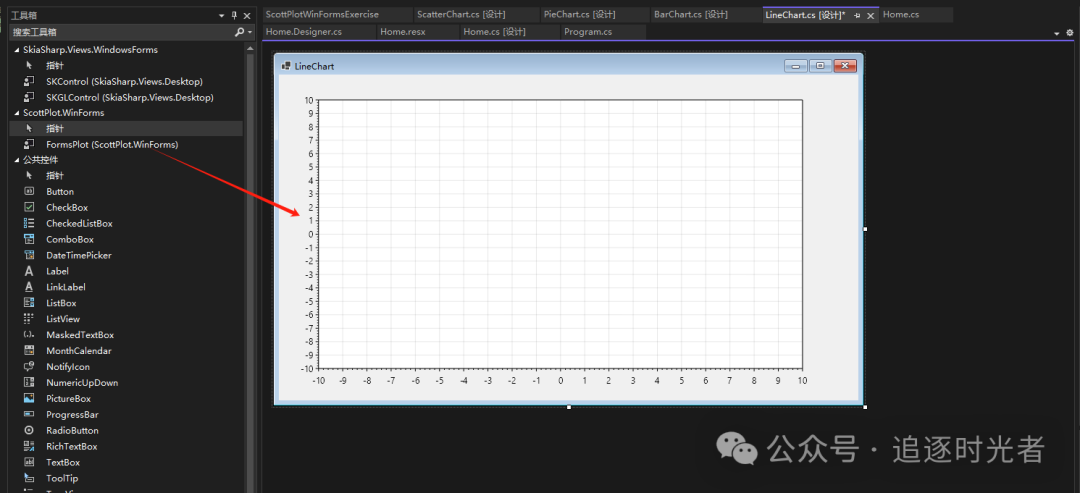
将FormsPlot (ScottPlot.WinForms)从工具箱拖到窗体中:
输入以下代码:
public partial class LineChart : Form
    {
        public LineChart()
        {
            double[] dataX = GetRandomNum(20).Distinct().OrderByDescending(x => x).ToArray();
            double[] dataY = GetRandomNum(19).Distinct().OrderByDescending(x => x).ToArray();
            formsPlot1.Plot.Add.Scatter(dataX, dataY);
            formsPlot1.Refresh();
        }

        public double[] GetRandomNum(int length)
        {
            double[] getDate = new double[length];
            Random random = new Random(); //创建一个Random实例
            for (int i = 0; i < length; i++)
            {
                getDate[i] = random.Next(1, 100); //使用同一个Random实例生成随机数
            }
            return getDate;
        }
    }
运行效果展示:
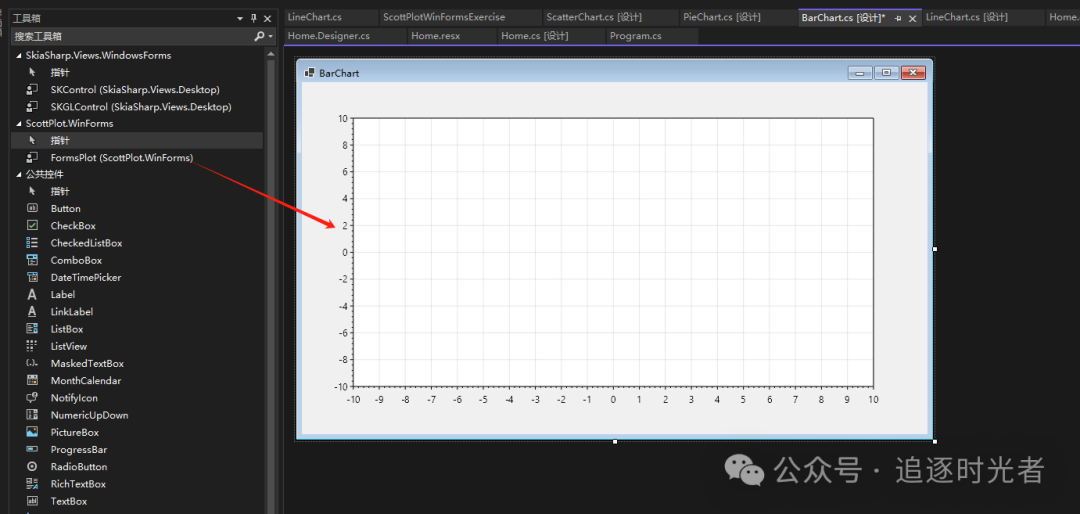
柱状图实现
创建名为:BarChart窗体。
将FormsPlot (ScottPlot.WinForms)从工具箱拖到窗体中:
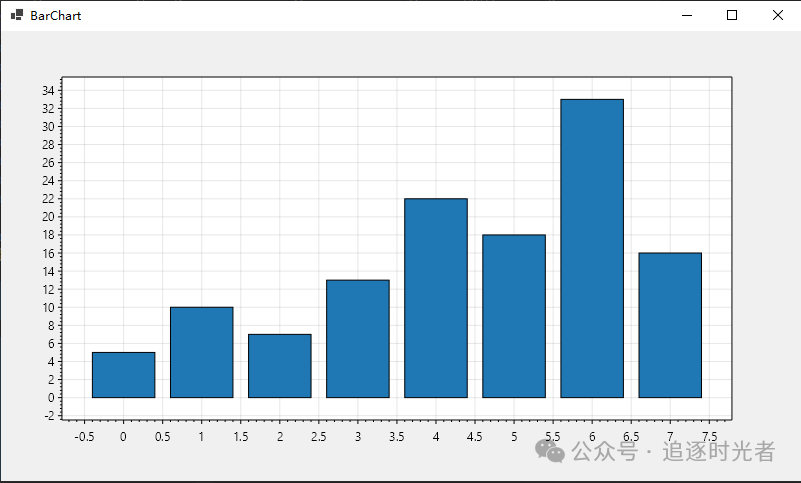
输入以下代码:
public partial class BarChart : Form
    {
        public BarChart()
        {
            double[] values = { 5, 10, 7, 13, 22, 18, 33, 16 };
            formsPlot1.Plot.Add.Bars(values);
            formsPlot1.Refresh();
        }
    }
运行效果展示:
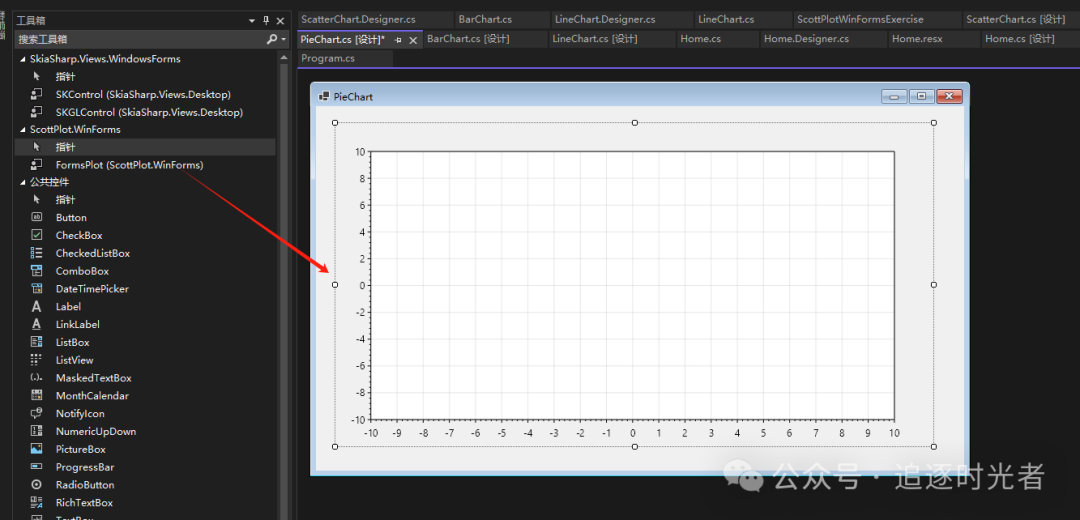
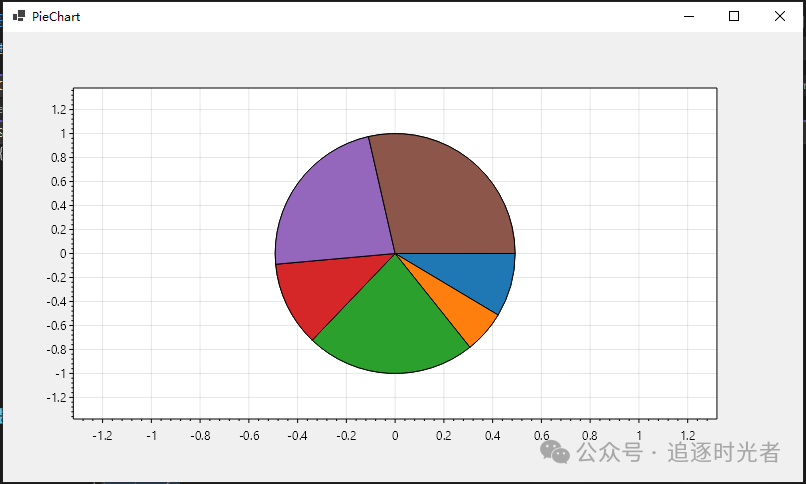
饼图实现
创建名为:PieChart窗体。
将FormsPlot (ScottPlot.WinForms)从工具箱拖到窗体中:
输入以下代码:
public partial class PieChart : Form
    {
        public PieChart()
        {
            double[] values = { 3, 2, 8, 4, 8, 10 };
            formsPlot1.Plot.Add.Pie(values);
            formsPlot1.Refresh();
        }
    }
运行效果展示:
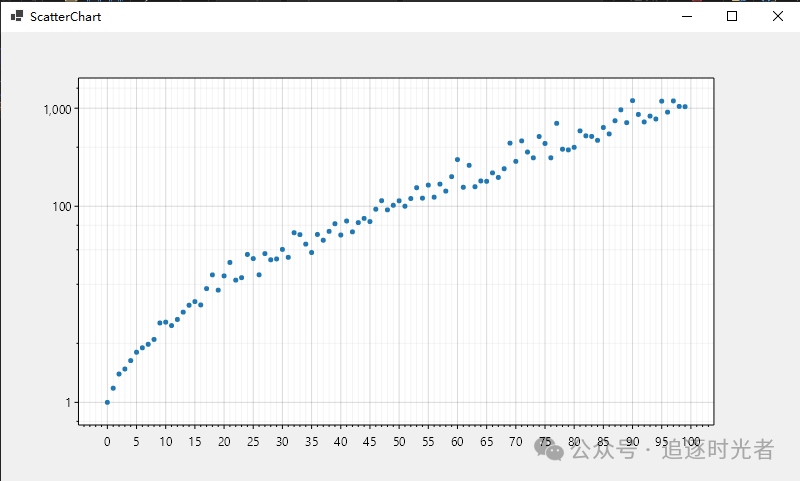
散点图实现
创建名为:ScatterChart窗体。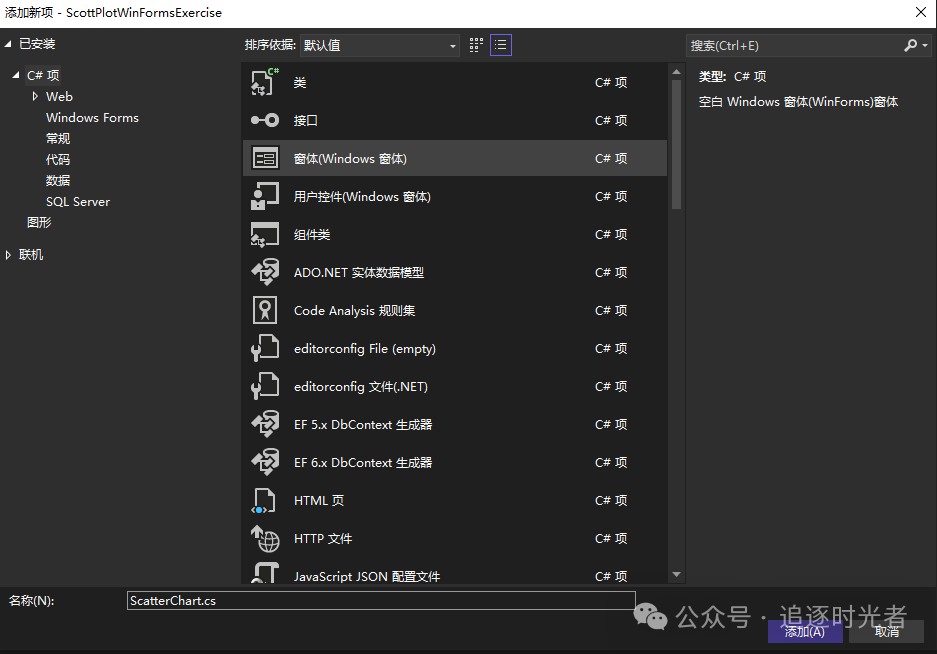
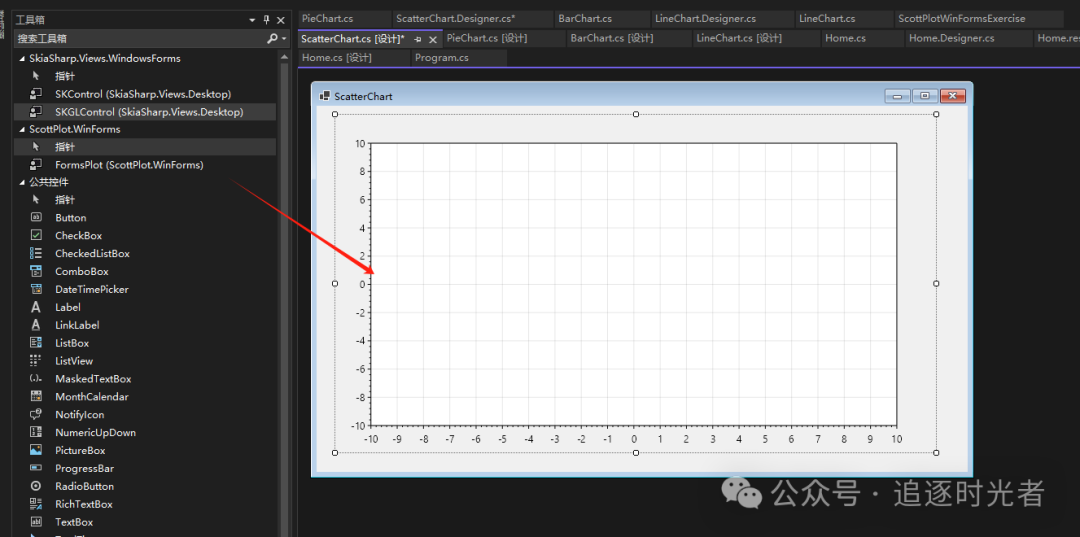
将FormsPlot (ScottPlot.WinForms)从工具箱拖到窗体中:
输入以下代码:
public partial class ScatterChart : Form
    {
        public ScatterChart()
        {
            //从原始数据开始
            double[] xs = Generate.Consecutive(100);
            double[] ys = Generate.NoisyExponential(100);

            //对数据进行对数缩放,并处理负值
            double[] logYs = ys.Select(Math.Log10).ToArray();

            //将对数缩放的数据添加到绘图中
            var sp = formsPlot1.Plot.Add.Scatter(xs, logYs);
            sp.LineWidth = 0;

            //创建一个次要刻度生成器,用于放置对数分布的次要刻度
            ScottPlot.TickGenerators.LogMinorTickGenerator minorTickGen = new();

            //创建一个数值刻度生成器,使用自定义的次要刻度生成器
            ScottPlot.TickGenerators.NumericAutomatic tickGen = new();
            tickGen.MinorTickGenerator = minorTickGen;

            //创建一个自定义刻度格式化程序,用于设置每个刻度的标签文本
            static string LogTickLabelFormatter(double y) => $"{Math.Pow(10, y):N0}";

            //告诉我们的主要刻度生成器仅显示整数的主要刻度
            tickGen.IntegerTicksOnly = true;

            //告诉我们的自定义刻度生成器使用新的标签格式化程序
            tickGen.LabelFormatter = LogTickLabelFormatter;

            //告诉左轴使用我们的自定义刻度生成器
            formsPlot1.Plot.Axes.Left.TickGenerator = tickGen;

            //显示次要刻度的网格线
            var grid = formsPlot1.Plot.GetDefaultGrid();
            grid.MajorLineStyle.Color = Colors.Black.WithOpacity(.15);
            grid.MinorLineStyle.Color = Colors.Black.WithOpacity(.05);
            grid.MinorLineStyle.Width = 1;

            formsPlot1.Refresh();
        }
    }
运行效果展示:
项目演示入口
private void Btn_ScatterChart_Click(object sender, EventArgs e)
        {
            ScatterChart formScatterChart = new ScatterChart();
            // 显示目标窗体
            formScatterChart.Show();
        }

        private void Btn_PieChart_Click(object sender, EventArgs e)
        {
            PieChart formPieChart = new PieChart();
            // 显示目标窗体
            formPieChart.Show();
        }

        private void Btn_BarChart_Click(object sender, EventArgs e)
        {
            BarChart formbarChart = new BarChart();
            // 显示目标窗体
            formbarChart.Show();
        }

        private void Btn_LineChart_Click(object sender, EventArgs e)
        {
            LineChart formLineChart = new LineChart();
            // 显示目标窗体
            formLineChart.Show();
        }
项目源码地址
更多项目实用功能和特性欢迎前往项目开源地址查看👀,别忘了给项目一个Star支持💖。
GitHub开源地址:https://github.com/ScottPlot/ScottPlot
在线文档地址:https://scottplot.net/cookbook/5.0/
ScottPlotWinFormsExercise:https://github.com/YSGStudyHards/DotNetExercises
优秀项目和框架精选
该项目已收录到C#/.NET/.NET Core优秀项目和框架精选中,关注优秀项目和框架精选能让你及时了解C#、.NET和.NET Core领域的最新动态和最佳实践,提高开发工作效率和质量。坑已挖,欢迎大家踊跃提交PR推荐或自荐(让优秀的项目和框架不被埋没🤞)。
https://github.com/YSGStudyHards/DotNetGuide/blob/main/docs/DotNet/DotNetProjectPicks.md

免费开源的程序员简历模板
了解作者&获取更多学习资料
程序员常用的开发工具软件推荐
加入DotNetGuide技术社区交流群
.NET/.NET Core ORM框架资源汇总
ASP.NET Core开发者学习指南路线图


学习是一个永无止境的过程,你知道的越多,你不知道的也会越多,在有限的时间内坚持每天多学一点,你一定能成为你想要成为的那个人。不积跬步无以至千里,不积小流无以成江河!!!


 4342
4342


 被折叠的 条评论
为什么被折叠?
被折叠的 条评论
为什么被折叠?
 到【灌水乐园】发言


