


 本文介绍了如何使用Leaflet库在地图上绘制线,并重点讲解了利用leaflet-polylinedecorator插件来添加箭头指示方向的方法。通过创建图层组,设置经纬度,使用setLatLngs方法来改变或重新绘制线条,以及隐藏或清除线条的操作。当需要显示线条方向时,可以引入并应用该插件,如果npm下载不便,可以直接从CSDN下载资源并引用。
1.创建空的图层组
this.xiangroup = L.featureGroup([]) //创建图层
this.map.addLayer(this.xiangroup)
2.绘制,使用L.polyline(记住两点一线,如果只有一个点的经纬度,是没有线的)
var latlngs = [ //线中点的经纬度点
    [38, 0],
    [38, 180],
    [0, 0]
]
this.polyline = L.polyline(latlngs, {
    color: 'red',//线的颜色
    weight: 3 //线的粗细
}).addTo(this.xiangroup);
3 .如果要对线进行重新绘制,或者改变可以使用setLatLngs方法
//this.polyline是上面已经绘制好的线
//latlngs为这条线的各个新经纬度点
this.polyline.setLatLngs(latlngs)
如果要让线隐藏或清空,可以将latlngs设为[] 就可以了。当然也可以清空图层重新绘制,看需求操作。
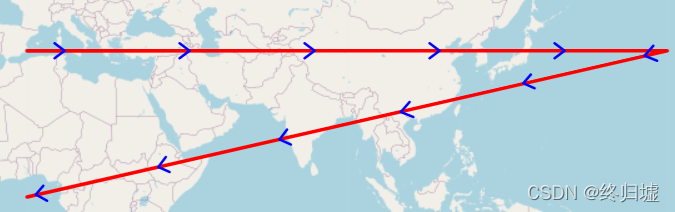
4.带箭头的线
需求中需要标记方向时,可以引入leaflet中的leaflet-polylinedecorator插件来实现
npm install leaflet-polylinedecorator![]()
5.在需要的页面引入
import 'leaflet-polylinedecorator'var latlngs = [ //线中点的经纬度点
[38, 0],
[38, 180],
[0, 0]
]
this.polyline = L.polyline(latlngs, {
color: 'red',//线的颜色
weight: 3 //线的粗细
}).addTo(this.xiangroup);
L.polylineDecorator(this.polyline, {
patterns: [{
offset: 30, // 箭头起始位置距离线条两端的距离
repeat: 100, // 箭头重复的间隔
symbol: L.Symbol.arrowHead({
pixelSize: 10, // 箭头大小
headAngle: 75, // 箭头角度
polygon: false,//箭头是否为多边形
pathOptions: {
// stroke: true,
weight: 2,//箭头粗细
color: 'blue'//箭头颜色
}
})
}]
}).addTo(this.xiangroup);
6.如果npm下载后用不了,可以尝试复制leaflet.polylineDecorator.js中的代码粘贴在一个js中,然后在页面上引用这个js就可以了,
可以去下面这个链接中复制
 https://download.csdn.net/download/s_9527_s/84979040


 1550
1550

 被折叠的 条评论
为什么被折叠?
被折叠的 条评论
为什么被折叠?
 到【灌水乐园】发言


