


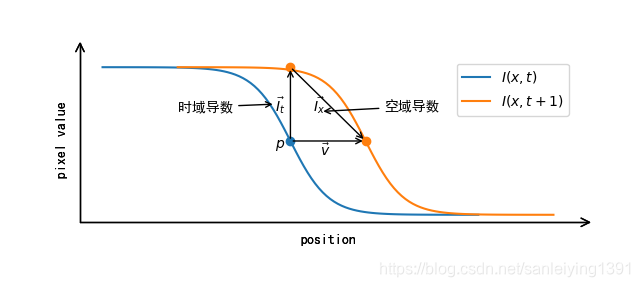
光流法原理图
双曲正切函数等于双曲正弦函数与双曲余弦函数的商.即
t
a
n
h
=
s
i
n
h
c
o
s
h
tanh =\frac{sinh}{cosh}
tanh=coshsinh
其中 s i n h ( x ) = e x − e − x 2 sinh(x)=\frac{e^{x}-e^{-x}}{2} sinh(x)=2ex−e−x, c o s h ( x ) = e x + e − x 2 cosh(x)=\frac{e^{x}+e^{-x}}{2} cosh(x)=2ex+e−x,所以 t a n h ( x ) = e x − e − x e x + e − x tanh(x)=\frac{e^{x}-e^{-x}}{e^{x}+e^{-x}} tanh(x)=ex+e−xex−e−x。
import matplotlib
import numpy as np
import math
import matplotlib.pyplot as plt
import mpl_toolkits.axisartist as axisartist

def tanh(x):
    exp_x = math.exp(x)
    exp_mx = math.exp(-x)
    deno = exp_x + exp_mx
    nume = exp_x - exp_mx
    return nume/deno

if __name__=='__main__':
    x1 = np.linspace(-5,5,100)
    x2 = x1 + 2
    # 使画布能显示汉字
    matplotlib.rcParams['font.family'] = 'SimHei'

    y = [-tanh(e) for e in x1]
    # 创建画布
    fig = plt.figure()
    # 使用axisartist.Subplot方法创建一个绘图区对象
    ax = axisartist.Subplot(fig, 211)
    # 把绘图区对象添加到画布中
    fig.add_axes(ax)
    # 通过set_axisline_style方法设置绘图区的底部及左侧坐标轴样式
    # "-|>"代表实心箭头:"->"代表空心箭头
    ax.axis["bottom"].set_axisline_style("->", size=1.5)
    ax.axis["left"].set_axisline_style("->", size=1.5)
    # 通过set_visible方法关闭上边框和右边框
    ax.axis['top'].set_visible(False)
    ax.axis['right'].set_visible(False)
    # 在画布上画箭头
    ax.annotate("", xy=(2, 0), xytext=(0, 0), arrowprops=dict(arrowstyle="->"))
    ax.annotate("", xy=(0, 1), xytext=(0, 0), arrowprops=dict(arrowstyle="->"))
    ax.annotate("", xy=(2, 0), xytext=(0, 1), arrowprops=dict(arrowstyle="->"))
    # 隐藏坐标轴刻度
    plt.xticks([])
    plt.yticks([])
    # 在画布上写字符
    plt.text(-0.4,-0.1,r'$p$')
    plt.text(0.8, -0.2, r'$\vec{v}$')
    plt.text(-0.4, 0.4, r'$\vec{I_{t}}$')
    ax.annotate("时域导数", xy=(-0.4, 0.5), xytext=(-3, 0.4), arrowprops=dict(arrowstyle="->"))
    plt.text(0.6, 0.4, r'$\vec{I_{x}}$')
    ax.annotate("空域导数", xy=(0.8, 0.4), xytext=(2.5, 0.4), arrowprops=dict(arrowstyle="->"))


    plt.xlabel('position')
    plt.ylabel('pixel value')
    plt.plot(x1,y,label=r'$I(x,t)$')
    plt.plot(x2, y, label=r'$I(x,t + 1)$')
    plt.legend()
    plt.scatter(0,0)
    plt.scatter([0,2], [1,0])

    plt.show()
运行程序,可以得到下图。


 2万+
2万+


 被折叠的 条评论
为什么被折叠?
被折叠的 条评论
为什么被折叠?
 到【灌水乐园】发言


