


任务
小组已经完成了图表管理后端接口的开发。
现在需要完成图表管理前端,对用户的图表以合适的方式进行呈现与展示。
具体流程
完善首页
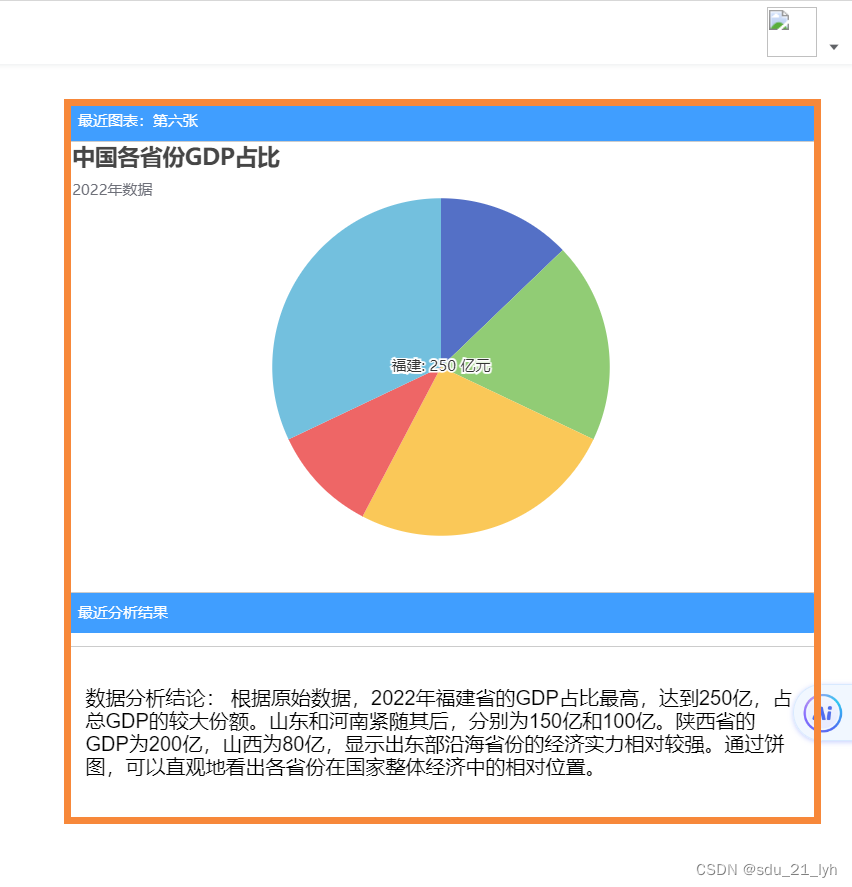
1. 在用户首页,应该展示出其最近期的图表,即在created时调用后端接口。
  created(){
    this.chartLoading=true //图表加载
    getLastChart({data:{userAccount:this.name}}).then(response=>{
      this.chartLoading=false
      let rawData=response.data.chartData
      let cleanedData = rawData.replace(/^\s*\n*\"|\"\n*\s*$/g, '');
      cleanedData = cleanedData.replace(/\s+/g, ' ');
      this.decoration=JSON.parse(cleanedData)
      if (!this.chartInstance) {
          this.chartInstance = echarts.init(this.$refs.chartContainer);
      }
      //绘制出最近的图表
      this.chartInstance.setOption(this.decoration);
      this.analyse=response.data.genResult
      this.chartName=response.data.name
    })
  },
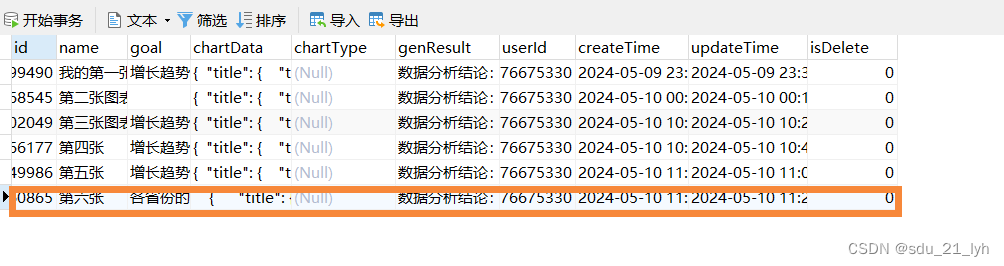
2. 每当用户上传数据进行分析的时候,后端给前端返回数据的同时,应该对本次图表信息进行保存到数据库中。
    // 提交表单
    submitForm() {
      analyseData(param).then(response=>{
          //创建新的图表逻辑
        return createChart({data:{userAccount:this.name,chartName:this.form.name,goal:this.form.necessary,genResult:this.analyse,chartData:rawData,isDelete:0}})
      })
    },
用户图表管理界面
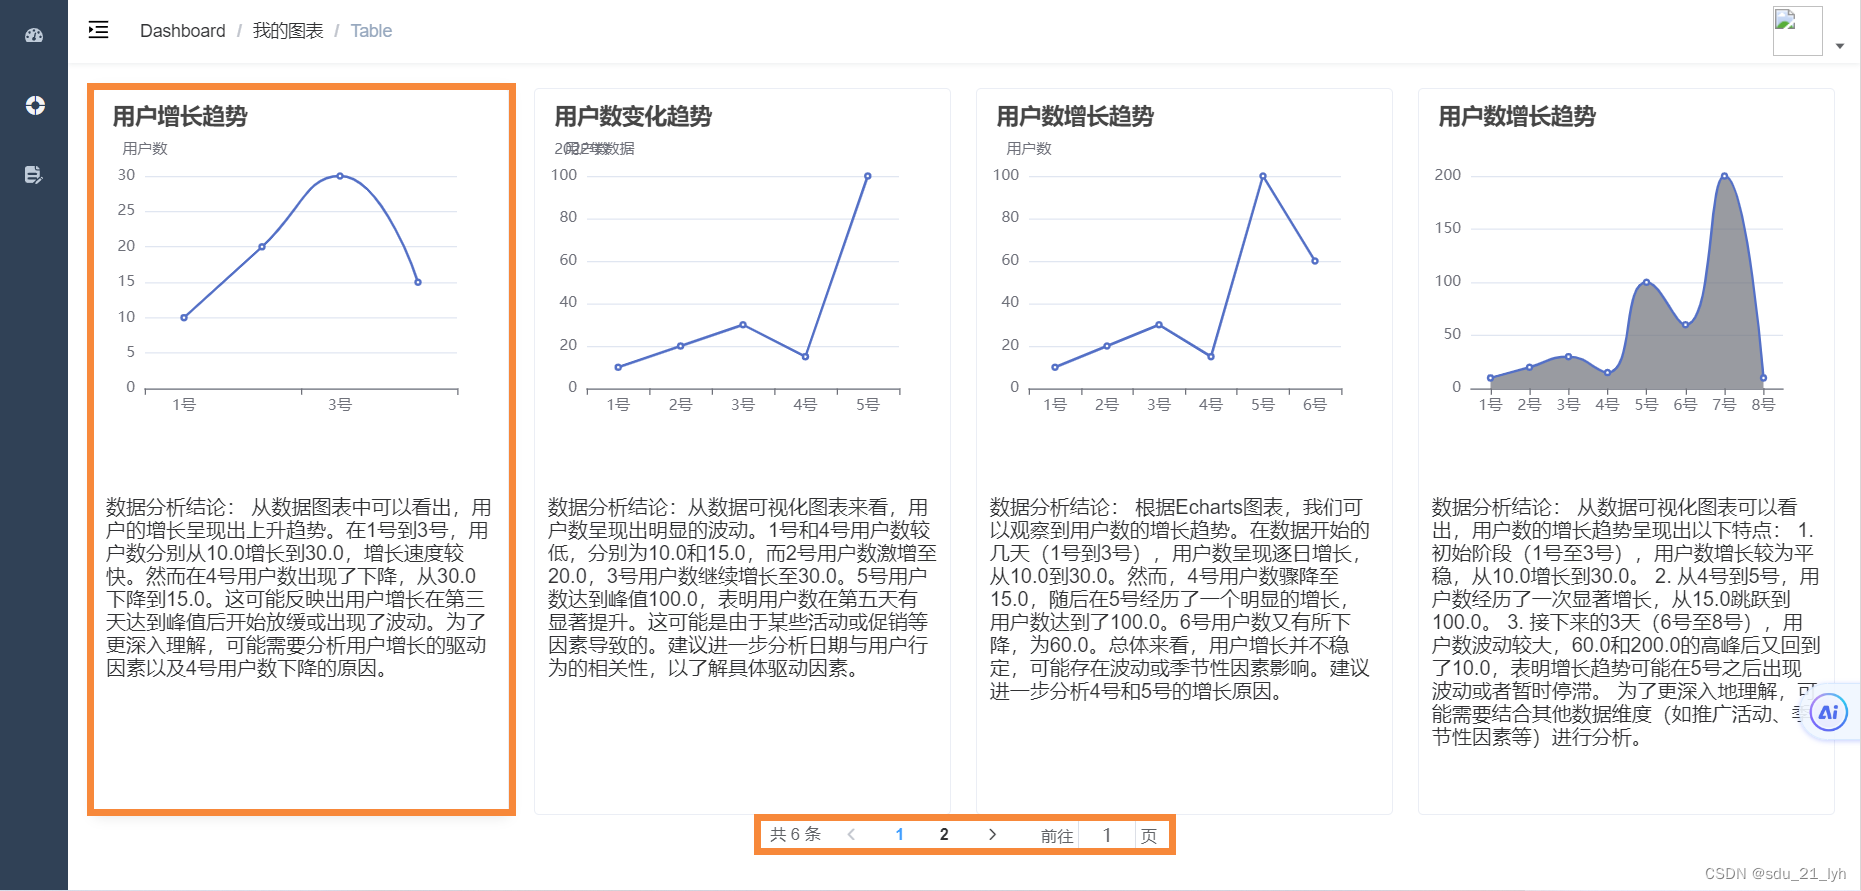
1. 由于用户的图表可能会比较多,所以采用分页展示,每页展示四个。
  data() {
    return {
      list: null,
      listLoading: true,//图表加载
      displayedCharts:[],//当前页要展示的图表信息
      decoration:null,
      currentPage:1,//当前页数
      totalNum:10//图表总数
    }
  },
2. Vue模板代码实现了一个展示图表管理页面的组件,主要由两部分构成:图表展示区域和分页导航区域。
<template>
  <div class="app-container">
  <div class="chart-management">
    <el-row :gutter="20"> <!-- 添加gutter可以设置卡片之间的间隔 -->
      <el-col :span="6" v-for="(chartData, index) in displayedCharts" :key="index"> <!-- 每个卡片占6列,共4列 -->
        <el-card
          :body-style="{ padding: '10px',height:'580px'}"
          shadow="hover"
          class="chart-card"
        >
        <div ref="chartContainer" :id="`chart-${index}`" style="width: 100%; height: 300px;"></div>
        <p>{{ chartData.genResult }}</p>
        </el-card>
     </el-col>
   </el-row>
  </div>
  <div class="pagination-text-center">
    <el-pagination
      @current-change="handleCurrentChange"
      :current-page="currentPage"
      :page-size="4"
      layout="total, prev, pager, next, jumper"
      :total="totalNum">
    </el-pagination>
  </div>
    </div>
</template>
3. 调用后端接口进行渲染。(具体参考可视化)
  created() {
      //初始化时渲染第一页
    getChartPagination({data:{userAccount:this.name,page:1}}).then(response=>{
      this.displayedCharts=response.data
      console.log(response)
      return this.initCharts()
    })
      //修改用户总图表数
    getUserChartNum({data:{userAccount:this.name}}).then(response=>{
      this.totalNum=response.data.totalCount
    })
  },

  methods: {
    initCharts() {
      this.displayedCharts.forEach((chartData, index) => {
        this.renderChart(chartData, index);
      });
    },
        //异步挂载图表
   async renderChart(chartData, index) {
      await this.$nextTick(); // 确保DOM已更新
      const chartDom = document.getElementById(`chart-${index}`);
      const chartInstance = echarts.init(chartDom);
      let rawData=chartData.chartData
      let cleanedData = rawData.replace(/^\s*\n*\"|\"\n*\s*$/g, '');
      cleanedData = cleanedData.replace(/\s+/g, ' ');
      this.decoration=JSON.parse(cleanedData)
      chartInstance.setOption(this.decoration);
    },
        //改变页数时要重新对图表进行渲染
    handleCurrentChange(newPage){
      getChartPagination({data:{userAccount:this.name,page:newPage}}).then(response=>{
      this.displayedCharts=response.data
      console.log(response)
      return this.initCharts()
    })
    }
  }
效果展示
总结
通过前端图表管理的开发,对组件生命周期管理、异步数据处理、数据驱动视图、DOM域与Echarts集成、事件处理等有了更好的掌握。


 891
891

 被折叠的 条评论
为什么被折叠?
被折叠的 条评论
为什么被折叠?
 到【灌水乐园】发言


