


 超级会员免费看
最近要看用户的执行的SPL 语句,来看资源的利用:
SPL:
index=_introspection sourcetype=splunk_resource_usage OR source=*/resource_usage.log* component=PerProcess data.search_props.sid=*
| eval sid='data.search_props.sid', user='data.search_props.user'
| bin _time span=10s
| stats dc(sid) AS distinct_search_count by _time, user
| timechart minspan=10s Max(distinct_search_count) AS "Max of search concurrency" by user
效果:
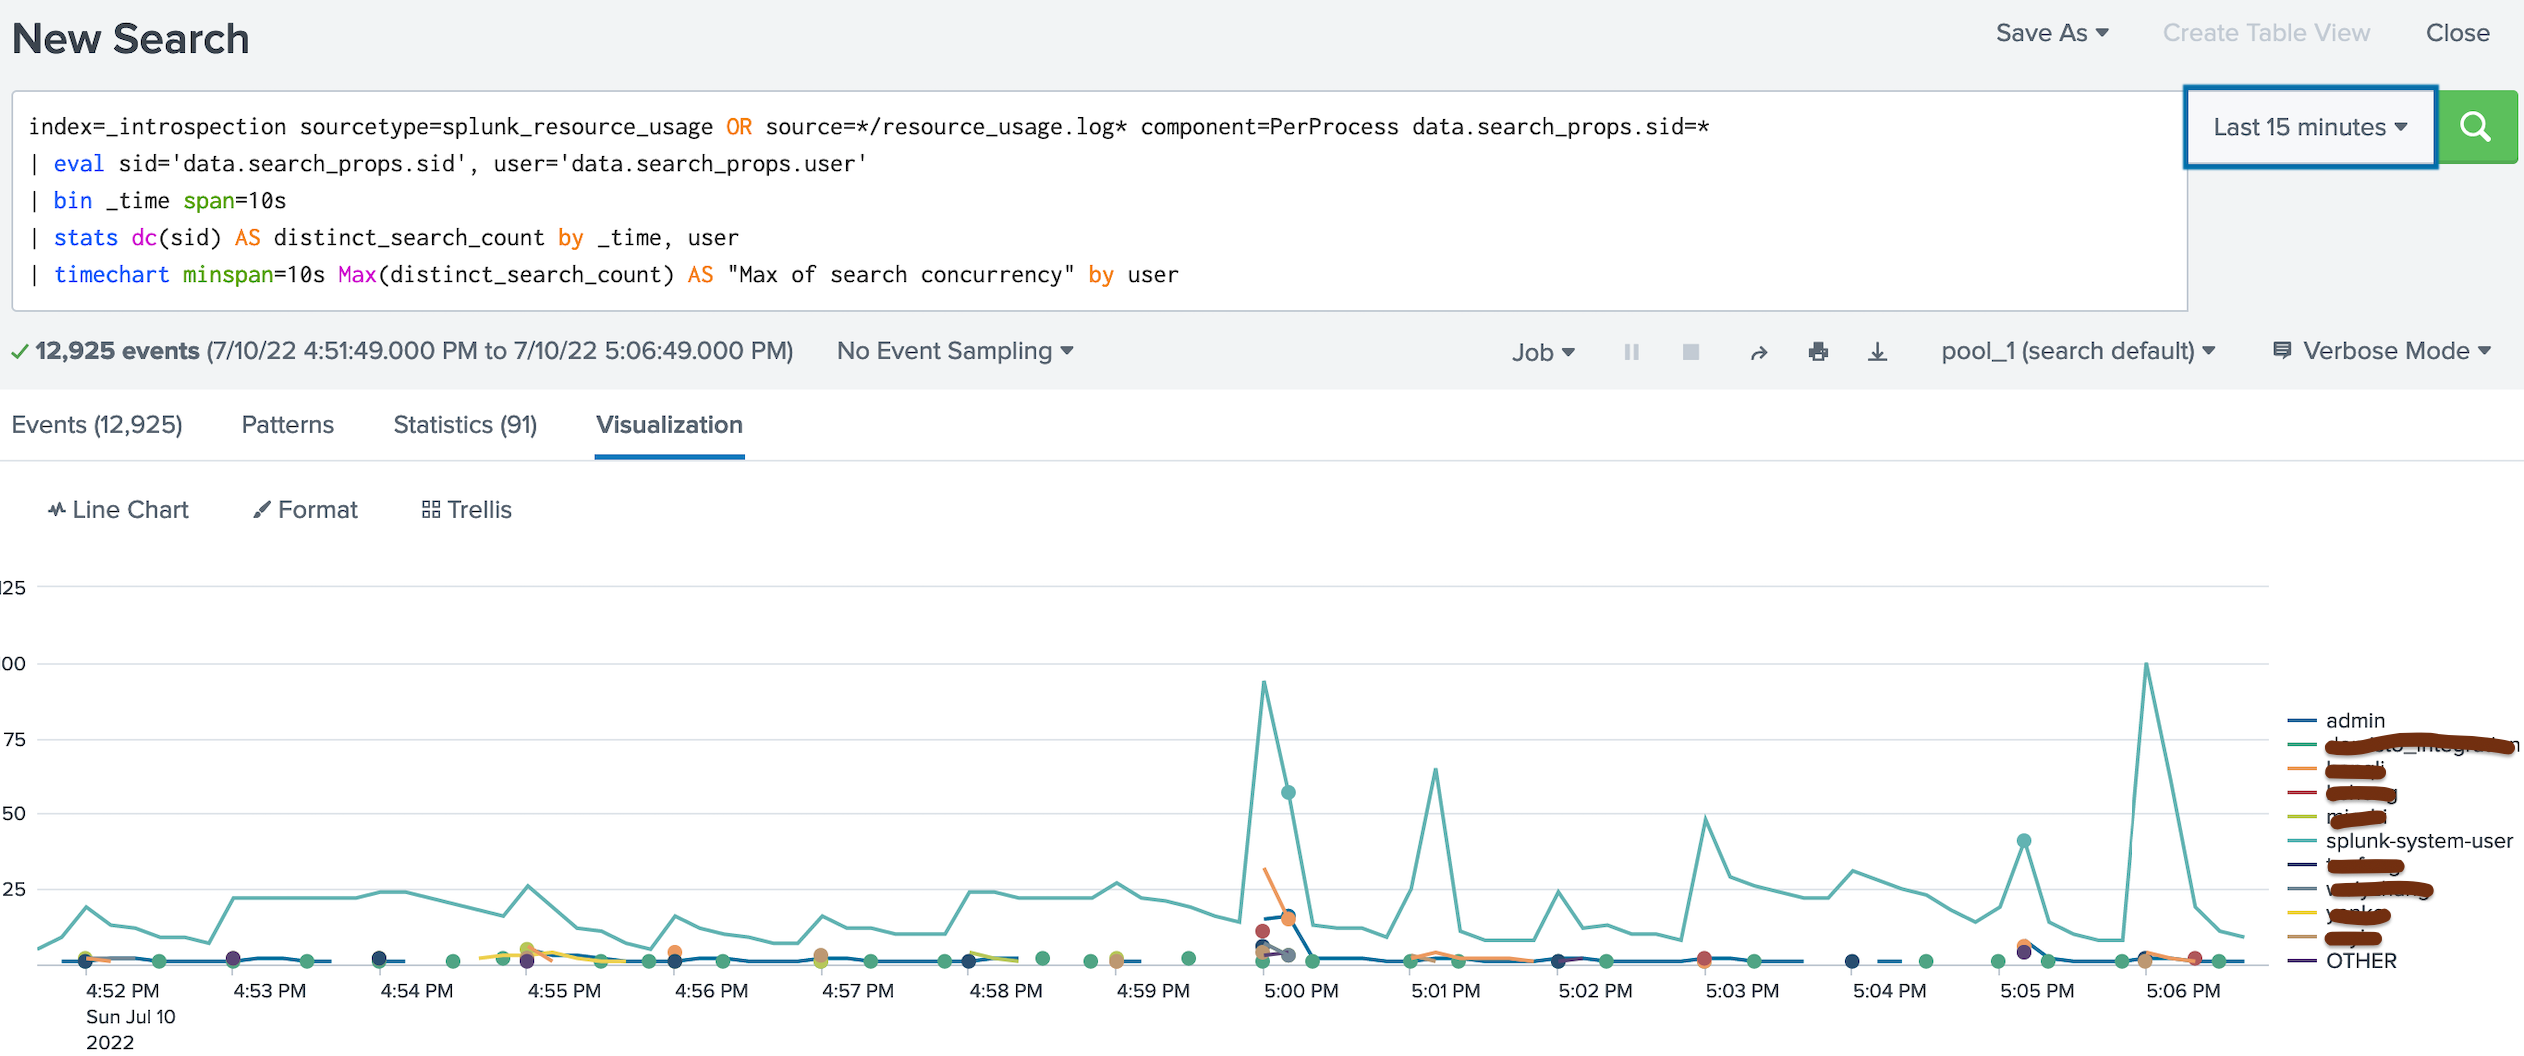
上图的右边就是执行SPL 的用户,还有时间。
当然上面还可以做monitor consol 上面看到:
1: go to search -> activities:
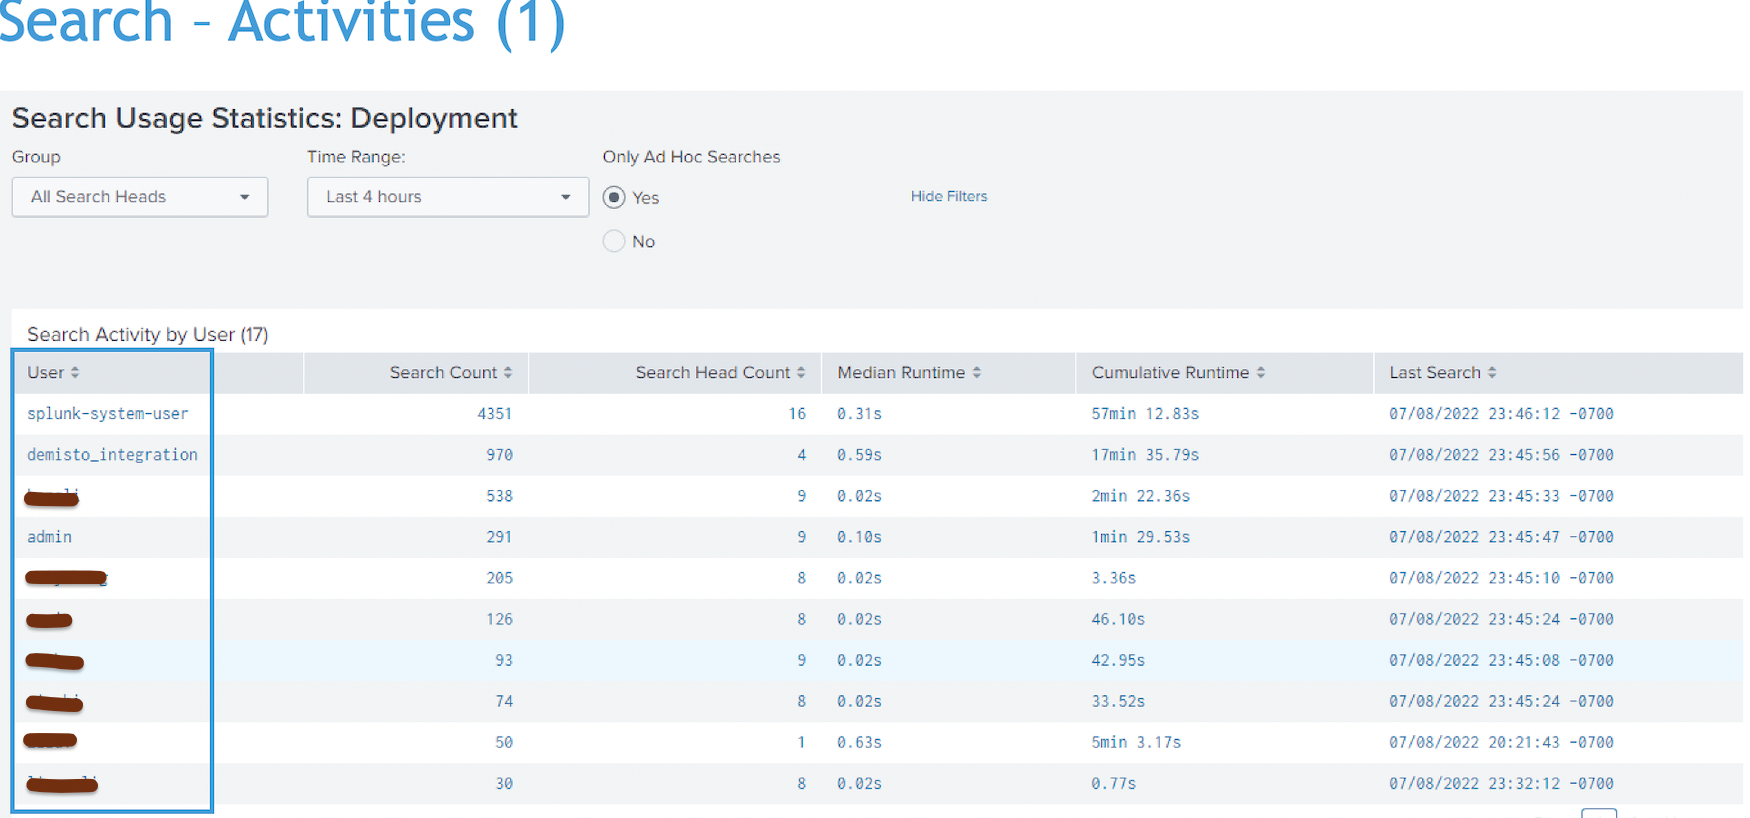
选中一个usesr 后,就可以在下面看到执行语句:
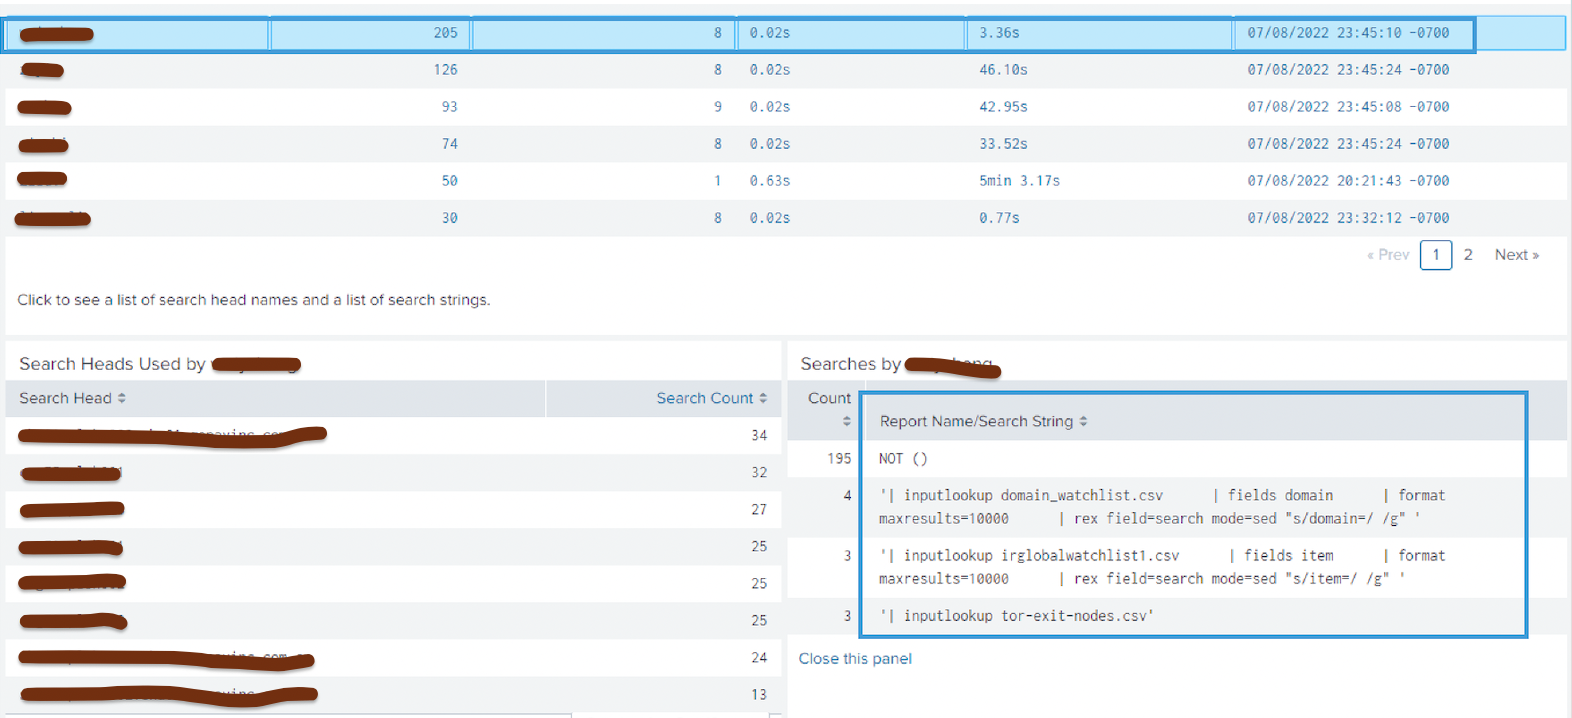
上面就说查看用户SPL的小技巧,就是查看,监控一下。


 5667
5667


 被折叠的 条评论
为什么被折叠?
被折叠的 条评论
为什么被折叠?
 到【灌水乐园】发言


