


1.Sigmoid函数简介:
图形为S形,称为S型函数,又叫压缩函数。
主要有4种:
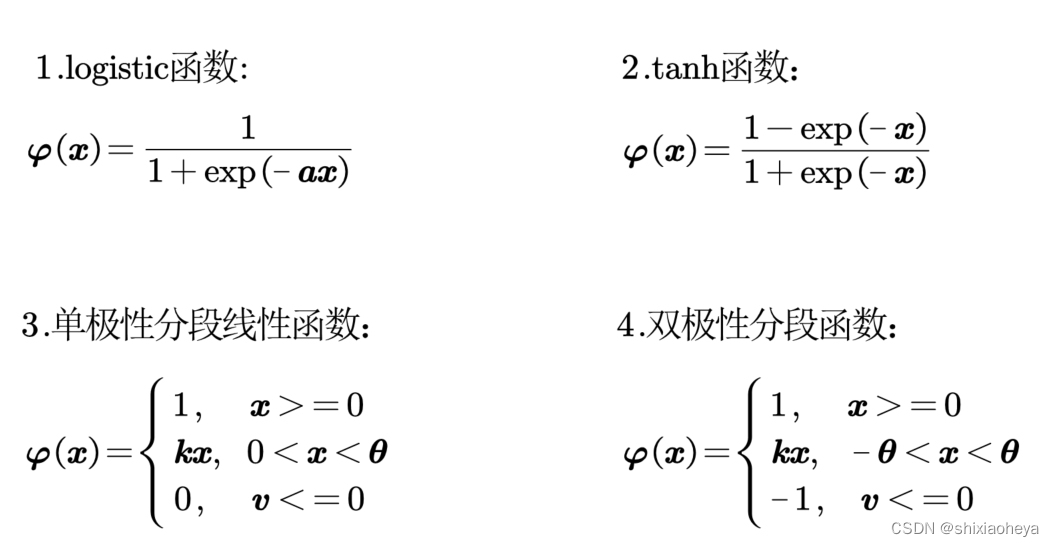
补充:默认的sigmoid函数是当a为1时的logistic函数
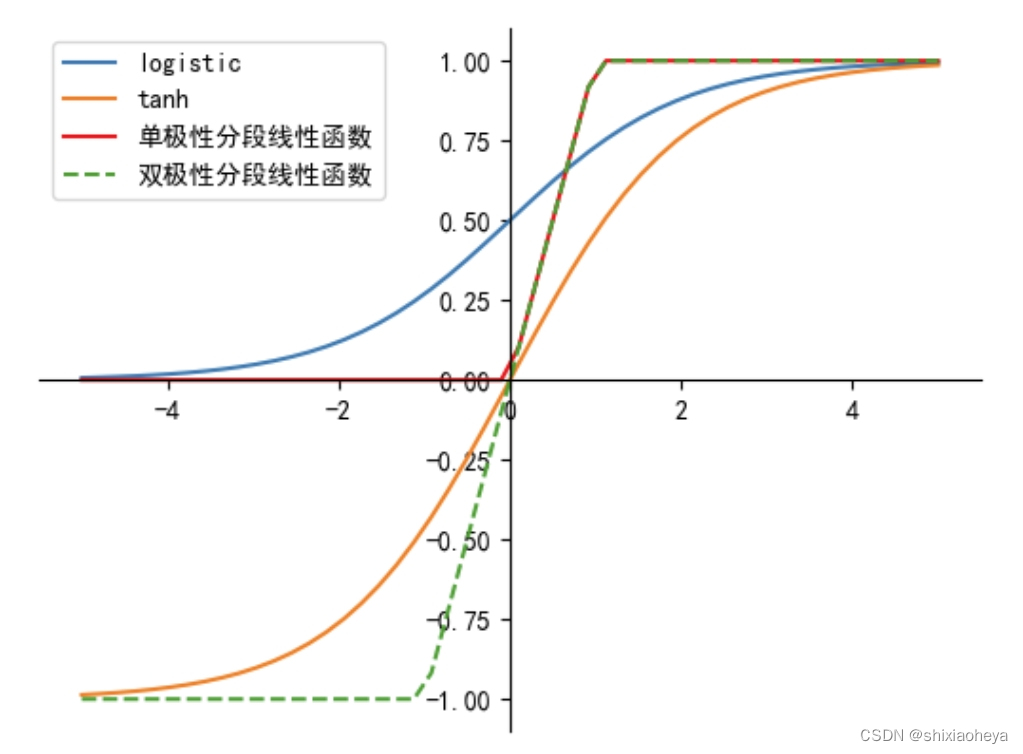
2.程序实现及绘图结果
import numpy as np
import matplotlib.pyplot as plt
plt.rcParams['font.sans-serif'] = ['SimHei'] #用来正常显示中文标签
plt.rcParams['axes.unicode_minus'] = False #用来正常显示负号

def logistic(x):
    return 1/(1+np.exp(-x))
def tanh(x):
    return ((1-np.exp(-x))/(1+np.exp(-x)))
def S1(x):
    if x>=1:
        return 1
    elif x<=0:
        return 0
    else:
        return x
def S2(x):
    if x>=1:
        return 1
    elif x<=-1:
        return -1
    else:
        return x

x = np.linspace(-5,5,50)
y1 = logistic(x)
y2 = tanh(x)
y3 = np.array([S1(i) for i in x])
y4 = np.array([S2(i) for i in x])

ax = plt.subplot(111)
ax.plot(x,y1,label='logistic')
ax.plot(x,y2,label='tanh')
ax.plot(x,y3,c='r',label='单极性分段线性函数')#和坐标轴有重合,所以将颜色设置为红
ax.plot(x,y4,linestyle='--',label='双极性分段线性函数')#和y3曲线会有重合,所以改成了虚线
plt.legend()

ax.spines['right'].set_color('none')#将图脊右侧颜色设置为无,也就是隐藏右侧图脊
ax.spines['top'].set_color('none')
ax.spines['left'].set_position('zero')#将图脊左侧起始位置设为0,也就是改变了坐标轴位置
ax.spines['bottom'].set_position('zero')

plt.show()
图形:


 1005
1005


 被折叠的 条评论
为什么被折叠?
被折叠的 条评论
为什么被折叠?
 到【灌水乐园】发言


