echart环图中间加图片

	initToolBox:function(domId){
				var level1='#66d0e3'
				var level2='#46d481'
				var level3='#b4b2ef'
				var level4='#f7bf65'
				var level5='#fdef0b'
				let that=this
				var legend=[]
				/* this.levelRows.forEach(item=>{
					legend.push(item.name)
				}) */
		        let PIE1 = echarts.init(document.getElementById(domId));
		        var option = {
	        		graphic: {
	        		     elements: [{
	        		            type: 'image',
	        		            style: {
	        		                image: '<%=path%>/oap/images/sysHomePageNew/pie-center.png',
	        		                width: 90,
	        		                height: 90
	        		            },
	        		            left:'49%',
	        		            top:'74'
	        		      }]
	        		},
		            backgroundColor: '#f4ffe1', 
		            tooltip : {
				        trigger: 'item',
				        formatter: "{a} <br/>{b} : {c} ({d}%)"
				    },
		            legend: {  
		            	orient: 'vertical',
		            	x: 'left',
		            	left:'20',
	                    top:'7%',
	                    itemGap:30,
	                    itemWidth:14,
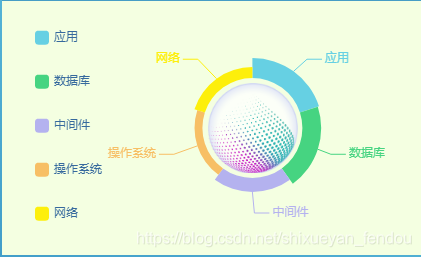
		                data:['应用','数据库','中间件','操作系统','网络'], 
		                textStyle: {
		                	color: '#36699d'
		                }
		            },
		            series: [               
		                {
			                name:'面积模式',
			                type:'pie',
			                radius : [50, 70],
			                center : ['60%', '50%'],
			                roseType : 'area',
			                color: [level1,level2,level3,level4,level5],
			                data:[{value:33, name:'应用'},
			                    {value:31, name:'数据库'},
			                    {value:23, name:'中间件'},
			                    {value:13, name:'操作系统'},
			                    {value:18, name:'网络'}]
			            }
		            ]
		        };
		        PIE1.setOption(option);
	    	}

最终图片
在这里插入图片描述

  • 0
    点赞
  • 3
    收藏
    觉得还不错? 一键收藏
  • 0
    评论
要在 ECharts 中设置地背景图片,可以使用 `geo` 组件的 `map` 属性来指定要显示的地,同时在 `geo` 组件中设置 `itemStyle` 属性来设置背景图片。 下面是一个示例代码: ```javascript option = { geo: { map: 'world', itemStyle: { normal: { areaColor: '#323c48', borderColor: '#111' } } }, series: [{ type: 'scatter', coordinateSystem: 'geo', data: [ {name: 'New York', value: [100.48, 25.03]}, {name: 'Beijing', value: [116.46, 39.92]} ], symbolSize: 10, label: { normal: { show: true, formatter: function (params) { return params.name; } } }, itemStyle: { normal: { color: '#fff' } } }] }; ``` 在上面的代码中,`geo` 组件的 `map` 属性设置为 `'world'`,表示要显示世界地。`itemStyle` 属性中设置了地的背景颜色和边框颜色。 `series` 中的 `coordinateSystem` 属性设置为 `'geo'`,表示该系列数据要使用地理坐标系。`data` 属性中设置了两个城市的经纬度,用于在地上显示散点。`label` 属性设置了显示城市名称。`itemStyle` 属性设置了散点的颜色。 如果要设置自定义的地背景图片,可以在 `itemStyle` 中使用 `image` 属性来指定图片路径,例如: ```javascript itemStyle: { normal: { areaColor: '#323c48', borderColor: '#111', image: 'https://www.example.com/map-background.jpg' } } ``` 在上面的代码中,`image` 属性指定了地背景图片的 URL 地址。请注意,为了使图片正确显示,需要确保图片的 URL 地址是有效的,并且没有跨域限制。

“相关推荐”对你有帮助么?

  • 非常没帮助
  • 没帮助
  • 一般
  • 有帮助
  • 非常有帮助
提交
评论
添加红包

请填写红包祝福语或标题

红包个数最小为10个

红包金额最低5元

当前余额3.43前往充值 >
需支付:10.00
成就一亿技术人!
领取后你会自动成为博主和红包主的粉丝 规则
hope_wisdom
发出的红包
实付
使用余额支付
点击重新获取
扫码支付
钱包余额 0

抵扣说明:

1.余额是钱包充值的虚拟货币,按照1:1的比例进行支付金额的抵扣。
2.余额无法直接购买下载,可以购买VIP、付费专栏及课程。

余额充值