


效果图如下:
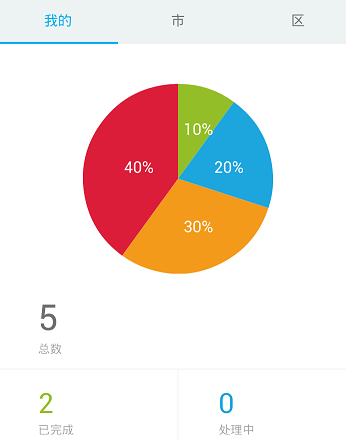
分析:
- 计算绘制的每个区域所占比例: drawArc
- 计算每个区域角平分线中点的坐标值
- 测量文字的宽度和高度,来确定文字开始绘制的位置,即BaseLine的位置
自定义PipeChartView的代码
public class PipeChartView extends View {
    public static final int DEFAULT_RADIUS_LENGTH = 80;
    public static final Point DEFAULT_POSITION = new Point(0, 0);

    private List<ValueColorEntity> data;
    private Point position = DEFAULT_POSITION;
    private int radiusLength = DEFAULT_RADIUS_LENGTH;
    private int radiusColor =Color.WHITE;


    public PipeChartView(Context context) {
        this(context, null);
    }

    public PipeChartView(Context context, AttributeSet attrs) {
        this(context, attrs, 0);
    }

    public PipeChartView(Context context, AttributeSet attrs, int defStyleAttr) {
        super(context, attrs, defStyleAttr);
    }

    @Override
    protected void onMeasure(int widthMeasureSpec, int heightMeasureSpec) {
        super.onMeasure(widthMeasureSpec, heightMeasureSpec);
        setMeasuredDimension(measureWidth(widthMeasureSpec),
                measureHeight(heightMeasureSpec));
        int width = measureWidth(widthMeasureSpec);
        int height = measureHeight(heightMeasureSpec);
        int rect = Math.min(width, height);

        // 计算圆的半径
        radiusLength = (int) ((rect / 2f) * 1.0);

        // 确定圆中心位置
        position = new Point((int) (width / 2f), (int) (height / 2f));
    }

    private int measureWidth(int measureSpec) {
        int result = 0;
        int specMode = MeasureSpec.getMode(measureSpec);
        int specSize = MeasureSpec.getSize(measureSpec);

        if (specMode == MeasureSpec.EXACTLY) { //match_parent || 固定值
            result = specSize;
        } else if (specMode == MeasureSpec.AT_MOST) { //wrap_content
            result = Math.min(result, specSize);
        }
        return result;
    }

    private int measureHeight(int measureSpec) {
        int result = 0;
        int specMode = MeasureSpec.getMode(measureSpec);
        int specSize = MeasureSpec.getSize(measureSpec);

        if (specMode == MeasureSpec.EXACTLY) {
            result = specSize;
        } else if (specMode == MeasureSpec.AT_MOST) {
            result = Math.min(result, specSize);
        }
        return result;
    }

    @Override
    protected void onDraw(Canvas canvas) {
        super.onDraw(canvas);
        drawCircle(canvas);//画圆边
        drawArc(canvas); // 画饼状区域
    }

    private void drawCircle(Canvas canvas) {
        Paint mPaintCircleBorder = new Paint();
        mPaintCircleBorder.setColor(Color.WHITE);
        mPaintCircleBorder.setStyle(Paint.Style.STROKE);
        mPaintCircleBorder.setStrokeWidth(1);
        mPaintCircleBorder.setAntiAlias(true);
        canvas.drawCircle(position.x, position.y, radiusLength, mPaintCircleBorder);
    }

    private void drawArc(Canvas canvas) {
        if (null != data) {
            float sum = 0;
            for (int i = 0; i < data.size(); i++) {
                sum = sum + data.get(i).getValue(); //算出总和
            }

            Paint mPaintFill = new Paint();
            mPaintFill.setStyle(Paint.Style.FILL);
            mPaintFill.setAntiAlias(true);

            Paint mPaintBorder = new Paint();
            mPaintBorder.setStyle(Paint.Style.STROKE);
            mPaintBorder.setColor(radiusColor);
            mPaintBorder.setAntiAlias(true);

            int offset = -90;//从竖直方向顺时针开始绘制
            drawEveryArc(canvas, sum, mPaintFill, offset);

            // 绘制显示在每个区域上方的文字
            drawText(canvas, sum, mPaintFill);
        }
    }

    private void drawText(Canvas canvas, float sum, Paint mPaintFill) {
        float sumvalue = 0f;
        for (ValueColorEntity e : data) {
            float value = e.getValue();
            sumvalue = sumvalue + value;
            float rate = (sumvalue - value / 2) / sum;
            mPaintFill.setColor(Color.BLUE);

            // 确定每个区域所占的比例
            int percentage = (int) ((value / sum * 10000) / 100f);

            //确定每个区域角平分线的中点的坐标
            float offsetX = (float) (position.x - radiusLength * 0.5
                    * Math.sin(rate * -2 * Math.PI));
            float offsetY = (float) (position.y - radiusLength * 0.5
                    * Math.cos(rate * -2 * Math.PI));

            //设置绘制画笔样式
            Paint mPaintFont = new Paint();
            mPaintFont.setColor(Color.WHITE);
            mPaintFont.setTextSize(32);
            mPaintFont.setAntiAlias(true);


            float realx = 0;
            float realy = 0;

            // 确定文字绘制的起始点BaseX的坐标= 中心点X坐标-文字的宽度/2
            if (offsetX <= position.x) {
                realx = offsetX - mPaintFont.measureText(String.valueOf(percentage)) / 2;
            } else if (offsetX > position.x) {
                realx = offsetX - mPaintFont.measureText(String.valueOf(percentage)) / 2;
            }

            //确定文字绘制的BaseY的坐标: 此处粗略计算
            if (offsetY >= position.y) {
                if (value / sum < 0.2f) {
                    realy = offsetY + 10;
                } else {
                    realy = offsetY + 5;
                }
            } else if (offsetY < position.y) {
                if (value / sum < 0.2f) {
                    realy = offsetY - 10;
                } else {
                    realy = offsetY + 5;
                }
            }


            if (percentage == 100) {
                canvas.drawText(String.valueOf(100) + "%", position.x -
                        mPaintFont.measureText(100 + "") / 2, position.y, mPaintFont);
            }

            if (percentage != 0 && percentage != 100) {
                canvas.drawText(String.valueOf(percentage) + "%", realx,
                        realy + 12, mPaintFont);
            }
        }
    }

    private void drawEveryArc(Canvas canvas, float sum, Paint mPaintFill, int offset) {
        // 遍历data集合. 绘制出每一份区域
        for (int j = 0; j < data.size(); j++) {
            ValueColorEntity e = data.get(j);

            // 获取设置的画笔颜色
            mPaintFill.setColor(e.getColor());

            //确定绘制的矩形范围
            RectF oval = new RectF(position.x - radiusLength, position.y - radiusLength,
                    position.x + radiusLength, position.y + radiusLength);
            //计算每个区域扫过的角度
            int sweep = Math.round(e.getValue() / sum * 360f);
            //绘制区域
            canvas.drawArc(oval, offset, sweep, true, mPaintFill);
            offset = offset + sweep;
        }
    }

    public void setData(List<ValueColorEntity> list) {
        this.data = list;
        invalidate();
    }}
用于设置数据和颜色的bean对象:
public class ValueColorEntity {
    private int value;

    private int Color;

    public ValueColorEntity(int value, int color) {
        this.value = value;
        Color = color;
    }

    public int getValue() {
        return value;
    }

    public int getColor() {
        return Color;
    }

    public void setValue(int value) {
        this.value = value;
    }

    public void setColor(int color) {
        Color = color;
    }
}
四. 使用自定义的控件
- xml布局:
<com.showdy.widget.PipeChartView
        android:id="@+id/my_arc_progress"
        android:layout_width="190dp"
        android:layout_height="190dp"
        android:layout_marginTop="40dp"/>
*
五.代码引用:
private List<ValueColorEntity> mDatas= new ArrayList<>();
mDatas.add(new ValueColorEntity(complete,getResources().getColor(R.color.my_order_completed)));
mDatas.add(newValueColorEntity(servicing,getResources().getColor(R.color.my_order_handling)));
mDatas.add(new ValueColorEntity(serviced,getResources().getColor(R.color.my_order_handled)));
mDatas.add(new ValueColorEntity(noaccept,getResources().getColor(R.color.my_order_unhandled)));
mPieChart.setData(mDatas);


 1534
1534

 被折叠的 条评论
为什么被折叠?
被折叠的 条评论
为什么被折叠?
 到【灌水乐园】发言


