


作者:马顺华
从事运维管理工作多年,目前就职于某科技有限公司,熟悉运维自动化、OceanBase部署运维、MySQL 运维以及各种云平台技术和产品。并已获得OceanBase认证OBCA、OBCP 证书、OpenGauss社区认证结业证书、崖山DBCA证书、亚信AntDBCA证书、翰高HDCA认证、GBase 8a|GBase 8c 证书。OceanBase & 墨天轮第二、三、四届技术征文大赛,多次获得 一、二、三 等奖,在openGauss 第五届、第六届技术征文大赛中多次获奖。时常在墨天轮发布原创技术文章,并多次被首页推荐。
引言
随着数字化时代的快速发展,数据库作为企业信息化的核心,其稳定性和性能对于企业至关重要。openGauss 6.0.0 openGauss是一款开源关系型数据库管理系统,采用木兰宽松许可证v2发行。openGauss内核深度融合华为在数据库领域多年的经验,结合企业级场景需求,持续构建竞争力特性。凭借其高性能、高可靠、高安全、易运维等特性,赢得了众多企业的青睐。本文将详细介绍openGauss 6.0.0 新版数据库的日常运维,帮助用户更好地管理和维护数据库。

一、启停 openGauss
以操作系统用户omm登录数据库主节点。
[root@worker1 ~]# su - omm
Last login: Fri May 17 16:29:59 CST 2024 on pts/0
[omm@worker1 ~]$
1、启动openGauss
使用以下命令启动openGauss。
gs_om -t start
实验示例
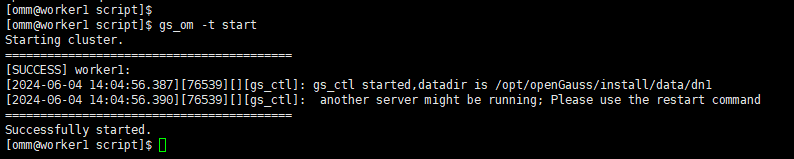
[omm@worker1 script]$ gs_om -t start
Starting cluster.
=========================================
[SUCCESS] worker1:
[2024-06-04 14:04:56.387][76539][][gs_ctl]: gs_ctl started,datadir is /opt/openGauss/install/data/dn1
[2024-06-04 14:04:56.390][76539][][gs_ctl]:  another server might be running; Please use the restart command
=========================================
Successfully started.
[omm@worker1 script]$
2、停止openGauss
以操作系统用户omm登录数据库主节点。
使用以下命令停止openGauss。
gs_om -t stop
实验示例
[omm@worker1 script]$ gs_om -t stop
Stopping cluster.
=========================================
Successfully stopped cluster.
=========================================
End stop cluster.
[omm@worker1 script]$

说明: 启停节点及AZ的操作请参见《工具与命令参考》中“服务端工具 > gs_om”章节。
3、错误排查
如果启动openGauss或者停止openGauss服务失败,请根据日志文件中的日志信息排查错误,参见日志参考。
如果是超时导致启动失败,可以执行如下命令,设置启动超时时间,默认超时时间为300s。
gs_om -t start --time-out=300
[omm@worker1 script]$ gs_om -t start --time-out=300
Starting cluster.
=========================================
[SUCCESS] worker1
2024-06-04 14:06:51.484 665eaefb.1 [unknown] 139781304941184 [unknown] 0 dn_6001 01000  0 [BACKEND] WARNING:  could not create any HA TCP/IP sockets
2024-06-04 14:06:51.484 665eaefb.1 [unknown] 139781304941184 [unknown] 0 dn_6001 01000  0 [BACKEND] WARNING:  could not create any HA TCP/IP sockets
=========================================
Successfully started.
[omm@worker1 script]$

4、日志类型参考
在数据库运行过程中,会出现大量日志,既有保证数据库安全可靠的WAL日志(预写式日志,也称为Xlog),也有用于数据库日常维护的运行和操作日志等。在数据库发生故障时,可以参考这些日志进行问题定位和数据库恢复的操作。
日志类型
日志类型的详细说明请参见下表。
| *类型* | *说明* |
|---|---|
| 系统日志 | 数据库系统进程运行时产生的日志,记录系统进程的异常信息。 |
| 操作日志 | 通过客户端工具(例如gs_guc)操作数据库时产生的日志。 |
| Trace日志 | 打开数据库的调试开关后,会记录大量的Trace日志。这些日志可以用来分析数据库的异常信息。 |
| 黑匣子日志 | 数据库系统崩溃的时候,通过故障现场堆、栈信息可以分析出故障发生时的进程上下文,方便故障定位。黑匣子具有在系统崩溃时,dump出进程和线程的堆、栈、寄存器信息的功能。 |
| 审计日志 | 开启数据库审计功能后,将数据库用户的某些操作记录在日志中,这些日志称为审计日志。 |
| WAL日志 | 又称为REDO日志,在数据库异常损坏时,可以利用WAL日志进行恢复。由于WAL日志的重要性,所以需要经常备份这些日志。 |
| 性能日志 | 数据库系统在运行时检测物理资源的运行状态的日志,在对外部资源进行访问时的性能日志,例如:磁盘、OBS等。 |
二、查看 openGauss 状态
背景信息
openGauss支持查看整个openGauss的状态,通过查询结果确认openGauss或者单个主机的运行状态是否正常。
前提条件
openGauss已经启动。
操作步骤
以操作系统用户omm登录数据库主节点。
1、使用如下命令查询openGauss状态:
[omm@worker1 script]$ gs_ctl status
[2024-06-04 14:07:34.222][77045][][gs_ctl]: gs_ctl status,datadir is /opt/openGauss/install/data/dn1
gs_ctl: server is running (PID: 76866)
/opt/openGauss/install/app/bin/gaussdb "-D" "/opt/openGauss/install/data/dn1"
[omm@worker1 script]$

2、若要查询某主机上的实例状态:
请在命令中增加“-h”项。示例如下:
[omm@worker1 script]$ gs_om -t status -h worker1
-----------------------------------------------------------------------

cluster_state             : Normal
redistributing            : No

-----------------------------------------------------------------------

node                      : 1
node_name                 : worker1
instance_id               : 6001
node_ip                   : 172.10.20.121
data_path                 : /opt/openGauss/install/data/dn1
instance_port             : 15000
type                      : Datanode
instance_state            : Normal
az_name                   : AZ1
instance_role             : Normal

-----------------------------------------------------------------------

[omm@worker1 script]$

其中,worker1为待查询主机的名称。
3、查看openGauss详细状态信息,含实例状态信息。
[omm@worker1 script]$ gs_om -t status --detail
[   Cluster State   ]

cluster_state   : Normal
redistributing  : No
current_az      : AZ_ALL

[  Datanode State   ]

    node   node_ip         port      instance                                state
--------------------------------------------------------------------------------------------------
1  worker1 172.10.20.121    15000      6001 /opt/openGauss/install/data/dn1   P Primary Normal
[omm@worker1 script]$

三、openGauss 例行维护
1、日维护检查项
1.1 检查openGauss状态
通过openGauss提供的工具查询数据库和实例状态,确认数据库和实例都处于正常的运行状态,可以对外提供数据服务。
检查实例状态
[omm@worker1 script]$ gs_check -U omm -i CheckClusterState
Parsing the check items config file successfully
Distribute the context file to remote hosts successfully
Start to health check for the cluster. Total Items:1 Nodes:1

Checking...               [=========================] 1/1
Start to analysis the check result
CheckClusterState...........................OK
The item run on 1 nodes.  success: 1

Analysis the check result successfully
Success.	All check items run completed. Total:1   Success:1
For more information please refer to /opt/openGauss/install/tool/script/gspylib/inspection/output/CheckReport_202406045113977563.tar.gz
[omm@worker1 script]$

1.2 检查锁信息
锁机制是数据库保证数据一致性的重要手段,检查相关信息可以检查数据库的事务和运行状况。
查询数据库中的锁信息
openGauss=# SELECT * FROM pg_locks;
  locktype  | database | relation | page | tuple | bucket | virtualxid | transactionid | classid | objid | objsubid | virtualtransaction |       pid       |    sessionid
|      mode       | granted | fastpath |      locktag      | global_sessionid
------------+----------+----------+------+-------+--------+------------+---------------+---------+-------+----------+--------------------+-----------------+-----------------
+-----------------+---------+----------+-------------------+------------------
 relation   |    15737 |    12191 |      |       |        |            |               |         |       |          | 10/361             | 139774354519808 | 139774354519808
| AccessShareLock | t       | t        | 3d79:2f9f:0:0:0:0 | 0:0#0
 virtualxid |          |          |      |       |        | 10/361     |               |         |       |          | 10/361             | 139774354519808 | 139774354519808
| ExclusiveLock   | t       | t        | a:169:0:0:0:7     | 0:0#0
(2 rows)

openGauss=#

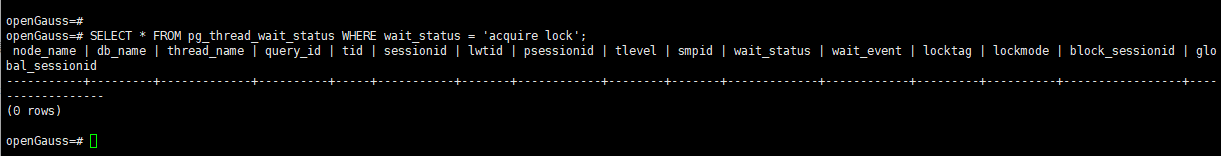
查询等待锁的线程状态信息
openGauss=#
openGauss=# SELECT * FROM pg_thread_wait_status WHERE wait_status = 'acquire lock';
 node_name | db_name | thread_name | query_id | tid | sessionid | lwtid | psessionid | tlevel | smpid | wait_status | wait_event | locktag | lockmode | block_sessionid | glo
bal_sessionid
-----------+---------+-------------+----------+-----+-----------+-------+------------+--------+-------+-------------+------------+---------+----------+-----------------+----
--------------
(0 rows)

openGauss=#
结束系统进程
查找正在运行的系统进程,然后使用kill命令结束此进程。
ps ux
kill -9 pid
1.3 统计事件数据
SQL语句长时间运行会占用大量系统资源,用户可以通过查看事件发生的时间,占用内存大小来了解现在数据库运行状态。
查询事件的时间
查询事件的线程启动时间、事务启动时间、SQL启动时间以及状态变更时间。
openGauss=#
openGauss=# SELECT backend_start,xact_start,query_start,state_change FROM pg_stat_activity;
         backend_start         |          xact_start           |          query_start          |         state_change
-------------------------------+-------------------------------+-------------------------------+-------------------------------
 2024-06-04 14:14:59.495553+08 | 2024-06-04 14:16:37.230204+08 | 2024-06-04 14:16:37.230204+08 | 2024-06-04 14:16:37.230213+08
 2024-06-04 14:06:52.221142+08 |                               |                               | 2024-06-04 14:06:52.221165+08
 2024-06-04 14:06:52.221488+08 |                               |                               | 2024-06-04 14:16:36.773155+08
 2024-06-04 14:06:52.186252+08 |                               |                               | 2024-06-04 14:06:52.21675+08
 2024-06-04 14:06:52.186624+08 |                               |                               | 2024-06-04 14:06:52.219453+08
 2024-06-04 14:06:52.174372+08 |                               |                               | 2024-06-04 14:06:52.219536+08
 2024-06-04 14:06:52.21677+08  |                               |                               | 2024-06-04 14:16:32.812367+08
 2024-06-04 14:06:52.217589+08 |                               |                               | 2024-06-04 14:16:36.872384+08
(8 rows)

openGauss=#

查询当前服务器的会话计数信息
openGauss=#
openGauss=# SELECT count(*) FROM pg_stat_activity;
 count
-------
     8
(1 row)

openGauss=#

查询系统级统计信息
查询当前使用内存最多的会话信息。
openGauss=#
openGauss=# SELECT * FROM pv_session_memory_detail() ORDER BY usedsize desc limit 10;
 sessid | threadid | contextname | level | parent | totalsize | freesize | usedsize
--------+----------+-------------+-------+--------+-----------+----------+----------
(0 rows)

openGauss=#
1.4 对象检查
表、索引、分区、约束等是数据库的核心存储对象,其核心信息和对象维护是DBA重要的日常工作。
查询表统计信息
 starelid | starelkind | staattnum | stainherit | stanullfrac | stawidth | stadistinct | stakind1 | stakind2 | stakind3 | stakind4 | stakind5 | staop1 | staop2 | staop3 | st
aop4 | staop5 |


                                       stanumbers1


                                                                           | stanumbers2 |

         stanumbers3

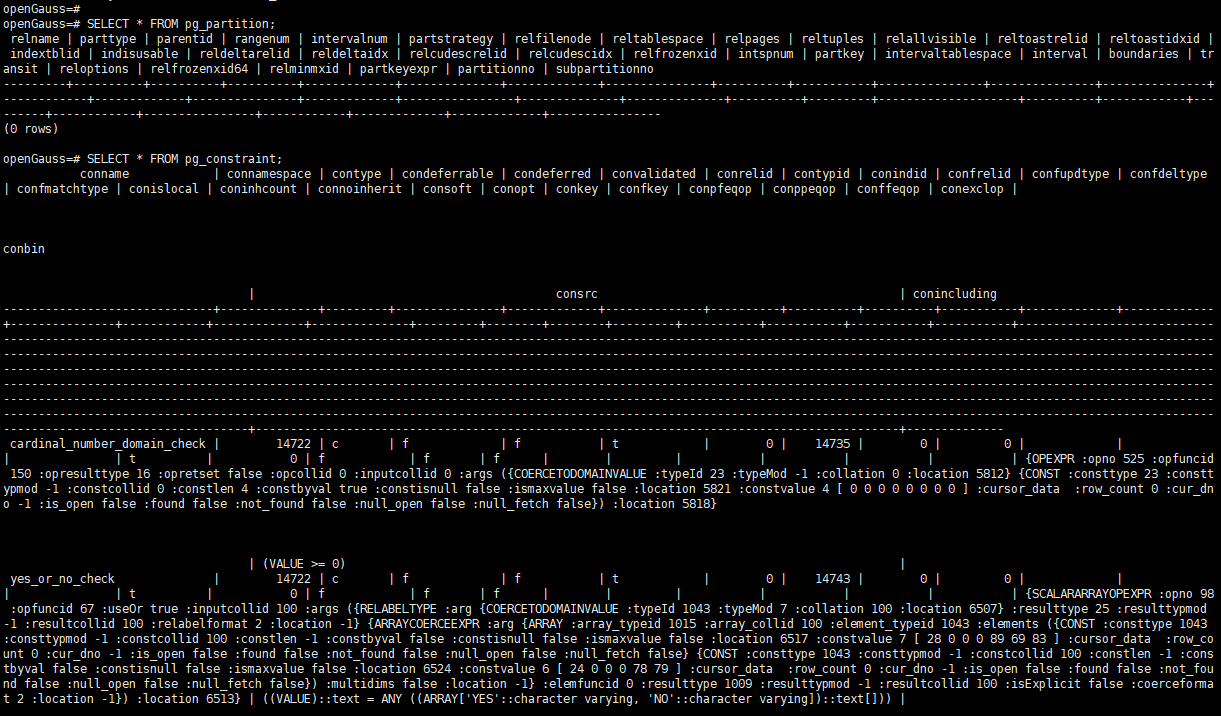
查询分区表信息
openGauss=#
openGauss=# SELECT * FROM pg_partition;
 relname | parttype | parentid | rangenum | intervalnum | partstrategy | relfilenode | reltablespace | relpages | reltuples | relallvisible | reltoastrelid | reltoastidxid |
 indextblid | indisusable | reldeltarelid | reldeltaidx | relcudescrelid | relcudescidx | relfrozenxid | intspnum | partkey | intervaltablespace | interval | boundaries | tr
ansit | reloptions | relfrozenxid64 | relminmxid | partkeyexpr | partitionno | subpartitionno
---------+----------+----------+----------+-------------+--------------+-------------+---------------+----------+-----------+---------------+---------------+---------------+
------------+-------------+---------------+-------------+----------------+--------------+--------------+----------+---------+--------------------+----------+------------+---
------+------------+----------------+------------+-------------+-------------+----------------
(0 rows)

openGauss=#
收集统计信息
使用ANALYZE语句收集数据库相关的统计信息。
使用VACUUM语句可以回收空间并更新统计信息。
查询约束信息
openGauss=# SELECT * FROM pg_partition;
 relname | parttype | parentid | rangenum | intervalnum | partstrategy | relfilenode | reltablespace | relpages | reltuples | relallvisible | reltoastrelid | reltoastidxid |
 indextblid | indisusable | reldeltarelid | reldeltaidx | relcudescrelid | relcudescidx | relfrozenxid | intspnum | partkey | intervaltablespace | interval | boundaries | tr
ansit | reloptions | relfrozenxid64 | relminmxid | partkeyexpr | partitionno | subpartitionno
---------+----------+----------+----------+-------------+--------------+-------------+---------------+----------+-----------+---------------+---------------+---------------+
------------+-------------+---------------+-------------+----------------+--------------+--------------+----------+---------+--------------------+----------+------------+---
------+------------+----------------+------------+-------------+-------------+----------------
(0 rows)

openGauss=# SELECT * FROM pg_constraint;
           conname            | connamespace | contype | condeferrable | condeferred | convalidated | conrelid | contypid | conindid | confrelid | confupdtype | confdeltype
| confmatchtype | conislocal | coninhcount | connoinherit | consoft | conopt | conkey | confkey | conpfeqop | conppeqop | conffeqop | conexclop |

conbin


                                   |                                           consrc                                           | conincluding
------------------------------+--------------+---------+---------------+-------------+--------------+----------+----------+----------+-----------+-------------+-------------
+---------------+------------+-------------+--------------+---------+--------+--------+---------+-----------+-----------+-----------+-----------+----------------------------
-----------------------------------------------------------------------------------------------------------------------------------------------------------------------------
-----------------------------------------------------------------------------------------------------------------------------------------------------------------------------
-----------------------------------------------------------------------------------------------------------------------------------------------------------------------------
-----------------------------------------------------------------------------------------------------------------------------------------------------------------------------
-----------------------------------------------------------------------------------------------------------------------------------------------------------------------------
-----------------------------------------------------------------------------------------------------------------------------------------------------------------------------
-----------------------------------+--------------------------------------------------------------------------------------------+--------------
 cardinal_number_domain_check |        14722 | c       | f             | f           | t            |        0 |    14735 |        0 |         0 |             |
|               | t          |           0 | f            | f       | f      |        |         |           |           |           |           | {OPEXPR :opno 525 :opfuncid
 150 :opresulttype 16 :opretset false :opcollid 0 :inputcollid 0 :args ({COERCETODOMAINVALUE :typeId 23 :typeMod -1 :collation 0 :location 5812} {CONST :consttype 23 :constt
ypmod -1 :constcollid 0 :constlen 4 :constbyval true :constisnull false :ismaxvalue false :location 5821 :constvalue 4 [ 0 0 0 0 0 0 0 0 ] :cursor_data  :row_count 0 :cur_dn
o -1 :is_open false :found false :not_found false :null_open false :null_fetch false}) :location 5818}


                                   | (VALUE >= 0)                                                                               |
 yes_or_no_check              |        14722 | c       | f             | f           | t            |        0 |    14743 |        0 |         0 |             |
|               | t          |           0 | f            | f       | f      |        |         |           |           |           |           | {SCALARARRAYOPEXPR :opno 98
 :opfuncid 67 :useOr true :inputcollid 100 :args ({RELABELTYPE :arg {COERCETODOMAINVALUE :typeId 1043 :typeMod 7 :collation 100 :location 6507} :resulttype 25 :resulttypmod
-1 :resultcollid 100 :relabelformat 2 :location -1} {ARRAYCOERCEEXPR :arg {ARRAY :array_typeid 1015 :array_collid 100 :element_typeid 1043 :elements ({CONST :consttype 1043
:consttypmod -1 :constcollid 100 :constlen -1 :constbyval false :constisnull false :ismaxvalue false :location 6517 :constvalue 7 [ 28 0 0 0 89 69 83 ] :cursor_data  :row_co
unt 0 :cur_dno -1 :is_open false :found false :not_found false :null_open false :null_fetch false} {CONST :consttype 1043 :consttypmod -1 :constcollid 100 :constlen -1 :cons
tbyval false :constisnull false :ismaxvalue false :location 6524 :constvalue 6 [ 24 0 0 0 78 79 ] :cursor_data  :row_count 0 :cur_dno -1 :is_open false :found false :not_fou
nd false :null_open false :null_fetch false}) :multidims false :location -1} :elemfuncid 0 :resulttype 1009 :resulttypmod -1 :resultcollid 100 :isExplicit false :coerceforma
t 2 :location -1}) :location 6513} | ((VALUE)::text = ANY ((ARRAY['YES'::character varying, 'NO'::character varying])::text[])) |
1.5 备份
数据备份重于一切,日常应检查备份执行情况,并检查备份有效性,确保备份能够保障数据安全,备份安全加密也应兼顾。
指定用户导出数据库
[omm@worker1 script]$ gs_dump postgres -p 15000 -f out.sql -U omm -W password
gs_dump[port='15000'][postgres][2024-06-04 14:30:29]: Begin scanning database.
Progress: [==================================================] 100% (38/37, cur_step/total_step). finish scanning database
gs_dump[port='15000'][postgres][2024-06-04 14:30:29]: Finish scanning database.
gs_dump[port='15000'][postgres][2024-06-04 14:30:30]: Start dumping objects
Progress: [==================================================] 100% (4825/4825, dumpObjNums/totalObjNums). dump objects
gs_dump[port='15000'][postgres][2024-06-04 14:30:30]: Finish dumping objects
gs_dump[port='15000'][postgres][2024-06-04 14:30:30]: dump database postgres successfully
gs_dump[port='15000'][postgres][2024-06-04 14:30:30]: total time: 141  ms
[omm@worker1 script]$

1.6 基本信息检查
基本信息包括版本、组件、补丁集等信息,定期检查数据库信息并登记在案是数据库生命周期管理的重要内容之一。
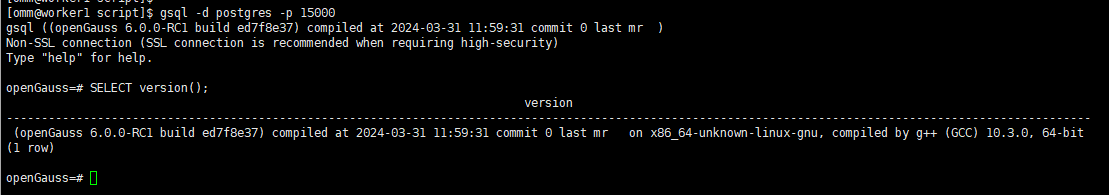
版本信息
[omm@worker1 script]$ gsql -d postgres -p 15000
gsql ((openGauss 6.0.0-RC1 build ed7f8e37) compiled at 2024-03-31 11:59:31 commit 0 last mr  )
Non-SSL connection (SSL connection is recommended when requiring high-security)
Type "help" for help.

openGauss=# SELECT version();
                                                                          version
-----------------------------------------------------------------------------------------------------------------------------------------------------------
 (openGauss 6.0.0-RC1 build ed7f8e37) compiled at 2024-03-31 11:59:31 commit 0 last mr   on x86_64-unknown-linux-gnu, compiled by g++ (GCC) 10.3.0, 64-bit
(1 row)

openGauss=#
2、检查操作系统参数
检查办法
通过openGauss提供的gs_checkos工具可以完成操作系统状态检查。
只能使用root用户执行gs_checkos命令。
以root用户身份登录任意一台服务器。
执行如下命令对openGauss节点服务器的OS参数进行检查。
gs_checkos -i A
检查节点服务器的OS参数的目的是保证openGauss正常通过预安装,并且在安装成功后可以安全高效的运行。详细的检查项目请参见《工具与命令参考》中“服务端工具 > gs_checkos”章节。
实验示例:
执行gs_checkos前需要先使用gs_preinstall工具执行前置脚本,准备环境。以参数“A”为例。
[root@worker1 script]# ./gs_checkos -i A
Checking items:
    A1. [ OS version status ]                                   : Normal
    A2. [ Kernel version status ]                               : Normal
    A3. [ Unicode status ]                                      : Normal
    A4. [ Time zone status ]                                    : Normal
    A5. [ Swap memory status ]                                  : Normal
    A6. [ System control parameters status ]                    : Warning
    A7. [ File system configuration status ]                    : Warning
    A8. [ Disk configuration status ]                           : Normal
    A9. [ Pre-read block size status ]                          : Normal
    A10.[ IO scheduler status ]                                 : Normal
    A11.[ Network card configuration status ]                   : Warning
    A12.[ Time consistency status ]                             : Warning
    A13.[ Firewall service status ]                             : Normal
    A14.[ THP service status ]                                  : Normal
Total numbers:14. Abnormal numbers:0. Warning numbers:4.
[root@worker1 script]#

[root@worker1 script]# ./gs_checkos -i B
Setting items:
    B1. [ Set system control parameters ]                       : Normal
    B2. [ Set file system configuration value ]                 : Normal
    B3. [ Set pre-read block size value ]                       : Normal
    B4. [ Set IO scheduler value ]                              : Normal
    B5. [ Set network card configuration value ]                : Normal
    B6. [ Set THP service ]                                     : Normal
    B7. [ Set RemoveIPC value ]                                 : Normal
    B8. [ Set Session Process ]                                 : Normal
NOTICE: MTU value and some warning items can NOT be set. Please do it manually.
Total numbers:8. Abnormal numbers:0. Warning numbers:0.
[root@worker1 script]#

3、检查openGauss健康状态
检查办法
通过openGauss提供的gs_check工具可以开展openGauss健康状态检查。
扩容新节点检查只能在root用户下执行,其他场景都必须在omm用户下执行。
必须指定-i或-e参数,-i会检查指定的单项,-e会检查对应场景配置中的多项。
如果-i参数中不包含root类检查项或-e场景配置列表中没有root类检查项,则不需要交互输入root权限的用户及其密码。
可使用–skip-root-items跳过检查项中包含的root类检查,以免需要输入root权限用户及密码。
检查扩容新节点与现有节点之间的一致性,在现有节点执行gs_check命令指定–hosts参数进行检查,其中hosts文件中需要写入新节点ip。
方式1:
以操作系统用户omm登录数据库主节点。
执行如下命令对openGauss数据库状态进行检查。
[root@worker1 script]# su - omm
上一次登录:二 6月  4 12:08:50 CST 2024pts/0 上
[omm@worker1 ~]$ cd /soft/script/
[omm@worker1 script]$ gs_check -i CheckClusterState
Parsing the check items config file successfully
Distribute the context file to remote hosts successfully
Start to health check for the cluster. Total Items:1 Nodes:1

Checking...               [=========================] 1/1
Start to analysis the check result
CheckClusterState...........................OK
The item run on 1 nodes.  success: 1

Analysis the check result successfully
Success.	All check items run completed. Total:1   Success:1
For more information please refer to /opt/openGauss/install/tool/script/gspylib/inspection/output/CheckReport_202406045258581071.tar.gz
[omm@worker1 script]$

其中,-i指定检查项,注意区分大小写。格式:-i CheckClusterState、-i CheckCPU或-i CheckClusterState,CheckCPU。
取值范围为所有支持的检查项名称,详细列表请参见《工具与命令参考》中“服务端工具 > gs_checkos > openGauss状态检查表”,用户可以根据需求自己编写新检查项。
方式2:
以操作系统用户omm登录数据库主节点。
执行如下命令对openGauss数据库进行健康检查。
[omm@worker1 script]$ ./gs_check -e inspect
Parsing the check items config file successfully
The below items require root privileges to execute:[CheckBlockdev CheckIOrequestqueue CheckIOConfigure CheckMTU CheckRXTX CheckMultiQueue CheckFirewall CheckSshdService CheckSshdConfig CheckCrondService CheckMaxProcMemory CheckBootItems CheckFilehandle CheckNICModel CheckDropCache]
Please enter root privileges user[root]:root
Please enter password for user[root]:
Check root password connection successfully
Distribute the context file to remote hosts successfully
Start to health check for the cluster. Total Items:57 Nodes:1

Checking...               [=========================] 57/57
Start to analysis the check result
CheckClusterState...........................OK
The item run on 1 nodes.  success: 1

CheckDBParams...............................OK
The item run on 1 nodes.  success: 1

CheckDebugSwitch............................OK
The item run on 1 nodes.  success: 1

CheckDirPermissions.........................NG
The item run on 1 nodes.  ng: 1

其中,-e指定场景名,注意区分大小写。格式:-e inspect或-e upgrade。
取值范围为所有支持的巡检场景名称,默认列表包括:inspect(例行巡检)、upgrade(升级前巡检)、install(安装)、binary_upgrade(就地升级前巡检)、health(健康检查巡检)、slow_node(节点)、longtime(耗时长巡检),用户可以根据需求自己编写场景。
openGauss巡检的主要作用是在openGauss运行过程中,检查整个openGauss状态是否正常,或者重大操作前(升级、扩容),确保openGauss满足操作所需的环境条件和状态条件。详细的巡检项目和场景请参见《工具与命令参考》中“服务端工具 > gs_checkos > openGauss状态检查表”。
实验示例:
执行单项检查结果:
[omm@worker1 script]$ gs_check -i CheckCPU
Parsing the check items config file successfully
Distribute the context file to remote hosts successfully
Start to health check for the cluster. Total Items:1 Nodes:1

Checking...               [=========================] 1/1
Start to analysis the check result
CheckCPU....................................OK
The item run on 1 nodes.  success: 1

Analysis the check result successfully
Success.	All check items run completed. Total:1   Success:1
For more information please refer to /opt/openGauss/install/tool/script/gspylib/inspection/output/CheckReport_202406045339389877.tar.gz
[omm@worker1 script]$

本地执行结果:
[omm@worker1 script]$ gs_check -i CheckCPU -L

2024-06-04 14:50:42 [NAM] CheckCPU
2024-06-04 14:50:42 [STD] 检查主机CPU占用率,如果idle 大于30%,或者 iowait 小于 30%.则检查项通过,否则检查项不通过
2024-06-04 14:50:42 [RST] OK

2024-06-04 14:50:42 [RAW]
Linux 3.10.0-693.el7.x86_64 (worker1) 	06/04/24 	_x86_64_	(8 CPU)

14:50:37        CPU     %user     %nice   %system   %iowait    %steal     %idle
14:50:38        all      0.63      0.00      0.00      0.00      0.00     99.37
14:50:39        all      0.62      0.00      0.12      0.00      0.00     99.25
14:50:40        all      0.62      0.00      0.12      0.00      0.00     99.25
14:50:41        all      0.63      0.00      0.00      0.00      0.00     99.37
14:50:42        all      0.62      0.00      0.12      0.00      0.00     99.25
Average:        all      0.63      0.00      0.08      0.00      0.00     99.30

[omm@worker1 script]$

执行场景检查结果:
[omm@worker1 script]$ gs_check -e inspect
Parsing the check items config file successfully
The below items require root privileges to execute:[CheckBlockdev CheckIOrequestqueue CheckIOConfigure CheckMTU CheckRXTX CheckMultiQueue CheckFirewall CheckSshdService CheckSshdConfig CheckCrondService CheckMaxProcMemory CheckBootItems CheckFilehandle CheckNICModel CheckDropCache]
Please enter root privileges user[root]:root
Please enter password for user[root]:
Check root password connection successfully
Distribute the context file to remote hosts successfully
Start to health check for the cluster. Total Items:57 Nodes:1

Checking...               [=========================] 57/57
Start to analysis the check result
CheckClusterState...........................OK
The item run on 1 nodes.  success: 1

CheckDBParams...............................OK
The item run on 1 nodes.  success: 1

CheckDebugSwitch............................OK
The item run on 1 nodes.  success: 1

CheckDirPermissions.........................NG
The item run on 1 nodes.  ng: 1
The ng[worker1] value:

4、检查数据库性能
通过openGauss提供的性能统计工具gs_checkperf可以对硬件性能进行检查。
以操作系统用户omm登录数据库主节点。
执行如下命令对openGauss数据库进行性能检查。
[omm@worker1 script]$ gs_checkperf
Cluster statistics information:
    Host CPU busy time ratio                     :    .24        %
    MPPDB CPU time % in busy time                :    .04        %
    Shared Buffer Hit ratio                      :    97.10      %
    In-memory sort ratio                         :    0
    Physical Reads                               :    1437
    Physical Writes                              :    22
    DB size                                      :    51         MB
    Total Physical writes                        :    22
    Active SQL count                             :    4
    Session count                                :    8
[omm@worker1 script]$

具体的性能统计项目请参见《工具与命令参考》中“服务端工具 > gs_checkperf > 性能检查项”。
实验示例:
以简要格式在屏幕上显示性能统计结果。
[omm@worker1 script]$ gs_checkperf -i pmk -U omm
Cluster statistics information:
    Host CPU busy time ratio                     :    .24        %
    MPPDB CPU time % in busy time                :    .04        %
    Shared Buffer Hit ratio                      :    97.97      %
    In-memory sort ratio                         :    0
    Physical Reads                               :    1451
    Physical Writes                              :    155
    DB size                                      :    51         MB
    Total Physical writes                        :    155
    Active SQL count                             :    4
    Session count                                :    8
[omm@worker1 script]$

5、检查和清理日志
日志是检查系统运行及故障定位的关键手段。建议按月度例行查看操作系统日志及数据库的运行日志。同时,随着时间的推移,日志的增加会占用较多的磁盘空间。建议按月度清理数据库的运行日志。
5.1 检查操作系统日志
建议按月检查操作系统日志,排除操作系统运行异常隐患。
执行如下命令查看操作系统日志文件。
[root@worker1 script]# vim /var/log/messages

关注其中近一个月出现的kernel、error、fatal等字样,根据系统报警信息进行处理。
5.2 检查openGauss运行日志
数据库运行时,某些操作在执行过程中可能会出现错误,数据库依然能够运行。但是此时数据库中的数据可能已经发生不一致的情况。建议按月检查openGauss运行日志,及时发现隐患。
以操作系统用户omm登录数据库主节点。
执行如下命令收集数据库日志。
gs_collector --begin-time="20240604 01:01" --end-time="20240604 23:59"
[omm@worker1 script]$ gs_collector --begin-time="20240604 01:01" --end-time="20240604 23:59"
Successfully parsed the configuration file.
create Dir.
Successfully create dir.
do System check 0:1
Collecting OS information.
Successfully collected OS information.
do Database check 0:1
Collecting catalog statistics.
Successfully collected catalog statistics.
do not enable dss, cannot collect dss config files
do not enable dss, cannot collect dss disk info
do Log check 0:1
Collecting Log files.
The cmd is source /soft/script/ENVFILE; python3 '/opt/openGauss/install/tool/script/local/LocalCollect.py' -t log_copy -U omm -b '202406040101' -e '202406042359' -k '' -l /opt/openGauss/install/log/omm/om/gs_local.log -s 1048576 -S 0 -C '{#TypeName#: #Log#, #Content#: #DN,cm,om,bin,DSS,DMS,#, #Interval#: #0#, #Count#: #1#, #FileNumber#: #0#}'
Failed collected Log files.
do Config check 0:1
Collecting Config files.
Successfully collected Config files.
Collecting files.
Successfully collected files.
All results are stored in /opt/openGauss/install/log/omm/collector_20240604_220848.tar.gz.
[omm@worker1 script]$

20240604 01:01为日志的开始时间,20240604 23:59为日志的结束时间。
根据界面输出提示,进入相应的日志收集目录,解压收集的日志,并检查数据库日志。
以下以日志收集路径“/opt/openGauss/install/log/omm/collector_20240604_220848.tar.gz”为例进行操作。
[omm@worker1 omm]$ tar -xvzf /opt/openGauss/install/log/omm/collector_20240604_220848.tar.gz
collector_20240604_220848/
collector_20240604_220848/Detail.log
collector_20240604_220848/worker1.tar.gz
collector_20240604_220848/Summary.log
[omm@worker1 omm]$ cd /opt/openGauss/install/log/omm/collector_20240604_220848
[omm@worker1 collector_20240604_220848]$ ls
Detail.log  Summary.log  worker1.tar.gz
[omm@worker1 collector_20240604_220848]$

5.3 清理运行日志
数据库运行过程中会产生大量运行日志,占用大量的磁盘空间,建议清理过期日志文件,只保留一个月的日志。
操作步骤
以操作系统用户omm登录数据库主节点。
清理日志。
a. 将超过1个月的日志备份到其他磁盘。
b. 进入日志存放目录。
[omm@worker1 script]$ cd $GAUSSLOG
[omm@worker1 omm]$ ls
asp_data  cm                         collector_20240604_220848.tar.gz  mem_log  pg_audit  pg_perf
bin       collector_20240604_220848  gs_profile                        om       pg_log    sql_monitor
[omm@worker1 omm]$

c. 进入相应的子目录,使用如下方式删除1个月之前产生的日志。
rm 日志名称
日志文件的命名格式为“postgresql-年-月-日_HHMMSS”。
[omm@worker1 omm]$ rm -rf collector_20240604_220848
7、检查应用连接数
如果应用程序与数据库的连接数超过最大值,则新的连接无法建立。建议每天检查连接数,及时释放空闲的连接或者增加最大连接数。
操作步骤
以操作系统用户omm登录数据库主节点。
使用如下命令连接数据库。
gsql -d postgres -p 15000
postgres为需要连接的数据库名称,1500为数据库主节点的端口号。
连接成功后,系统显示类似如下信息:
[omm@worker1 omm]$
[omm@worker1 omm]$ gsql -d postgres -p 15000
gsql ((openGauss 6.0.0-RC1 build ed7f8e37) compiled at 2024-03-31 11:59:31 commit 0 last mr  )
Non-SSL connection (SSL connection is recommended when requiring high-security)
Type "help" for help.

openGauss=#

执行如下SQL语句查看连接数。
openGauss=# SELECT count(*) FROM (SELECT pg_stat_get_backend_idset() AS backendid) AS s;
显示类似如下的信息,其中2表示当前有两个应用连接到数据库。
openGauss=#
openGauss=# SELECT count(*) FROM (SELECT pg_stat_get_backend_idset() AS backendid) AS s;
 count
-------
    20
(1 row)

openGauss=#

查看现有最大连接数。
openGauss=# SHOW max_connections;
显示信息如下,其中200为现在的最大连接数。
openGauss=#
openGauss=# SHOW max_connections;
 max_connections
-----------------
 5000
(1 row)

openGauss=#

四、数据安全维护建议
为保证openGauss数据库中的数据安全,避免丢失数据、非法访问数据等事故发生,请仔细阅读以下内容。
1、避免数据被丢失
建议用户规划周期性的物理备份,且对备份文件进行可靠的保存。在系统发生严重错误的情况下,可以利用备份文件,将系统恢复到备份前的状态。
2、避免数据被非法访问
建议对数据库用户进行权限分级管理。数据库管理员根据业务需要,建立用户并赋予权限,保证各用户对数据库的合理访问。
对于openGauss的服务端和客户端(或基于客户端库开发的应用程序),最好也部署在可信任的内网中。如果服务端和客户端一定要部署在非信任的网络中,需要在服务启动前,打开SSL加密,保证数据在非信任网络上的传输安全。需要注意的是,打开SSL加密会降低数据库的性能。
3、避免系统日志泄露个人数据
将调试日志发给他人进行分析前,请删除个人数据。
说明: 因为日志级别(log_min_messages)设置为DEBUGx(x为DEBUG级别,取值范围为1~5)时,调试日志中记录的信息可能包含用户的个人数据。
将系统日志发给其他人进行分析前,请删除个人数据。因为在默认配置下,当SQL语句执行错误时,日志中会记录出错的SQL语句,而这些SQL语句中可能包含用户个人数据。
将log_min_error_statement参数的值设置为PANIC,可以避免将出错的SQL语句记录在系统日志中。若禁用该功能,当出现故障时,很难定位故障原因。
总结
本文详细介绍了openGauss 6.0.0数据库的日常运维,包括安装与部署、数据导入与导出、备份与恢复、性能调优与监控以及安全加固与防护等方面。希望能够帮助用户更好地管理和维护openGauss 6.0.0数据库,保障企业信息化建设的稳定和发展。


 308
308

 被折叠的 条评论
为什么被折叠?
被折叠的 条评论
为什么被折叠?
 到【灌水乐园】发言


