


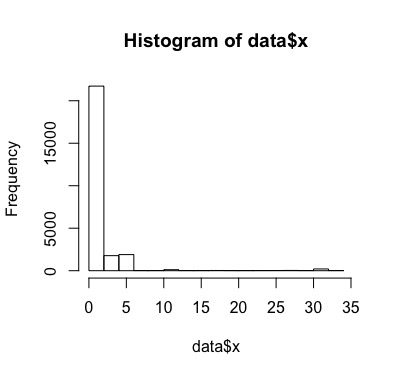
直方图:
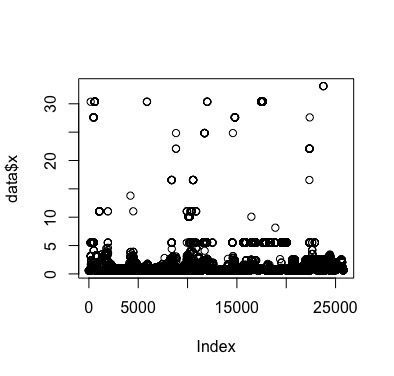
hist(data$x)散点图:
plot(data$x)列连函数
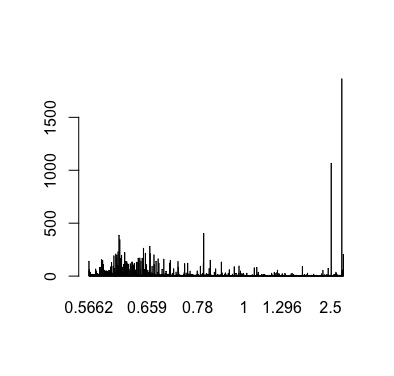
 table(data$x)#统计次数
 0.5662 0.5663 0.5664 0.5665 0.5667 0.5669  0.567
   140     62     47      3     12      5     10
柱状图
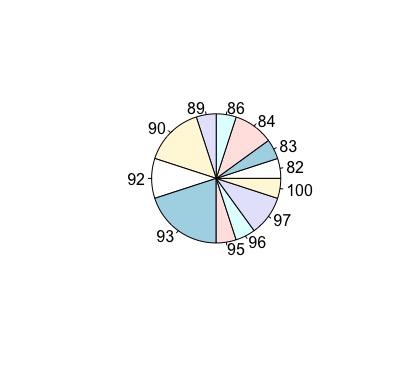
barplot(table(data$x))饼图
pie(table(round(runif(20,min = 80,max=100))),radius = 3)箱尾图
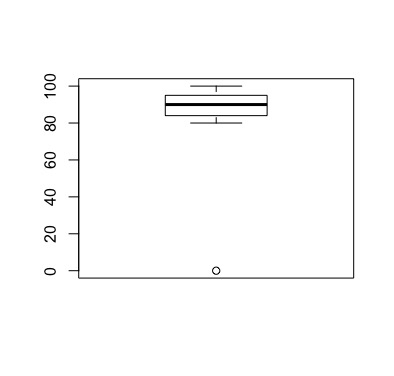
 boxplot(a)
 boxplot(a,col = "red",notch = T)
 #参数boxplot(a,col = "red",notch = T,horizontal = T) 指水平放置
 #箱外两条直线,是两个四分位点,箱子中间的线是中位数,圆圈是离群点。
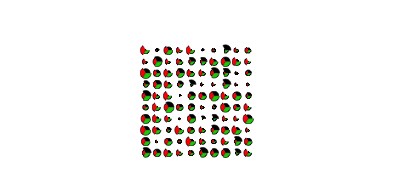
星相图
 stars(x[c('x1','x2','x3')])
 stars(x[c('x1','x2','x3')],draw.segments = T)
 #表示三个趋势的方向
 #面积大的代表成绩好
#图二代表雷达图
茎叶图
 stem(x$x1)

  The decimal point is 1 digit(s) to the right of the |

   8 | 689
   9 | 000111222223333444444
   9 | 55555566666677778888888999999
  10 | 00001111111222222344
  10 | 55556666667778889999
  11 | 011234
  11 | 5
qq图
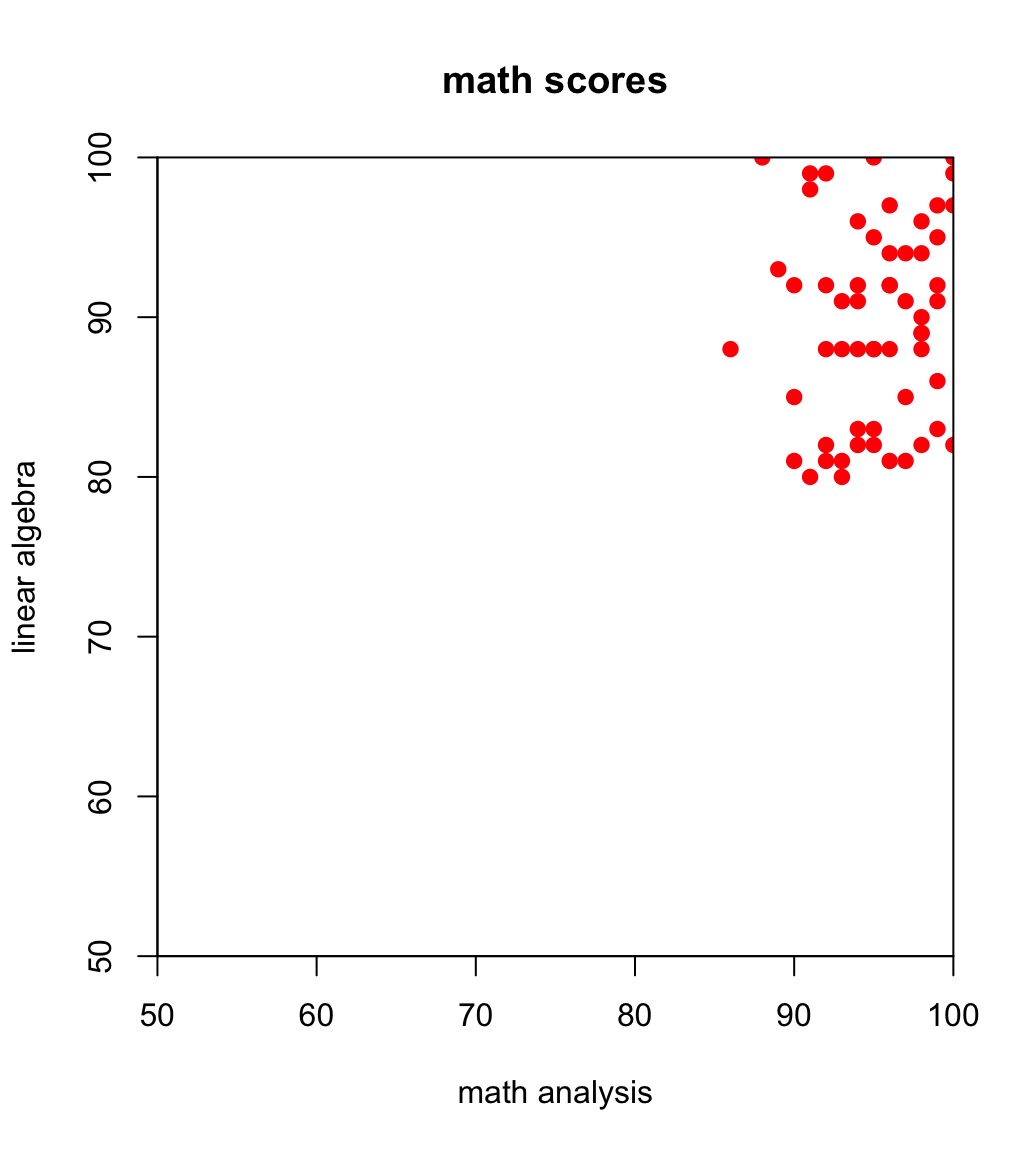
 qqline(x1)
 qqnorm(x1)
 检验数据是否符合正态分布
plot()
plot(x1,x2,main='math scores',xlab='math analysis', ylab='linear algebra', xlim=c(50,100), ylim=c(50,100), xaxs='i', yaxs='i',col='red',pch=19)
#pch=19 代表使用实圆点
#type='l'代表连线
在plot基础上继续画图 使用lines命令,lines参数同plot查看内置数据集
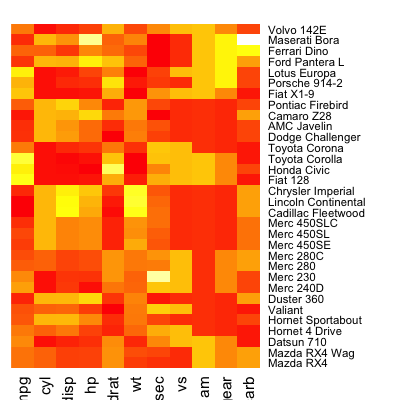
data()热力图:heatmap()
  heatmap(as.matrix(mtcars),Rowv = NA,Colv = NA,col=heat.colors(256),scale = 'column',margins = c(2,8),main="Car characteristic by model")

#颜色越浅,数值越大
散点图集
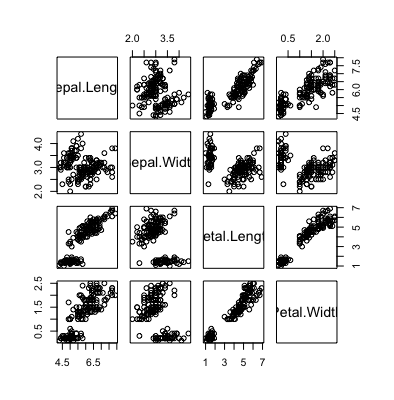
pairs(iris[,1:4])
#两两配对画图
par
#在同一个device输出多个图
par(mfrow=c(3,1))
图形窗的操作
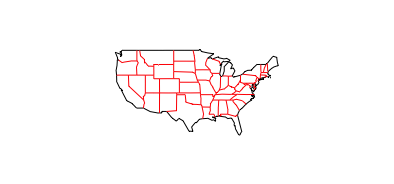
dev.new()#建立新的图形窗
dev.list()#查看存在的图形窗
dev.cur()#查看当前的图形窗
dev.next()#切换图形窗
地图
    library(maps)
    map("state",interior = F)
map("state", boundary = F,col = 'red',add=T)map("world", fill = T, col = heat.colors(10))
R 语言学习笔记(二)
最新推荐文章于 2024-08-26 21:19:40 发布


 5182
5182

 被折叠的 条评论
为什么被折叠?
被折叠的 条评论
为什么被折叠?
 到【灌水乐园】发言


