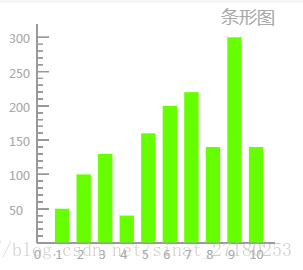
效果图

首先是XML布局
<!-- 折线图 -->
<
view
class
=
"canvas-view">
<
canvas
class
=
"canvas"
canvas-id
=
"canvasId"></
canvas
>
</
view
>
样式CSS
/* 折线图 */
.canvas-view
{
height:
100%
;
background:
#fff
;
display:
flex
;
align-items:
center
;
margin-top:
48
rpx
;
}
.canvas
{
width:
100%
;
height:
640
rpx
;
}
完整JS代码
const
app = getApp()
Page({
data: {
//条形框值
list: [
50
,
100
,
130
,
40
,
160
,
200
,
220
,
140
,
300
,
140
],
h32:
32
,
h64:
64
,
h360:
360
,
h420:
420
,
s28:
28
,
s18:
18
,
//Y轴分成的大分段
heightLineNum:
7
,
//X轴分成的大分段
widthLineNum:
10
,
//Y轴一个分段的值
yOneDuan:
50
},
onLoad:
function
(options) {
//画图
this
.initChart()
},
// 初始化条形图
initChart:
function
() {
const
ctx = wx.createCanvasContext(
'canvasId'
)
ctx.beginPath()
ctx.setStrokeStyle(
'#999999'
)
ctx.setFillStyle(
'#AAAAAA'
)
ctx.setLineWidth(
1
)
//坐标原点,Y轴坐标值从上往下是增加
const
leftBottomX =
this
.getEleWidth(
this
.data.h64)
const
leftBottomY =
this
.getEleWidth(
this
.data.h360)
//Y坐标
const
leftTopX =
this
.getEleWidth(
this
.data.h64)
const
leftTopY =
this
.getEleWidth(
this
.data.h32)
//X坐标
const
rightBottomX =
this
.getEleWidth(
this
.data.h420)
const
rightBottomY =
this
.getEleWidth(
this
.data.h360)
const
yHeight =
this
.getEleWidth(
this
.data.h360 -
this
.data.h32)
const
xWidth =
this
.getEleWidth(
this
.data.h420 -
this
.data.h64)
//从Y轴坐标开始画坐标系
//Y轴坐标到原点坐标画出Y轴线
//画完Y轴线,再从原点坐标到X轴坐标画出X轴线
ctx.moveTo(leftTopX, leftTopY)
ctx.lineTo(leftBottomX, leftBottomY)
ctx.lineTo(rightBottomX, rightBottomY)
//设置字体大小
ctx.setFontSize(
this
.getEleWidth(
this
.data.s28))
//设置字的位置
ctx.fillText(
"条形图"
,
this
.getEleWidth(
340
),
this
.getEleWidth(
32
))
//划分Y轴
this
.drawYScale(ctx);
//划分X轴
this
.drawXScale(ctx);
//画条形图
this
.drawRectScale(ctx);
ctx.stroke()
ctx.draw(
true
)
},
//划分Y轴
drawYScale:
function
(ctx) {
var
that =
this
;
//Y轴坐标刻度横坐标起点
var
scaleStartX =
this
.getEleWidth(
this
.data.h64)
//长的刻度
var
scaleEndX =
this
.getEleWidth(
this
.data.h64 +
18
)
//短的刻度
var
littleScaleEndX =
this
.getEleWidth(
this
.data.h64 +
9
)
//Y轴刻度总高度
const
yHeight =
this
.getEleWidth(
this
.data.h360)
//一个大分段的长度,一共分为6段
var
oneScaleX = yHeight /
this
.data.heightLineNum
//大分段数字字体大小
ctx.setFontSize(
this
.getEleWidth(
this
.data.s18))
//大分段数字位置横坐标
var
textX =
this
.getEleWidth(
this
.data.h64 -
42
)
//大分段,长刻度:50-300
for
(
var
i =
1
; i <
this
.data.heightLineNum; i++) {
var
scaleEndY = yHeight - oneScaleX * i
//画长刻度线条
ctx.moveTo(scaleStartX, scaleEndY)
ctx.lineTo(scaleEndX, scaleEndY)
ctx.fillText(
this
.data.yOneDuan * i, textX, scaleEndY +
this
.getEleWidth(
10
))
var
littleScaleStartY = yHeight - oneScaleX * (i -
1
)
//小分段,短刻度
for
(
var
j =
1
; j <
5
; j++) {
var
littleScaleEndY = littleScaleStartY - (oneScaleX /
5
) * j
//画短刻度线条
ctx.moveTo(scaleStartX, littleScaleEndY)
ctx.lineTo(littleScaleEndX, littleScaleEndY)
ctx.stroke();
}
}
},
//划分X轴
drawXScale:
function
(ctx) {
var
that =
this
;
//X轴刻度值Y坐标
var
scaleStartY =
this
.getEleWidth(that.data.h360)
//X轴总长度=X轴横坐标-向右偏移长度
const
xWidth =
this
.getEleWidth(that.data.h420 - that.data.h64)
//X轴起始点
const
xMaginLeft =
this
.getEleWidth(that.data.h64)
//一个分段的宽度
const
oneScaleX = xWidth / (that.data.widthLineNum +
1
)
for
(
var
i =
0
; i < that.data.widthLineNum +
1
; i++) {
var
toEndX = xMaginLeft + oneScaleX * i;
ctx.fillText(i, toEndX -
this
.getEleWidth(
5
), scaleStartY +
this
.getEleWidth(
24
))
}
},
//画条形方框
drawRectScale:
function
(ctx) {
var
that =
this
;
//X轴总长度=X轴横坐标-向右偏移长度
const
xWidth =
this
.getEleWidth(that.data.h420 - that.data.h64)
const
yHeight =
this
.getEleWidth(that.data.h360)
//X轴起始点
const
xMaginLeft =
this
.getEleWidth(that.data.h64)
//X坐标,一个空格的值
const
oneScaleX = xWidth / (that.data.widthLineNum +
1
)
//Y坐标,一个空格的值
var
oneScaleY = yHeight /
this
.data.heightLineNum
for
(
var
i =
0
; i < that.data.list.length; i++) {
const
currentRect = that.data.list[i];
//条矩形的宽度
const
rectWidth = oneScaleX /
3
*
2
;
//条矩形的高度
const
rectHeight = currentRect /
this
.data.yOneDuan * oneScaleY;
//矩形左上角的x坐标和y坐标
const
x = xMaginLeft -
(oneScaleX - rectWidth) /
2
+ oneScaleX * (i +
1
);
const
y = yHeight - rectHeight
//绿色填充
ctx.setFillStyle(
'#66FF00'
)
//画框
ctx.fillRect(x, y, rectWidth, rectHeight);
}
},
//获取屏幕自适应宽度
getEleWidth:
function
(w) {
var
real =
0
;
try
{
var
res = wx.getSystemInfoSync().windowWidth;
//以宽度480px设计做宽度的自适应
var
scale = (
480
/
2
) / (w /
2
);
real = Math.floor(res / scale);
return
real;
}
catch
(e) {
return
false
;
}
}
})


 319
319

 被折叠的 条评论
为什么被折叠?


