


Just My Code debugging
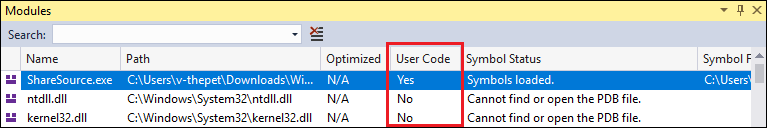
During a debugging session, the Modules window shows which code modules the debugger is treating as My Code (user code), along with their symbol loading status. For more information, see Get more familiar with how the debugger attaches to your app.
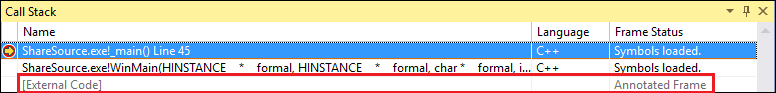
In the Call Stack or Tasks window, Just My Code collapses non-user code into a grayed-out annotated code frame labeled [External Code].
Tip: To open the Modules, Call Stack, Tasks, or most other debugging windows, you must be in a debugging session. While debugging, under Debug > Windows, select the windows you want to open.
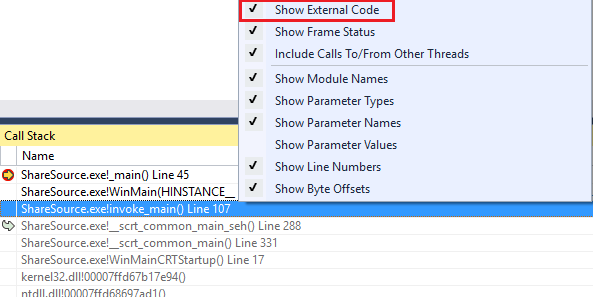
To view the code in a collapsed [External Code] frame, right-click in the Call Stack or Task window, and select Show External Code from the context menu. The expanded external code lines replace the [External Code] frame.
Note: Show External Code is a current user profiler setting that applies to all projects in all languages that are opened by the user.
Double-clicking an expanded external code line in the Call Stack window highlights the calling code line in green in the source code. For DLLs or other modules not found or loaded, a symbol or source not found page may open.
References
Debug user code with Just My Code - Visual Studio (Windows) | Microsoft Docs
Visual Studio Debug only user code with Just My Code - ltimaginea - 博客园 (cnblogs.com)


 1034
1034


 被折叠的 条评论
为什么被折叠?
被折叠的 条评论
为什么被折叠?
 到【灌水乐园】发言


