


使用Markdown编辑器写的知识点
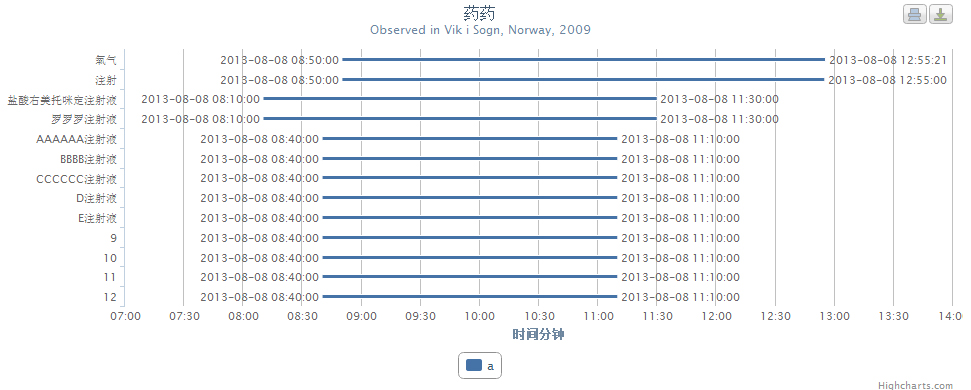
在Csdn论坛里的回答 关于highcharts的问题 —— [ highcharts 时间轴]
对您在学习highcharts参考帮助?。
highcharts 属性
语法:
| 属性 | 介绍 |
|---|---|
| dateFormat | 将一个时间戳(毫秒)转为可读性的日期时间串 [转换为时间] |
| Series | 数据列。图表上一个或多个数据系列,比如曲线图中的一条曲线,柱状图中的一个柱形 |
| Tooltip | 数据提示框。当鼠标悬停在某点上时,以框的形式提示该点的数据,比如该点的值,数据单位等 |
| Title | 图表标题 |
| Axis | 坐标轴,包含x轴(xAxis)和y轴(yAxis)。通常情况下,x轴显示在图表的底部,y轴显示在图表的左侧。 |
代码块
完整代码:
<!DOCTYPE html PUBLIC "-//W3C//DTD XHTML 1.0 Transitional//EN" "http://www.w3.org/TR/xhtml1/DTD/xhtml1-transitional.dtd">
<html xmlns="http://www.w3.org/1999/xhtml">
<head>
<title> Hightchart </title>
<meta http-equiv="Content-Type" content="text/html; charset=gb2312">
<script src="jquery-1.7.2.min.js" type="text/javascript"></script>
<script src="Highcharts/jquery.js" type="text/javascript"></script>
<script src="Highcharts/js/highcharts.js" type="text/javascript"></script>
<script src="Highcharts/js/modules/exporting.js" type="text/javascript"></script>
<script src="Highcharts/js/highcharts-more.js" type="text/javascript"></script>
<script type="text/javascript">
var chart;
//
$(document).ready(function() {
Highcharts.setOptions({
global : {
useUTC : false
}
});
chart = new Highcharts.Chart({
chart: {
renderTo: 'container',
type: 'columnrange',//'columnrange',
inverted: true
},
title: {
text: '这个别是不是title'
},
subtitle: {
text: 'Observed in Vik i Sogn, Norway, 2009'
},
xAxis: {
categories : ['氧气', '注射', '盐酸右美托咪定注射液', '罗罗罗注射液', 'AAAAAA注射液', 'BBBB注射液', 'CCCCCC注射液', 'D注射液', 'E注射液']
},
yAxis: {
title: {
text: '时间分钟'
},
min : (new Date('2013-08-08 07:00:00')).getTime(), // y轴的最大显示值
max : (new Date('2013-08-08 14:00:00')).getTime(), // y轴的最小显示值
endOnTick : true,
type : 'datetime' ,
tickPixelInterval: 50
},
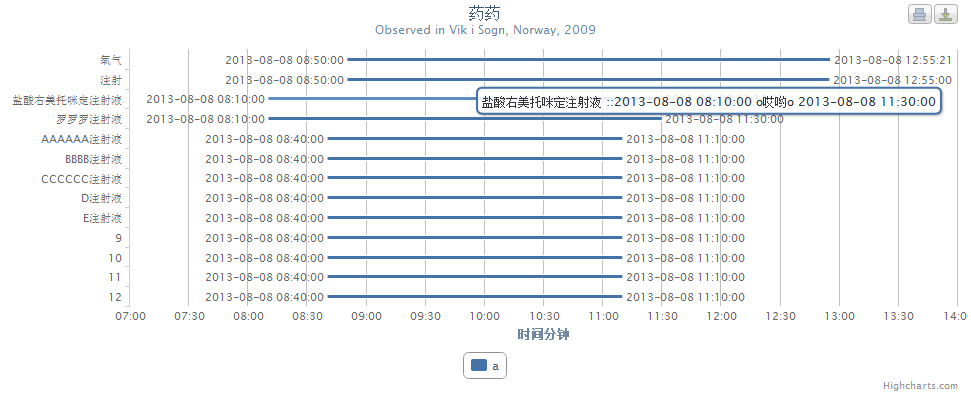
tooltip: {
// valueSuffix: '',
formatter: function() {
//var ar = Highcharts.numberFormat(this.y, 4); //this.x 显示 氧气
return this.x+ ' ::' +
Highcharts.dateFormat('%Y-%m-%d %H:%M:%S', this.y) +" 该吃药了 "+Highcharts.dateFormat('%Y-%m-%d %H:%M:%S', this.point.high ) ; // 显示时间
}
},
plotOptions: {
columnrange: {
dataLabels: {
enabled: true ,
formatter: function() {
return '' +
Highcharts.dateFormat('%Y-%m-%d %H:%M:%S', this.y) ;
}
}
},
bar:
{
dataLabels: {
enabled: true,
formatter: function() {
return '' +
Highcharts.dateFormat('%Y-%m-%d %H:%M:%S', this.y) ;
}
}},
series: {
pointWidth: 5
}
},
legend: {
enabled: true
},
series: [{
name: ' a',
data : [ [(new Date("2013-08-08 08:50:00")).getTime(), (new Date("2013-08-08 12:55:21")).getTime()],
[(new Date("2013-08-08 08:50:00")).getTime(), (new Date("2013-08-08 12:55:00")).getTime()],
[(new Date("2013-08-08 08:10:00")).getTime(),(new Date("2013-08-08 11:30:00")).getTime()],
[(new Date("2013-08-08 08:10:00")).getTime(), (new Date("2013-08-08 11:30:00")).getTime()],
[(new Date("2013-08-08 08:40:00")).getTime(), (new Date("2013-08-08 11:10:00")).getTime()],
[(new Date("2013-08-08 08:40:00")).getTime(), (new Date("2013-08-08 11:10:00")).getTime()],
[(new Date("2013-08-08 08:40:00")).getTime(), (new Date("2013-08-08 11:10:00")).getTime()],
[(new Date("2013-08-08 08:40:00")).getTime(), (new Date("2013-08-08 11:10:00")).getTime()],
[(new Date("2013-08-08 08:40:00")).getTime(), (new Date("2013-08-08 11:10:00")).getTime()],
[(new Date("2013-08-08 08:40:00")).getTime(), (new Date("2013-08-08 11:10:00")).getTime()],
[(new Date("2013-08-08 08:40:00")).getTime(), (new Date("2013-08-08 11:10:00")).getTime()],
[(new Date("2013-08-08 08:40:00")).getTime(), (new Date("2013-08-08 11:10:00")).getTime()],
[(new Date("2013-08-08 08:40:00")).getTime(), (new Date("2013-08-08 11:10:00")).getTime()]
]
}]
});
});
</script>
</head>
<body>
<div id="container" style="min-width: 400px; height: 400px; margin: 0 auto"></div>
</body>
</html>运行结果


 287
287

 被折叠的 条评论
为什么被折叠?
被折叠的 条评论
为什么被折叠?
 到【灌水乐园】发言


