


文章目录
zabbix监控 + grafana
1. Grafana简介
Grafana是一个开源的数据可视化和监控平台。它提供了丰富的图表、图形和面板,可用于实时监控和分析各种数据源,包括指标、日志、事件和数据库等。
Grafana支持多种数据源,包括常见的时序数据库(例如InfluxDB、Prometheus)、关系型数据库(例如MySQL、PostgreSQL)、日志数据(例如Elasticsearch、Splunk)和其他API服务。使用Grafana,您可以轻松地连接到这些数据源,并在直观易懂的仪表板中创建、编辑和共享视觉化图表。
Grafana具有丰富的图表和面板配置功能,可以自定义图表样式、时间范围、警报条件和交互式功能。它还支持多个用户和角色管理,可以根据需要设置不同的用户权限。
Grafana是一个非常受欢迎的工具,广泛应用于软件开发、系统管理、网络监控、物联网和云端监控等领域。它的可扩展性和灵活性使得用户能够快速构建强大的监控和数据分析解决方案。
2. Grafana部署
| 主机名 | 系统版本 | ip地址 | 主机 | zabbix版本 | Grafana版本 |
|---|---|---|---|---|---|
| kiwi.server.com | CentOS8 | 192.168.234.33 | 服务端 | zabbix-6.4.6 | grafana-enterprise-10.1.2 |
| kiwi111.client.com | CentOS8 | 192.168.234.22 | 客户端 | zabbix-6.4.6 | grafana-enterprise-10.1.2 |
注:zabbix监控服务部署详细步骤见 Zabbix监控服务部署、zabbix监控agent部署步骤,在此不多做赘述。
2.1 下载Grafana
[root@kiwi ~]# sudo yum install -y https://dl.grafana.com/enterprise/release/grafana-enterprise-10.1.2-1.x86_64.rpm

································略


  xorg-x11-font-utils-1:7.5-41.el8.x86_64
  xorg-x11-server-utils-7.7-27.el8.x86_64

Complete!
2.2 启动grafana服务并设置开机自启
[root@kiwi ~]#  systemctl enable --now grafana-server
Synchronizing state of grafana-server.service with SysV service script with /usr/lib/systemd/systemd-sysv-install.
Executing: /usr/lib/systemd/systemd-sysv-install enable grafana-server
Created symlink /etc/systemd/system/multi-user.target.wants/grafana-server.service → /usr/lib/systemd/system/grafana-server.service.
[root@kiwi ~]#


## grafana服务用的是3000端口
[root@kiwi ~]# ss -antl
State     Recv-Q    Send-Q       Local Address:Port        Peer Address:Port    Process
LISTEN    0         128                0.0.0.0:22               0.0.0.0:*
LISTEN    0         128                0.0.0.0:10050            0.0.0.0:*
LISTEN    0         128                0.0.0.0:10051            0.0.0.0:*
LISTEN    0         128              127.0.0.1:9000             0.0.0.0:*
LISTEN    0         128                      *:80                     *:*
LISTEN    0         128                   [::]:22                  [::]:*
LISTEN    0         2048                     *:3000                   *:*
LISTEN    0         80                       *:3306                   *:*
2.3 下载zabbix插件
[root@kiwi ~]# grafana-cli plugins install alexanderzobnin-zabbix-app
✔ Downloaded and extracted alexanderzobnin-zabbix-app v4.4.1 zip successfully to /var/lib/grafana/plugins/alexanderzobnin-zabbix-app

Please restart Grafana after installing or removing plugins. Refer to Grafana documentation for instructions if necessary


## 重启服务
[root@kiwi ~]# systemctl restart grafana-server
2.4 在web端进行配置zabbix插件
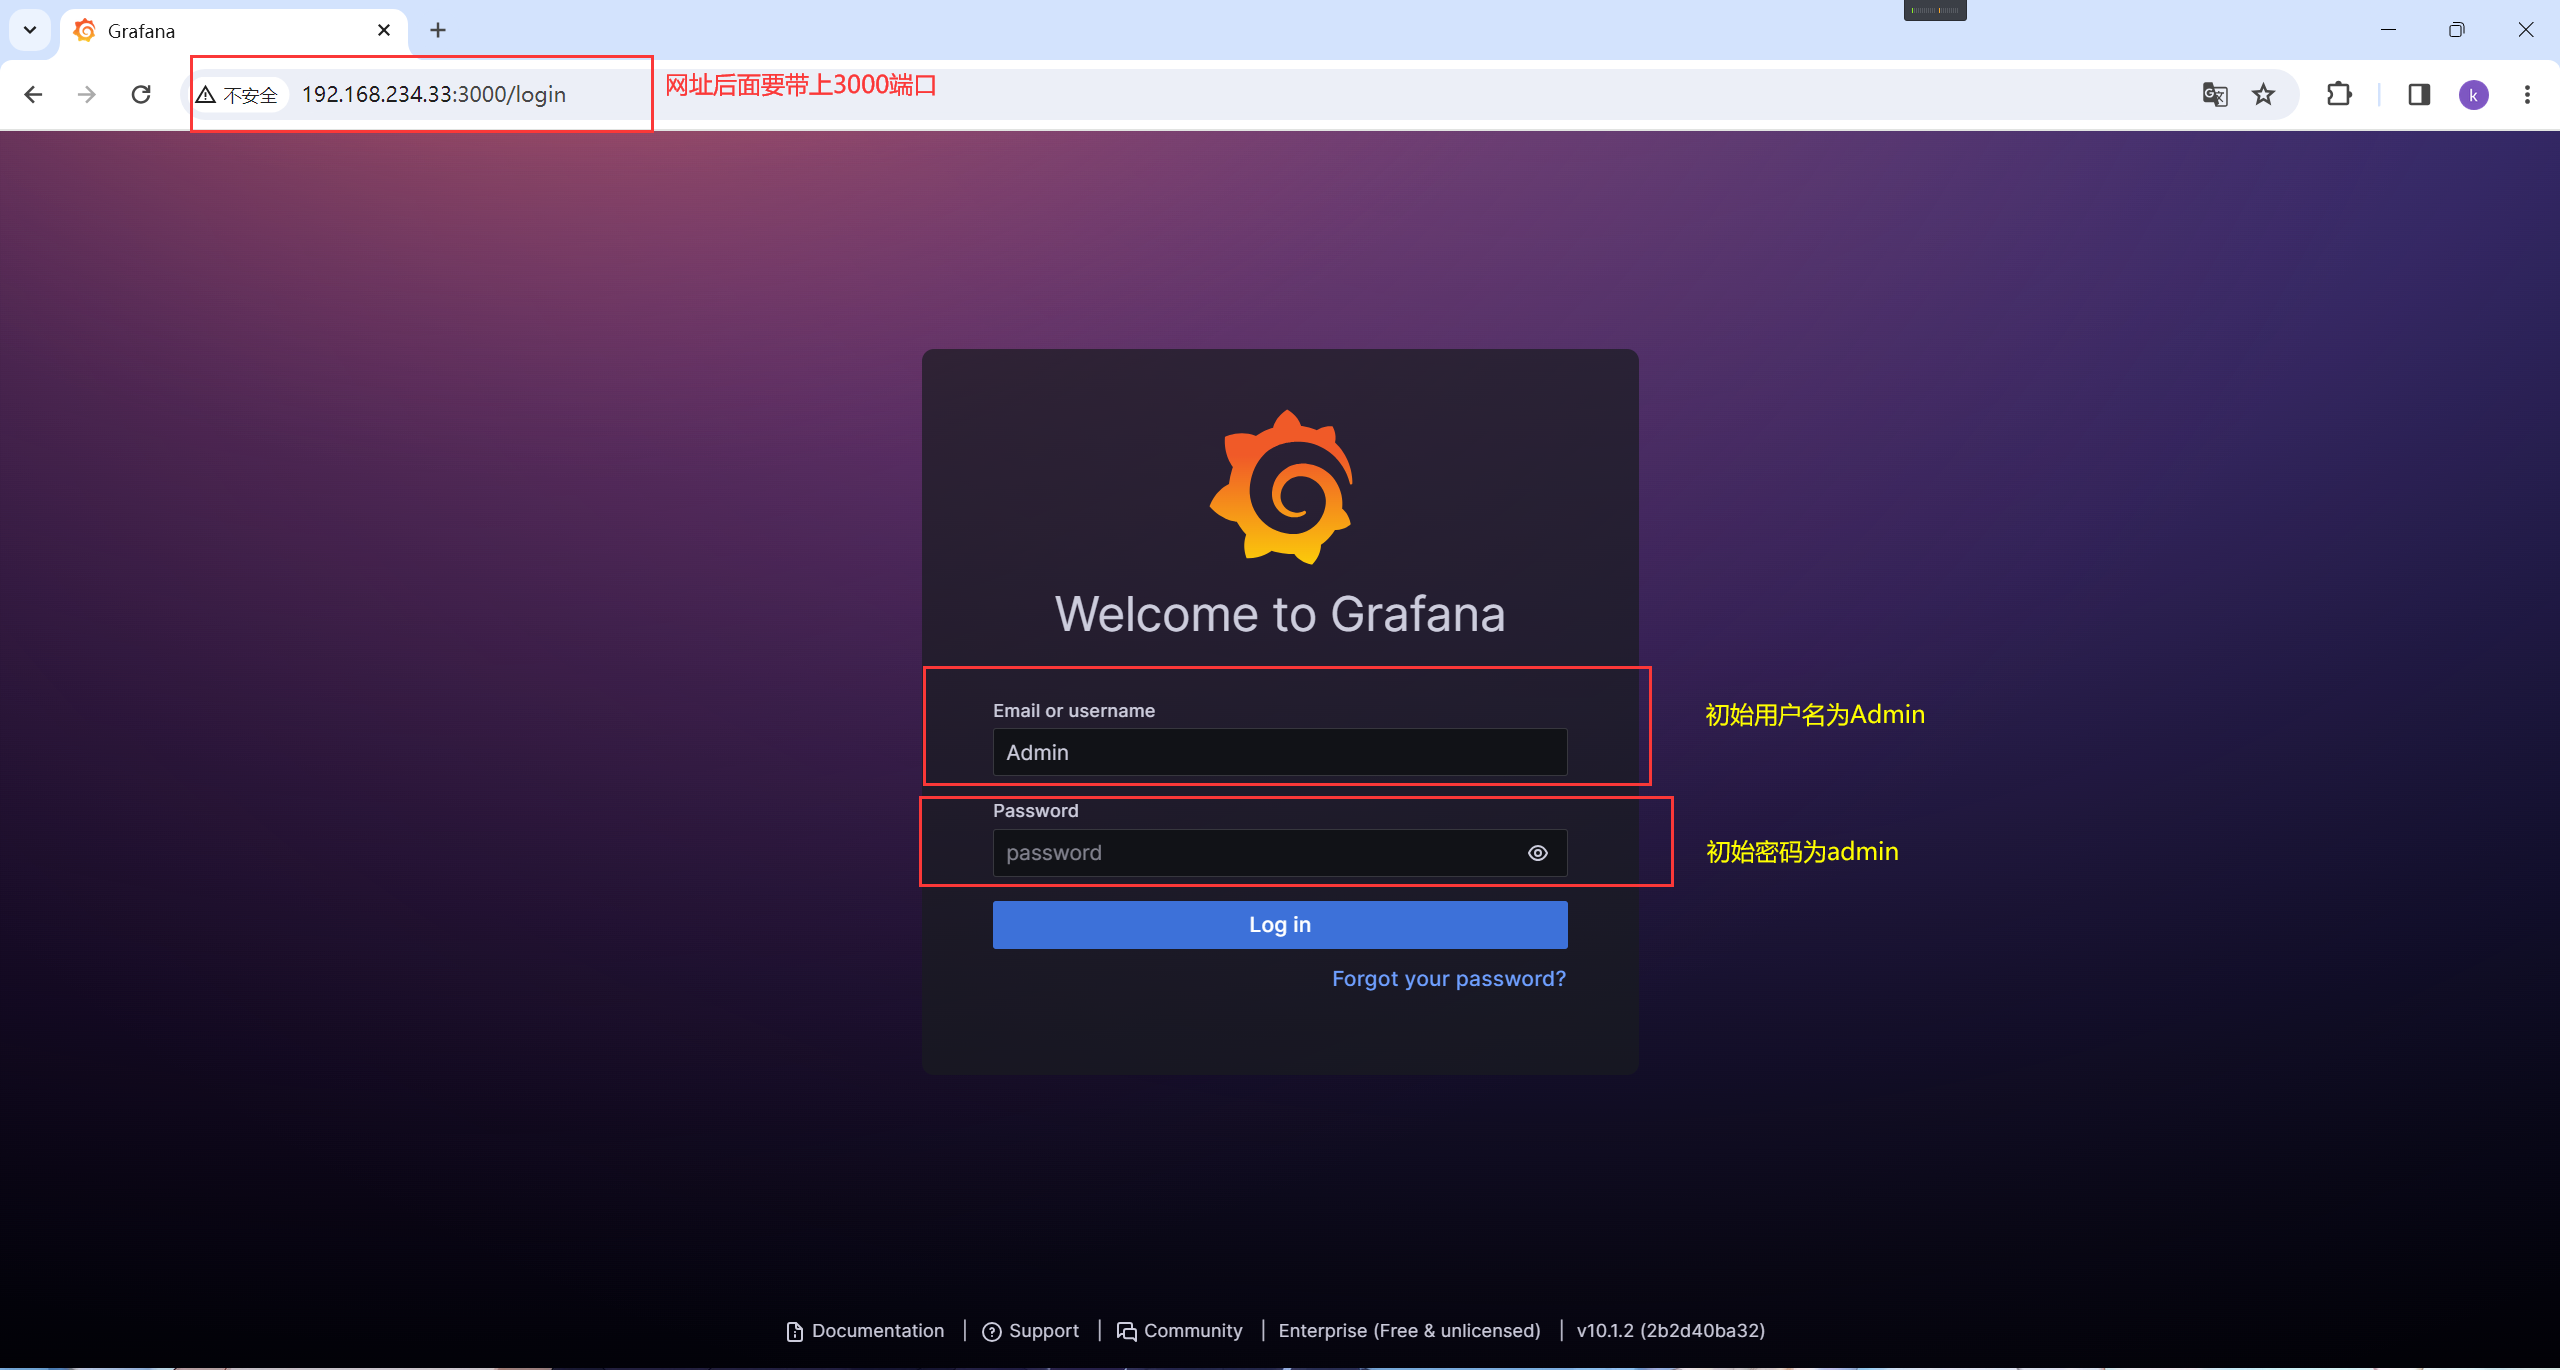
注:如果密码不为admin则为Admin,反之亦然,登陆进去之后会让你更新密码。
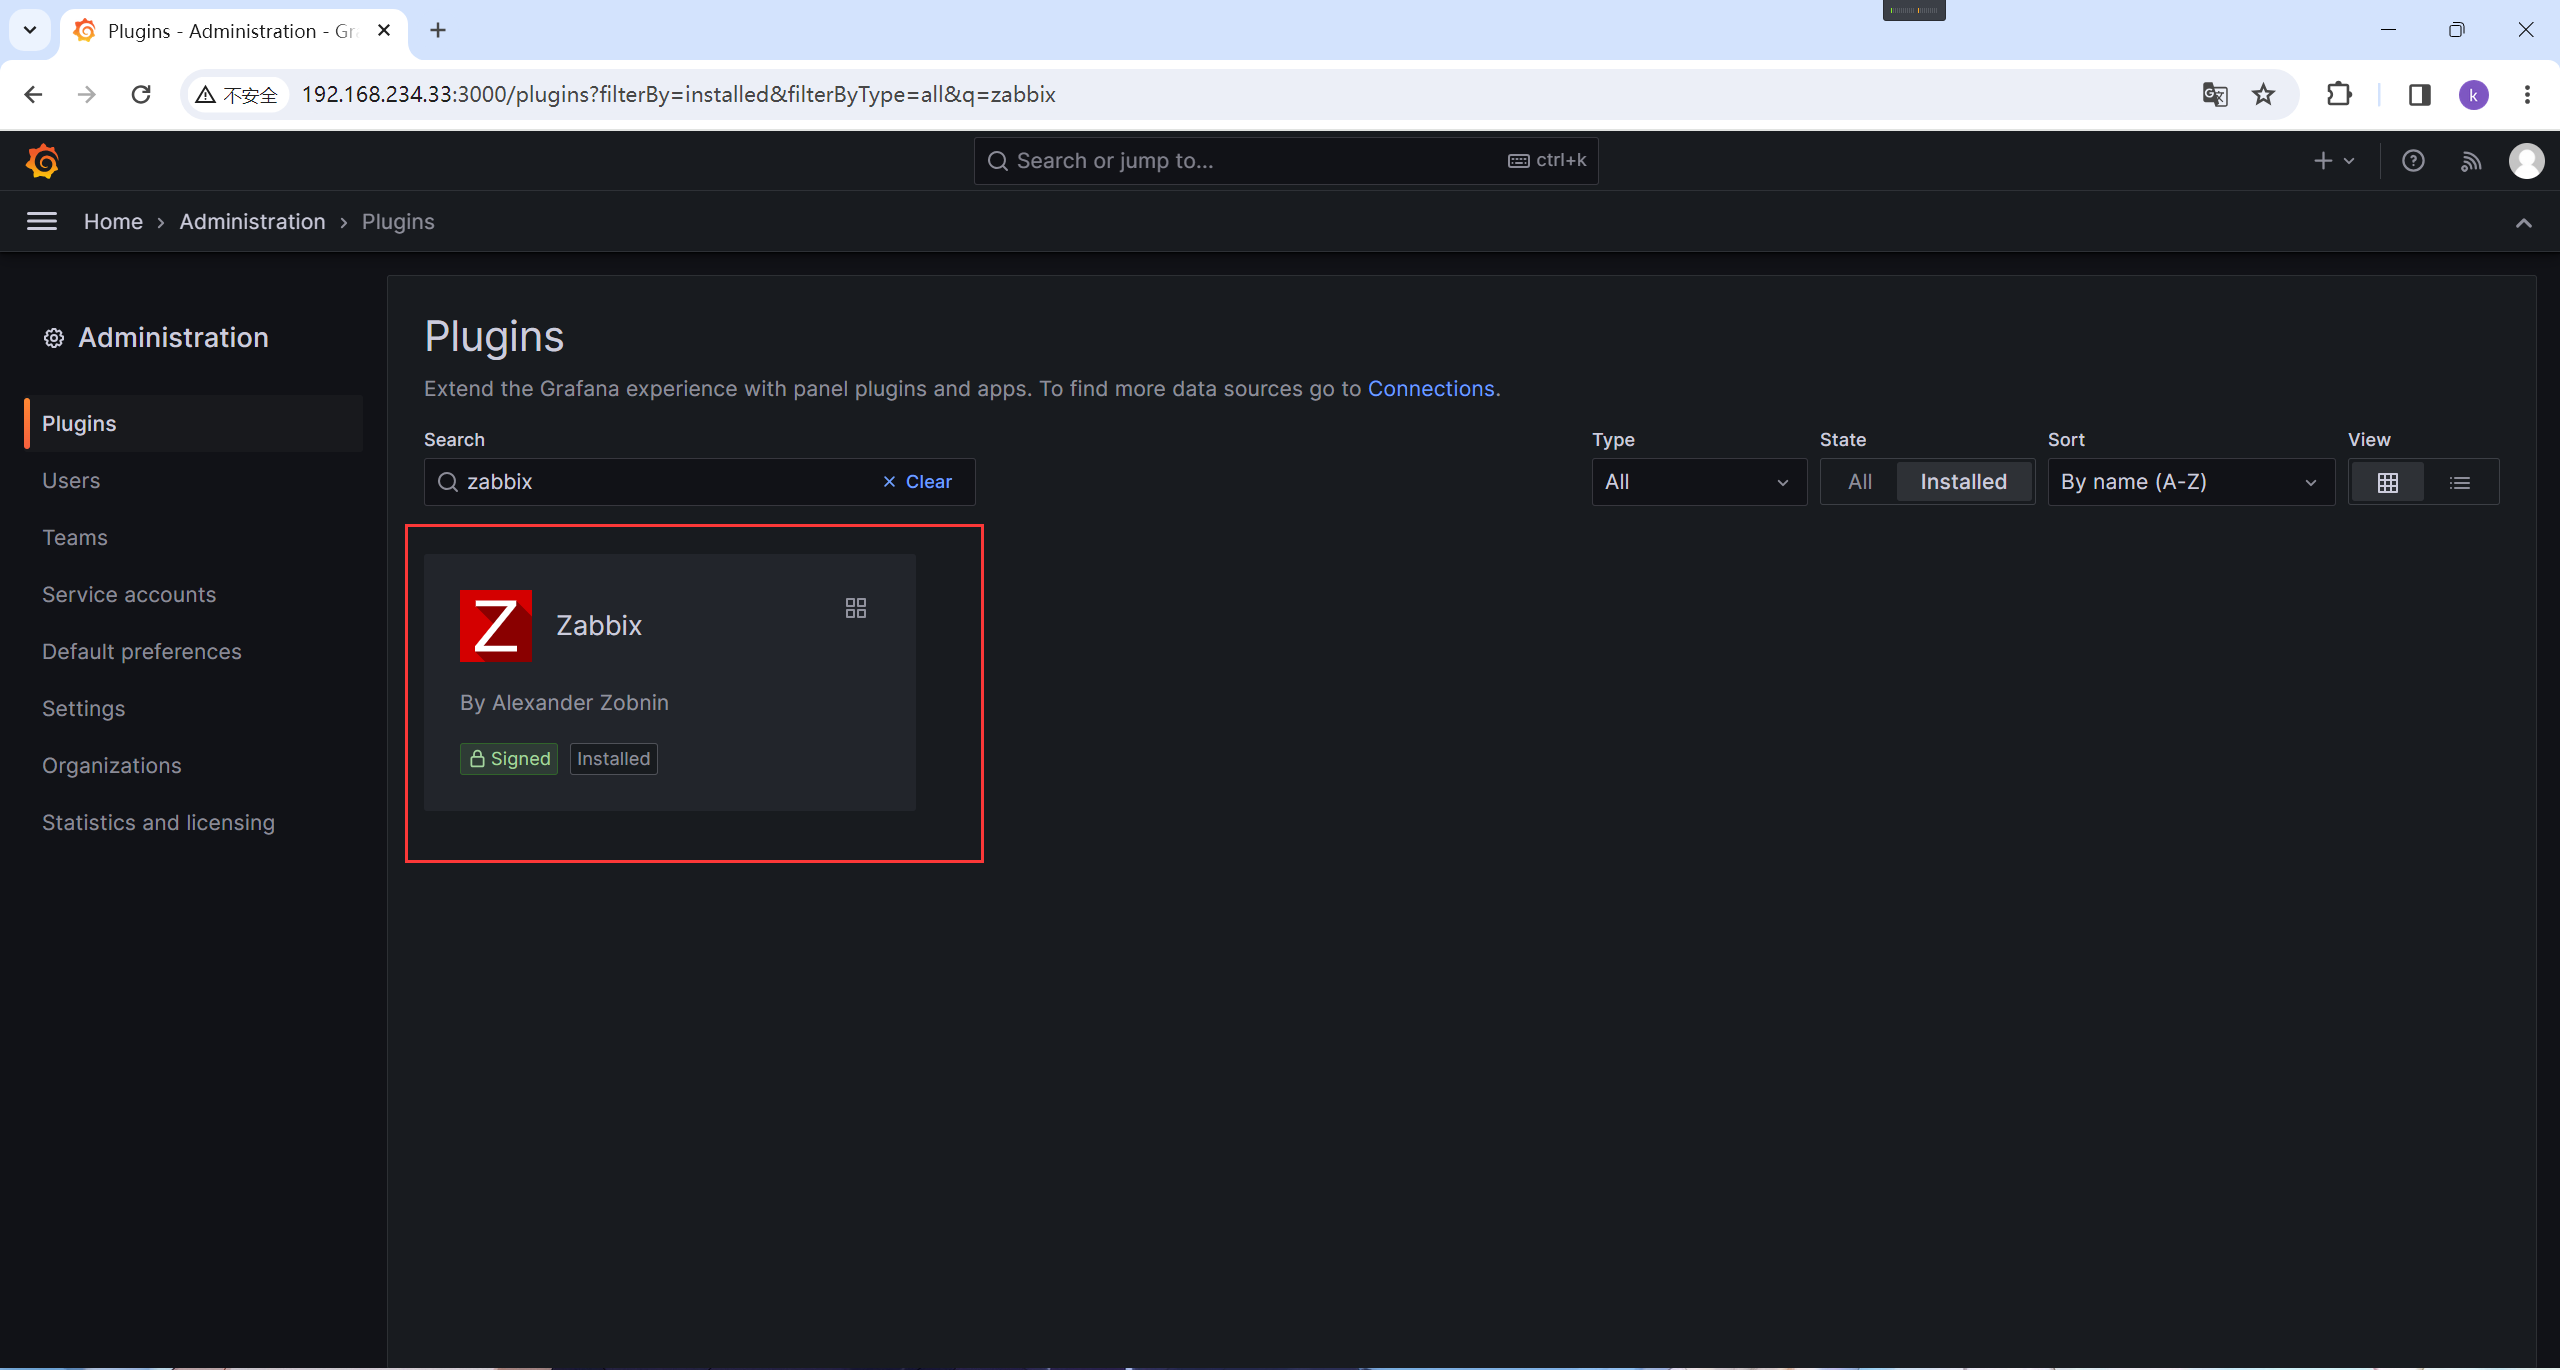
启用zabbix插件

点击zabbix
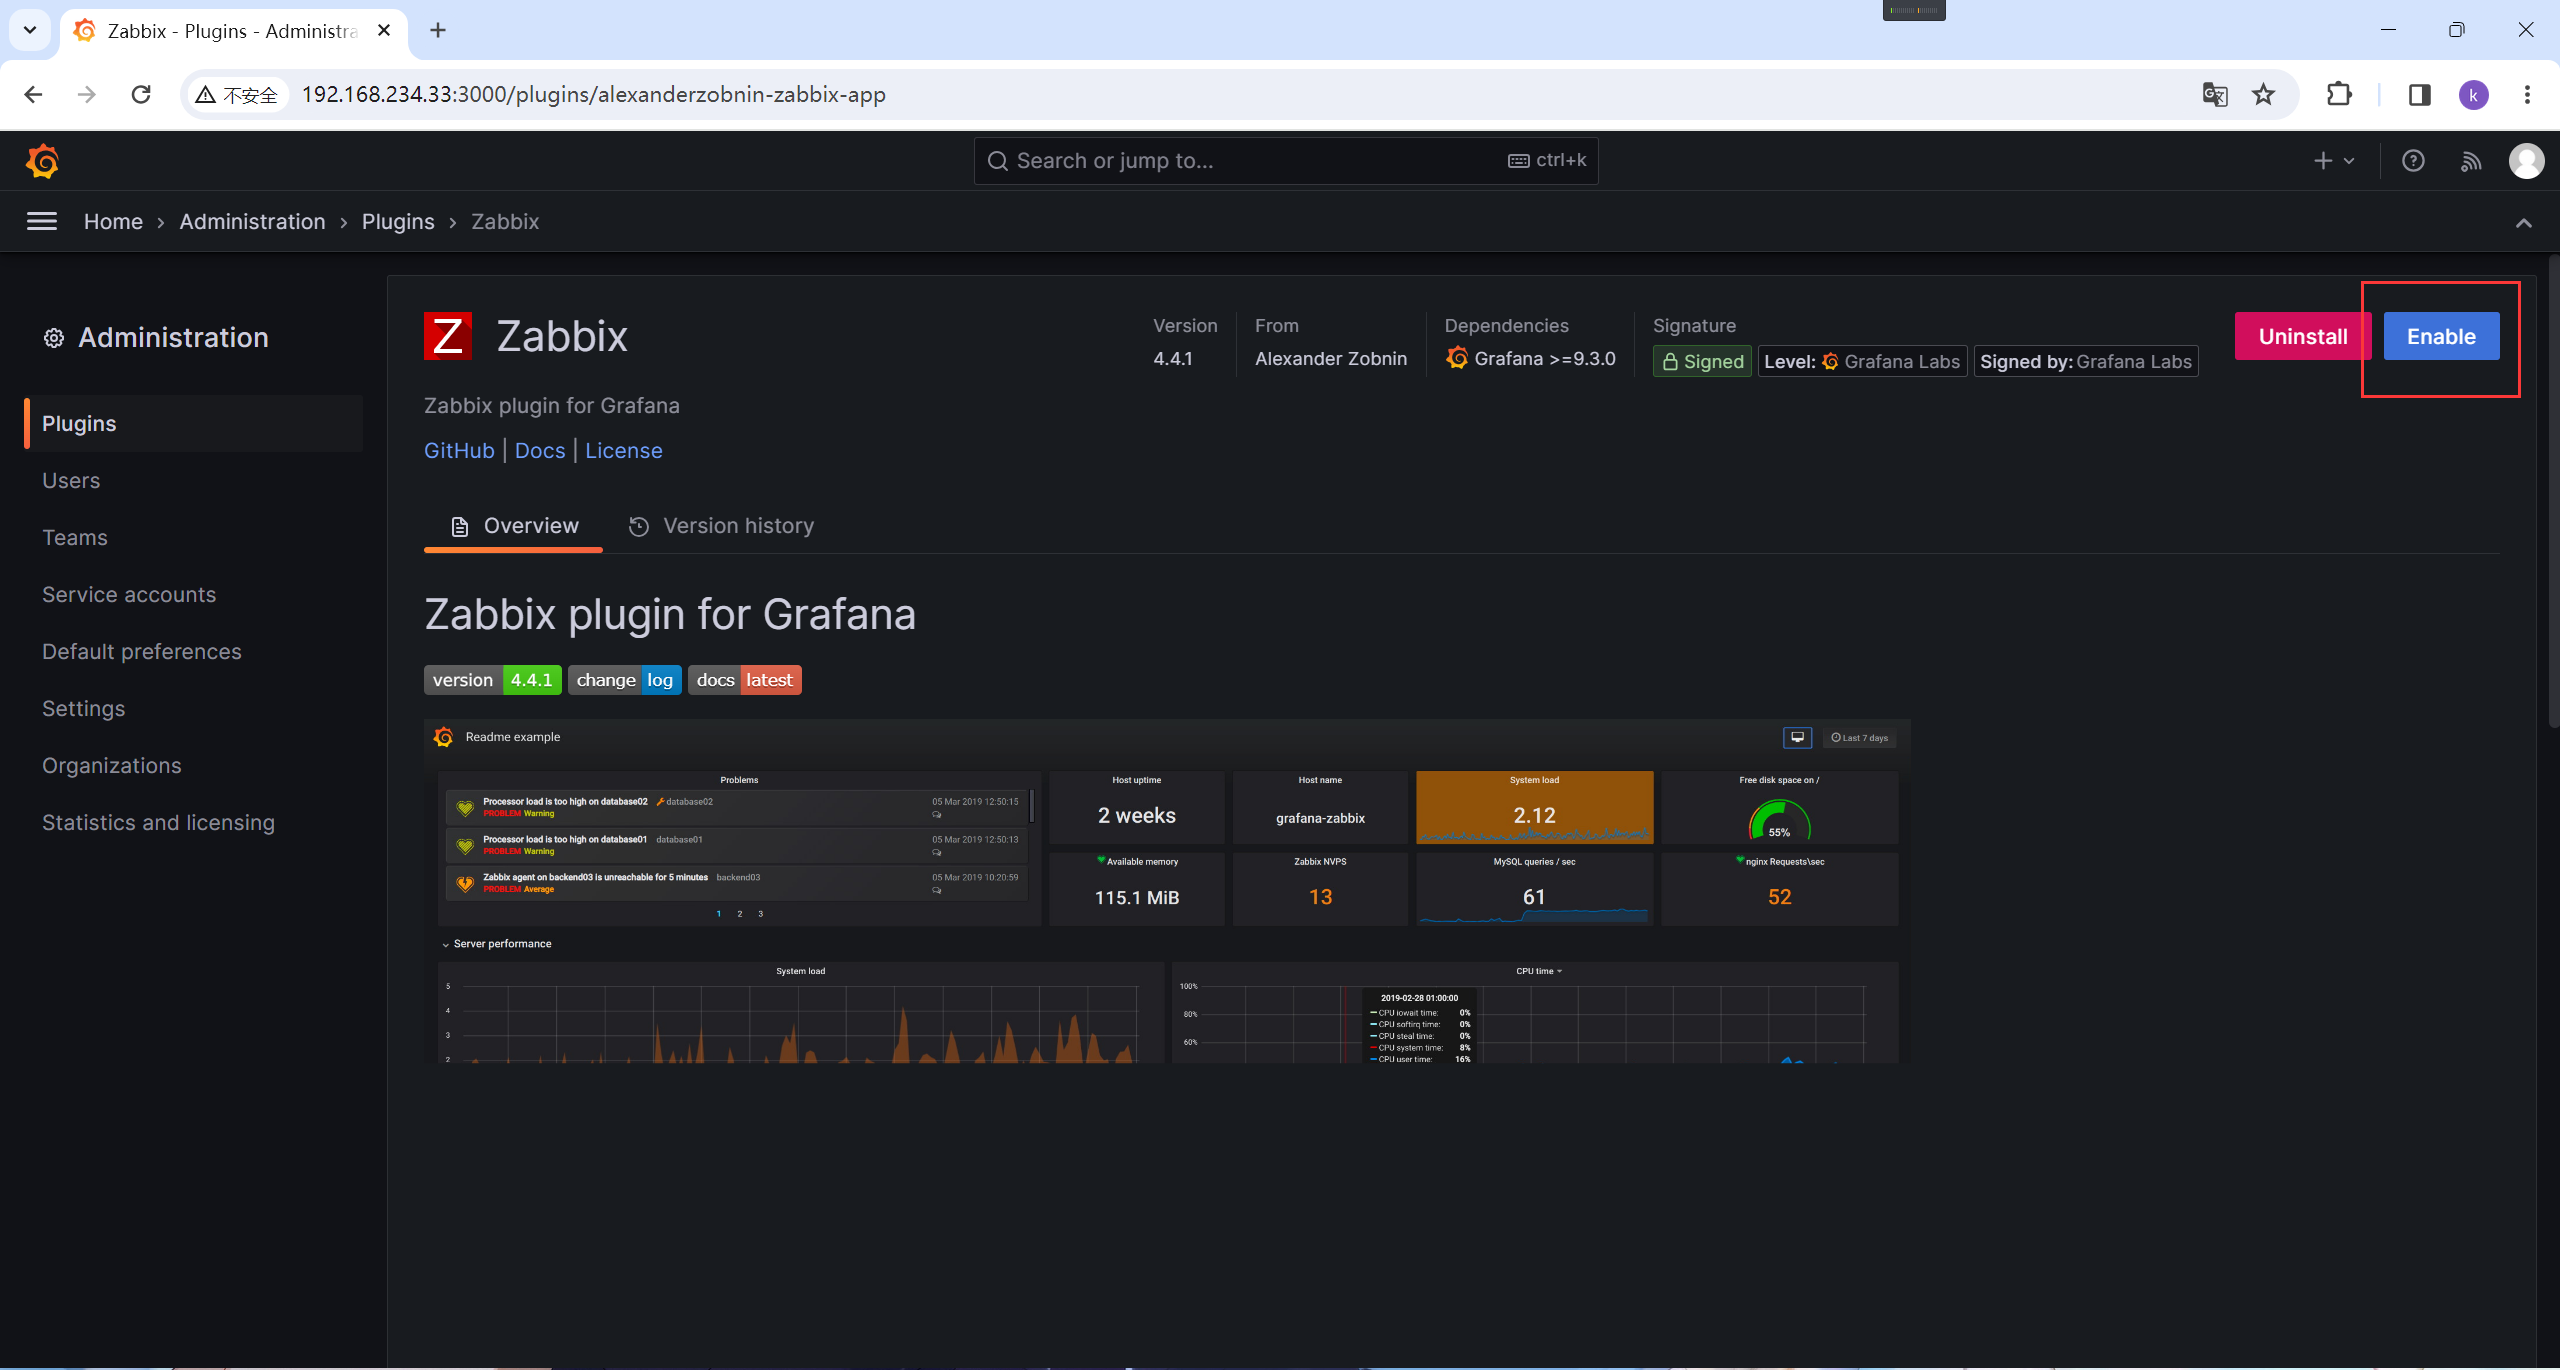
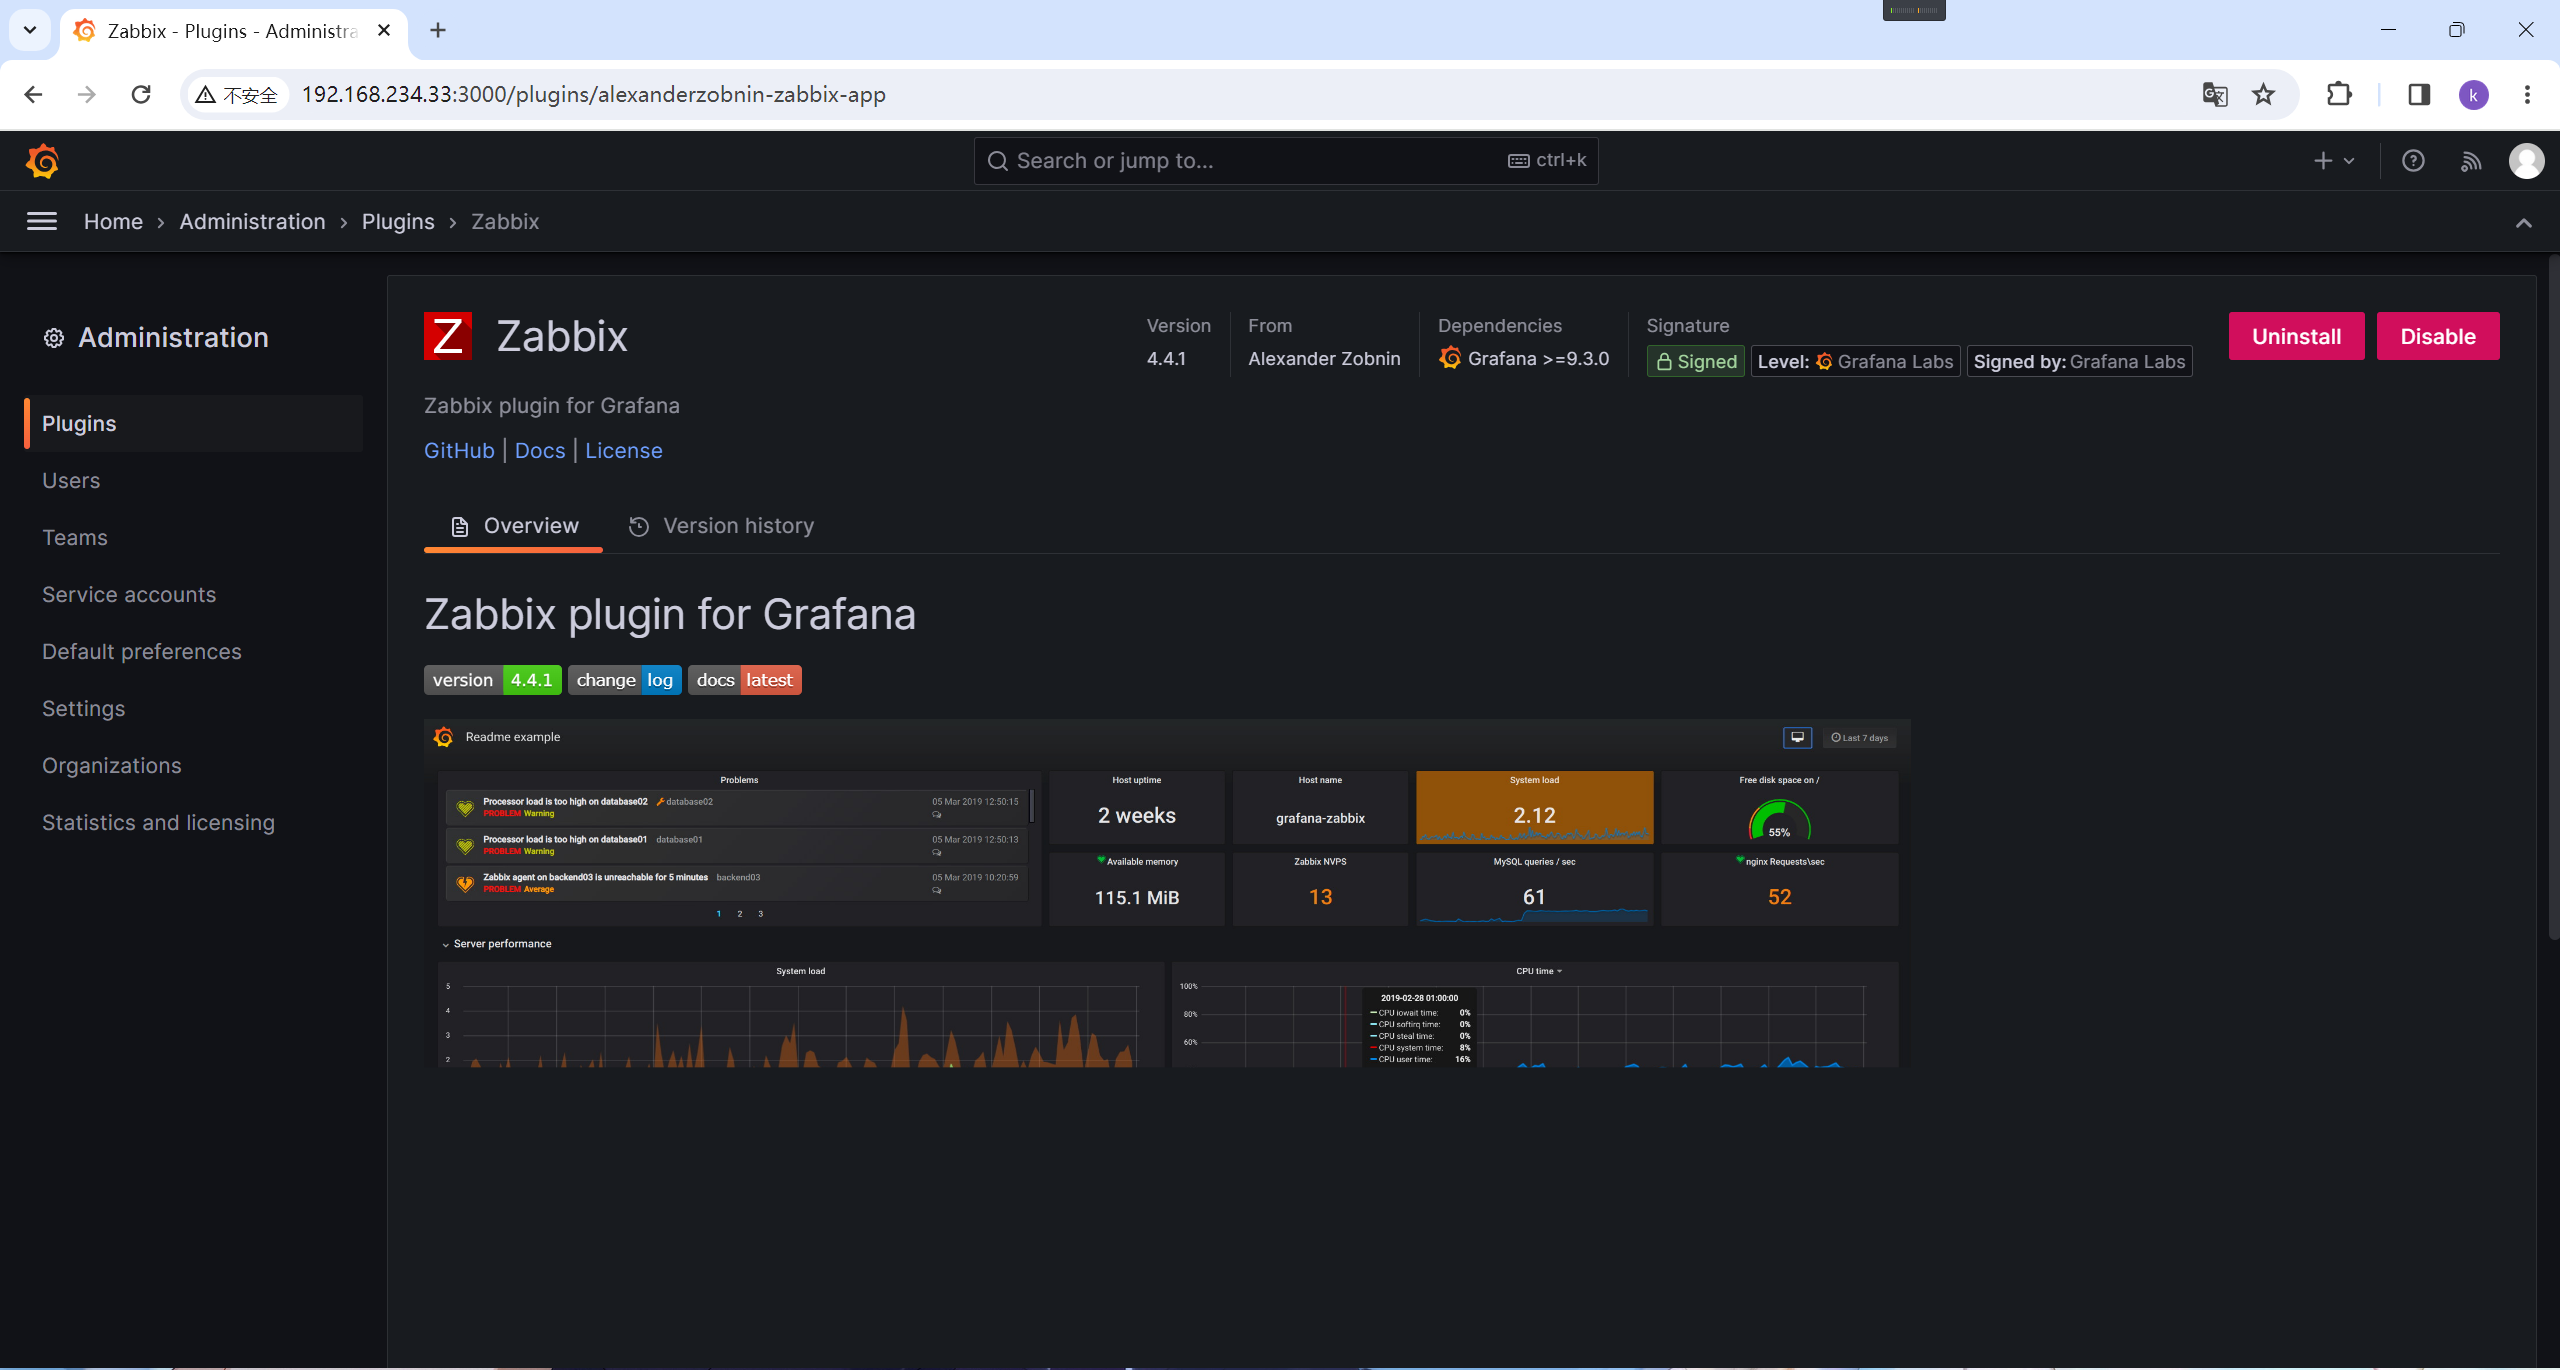
将它启用
添加zabbix插件
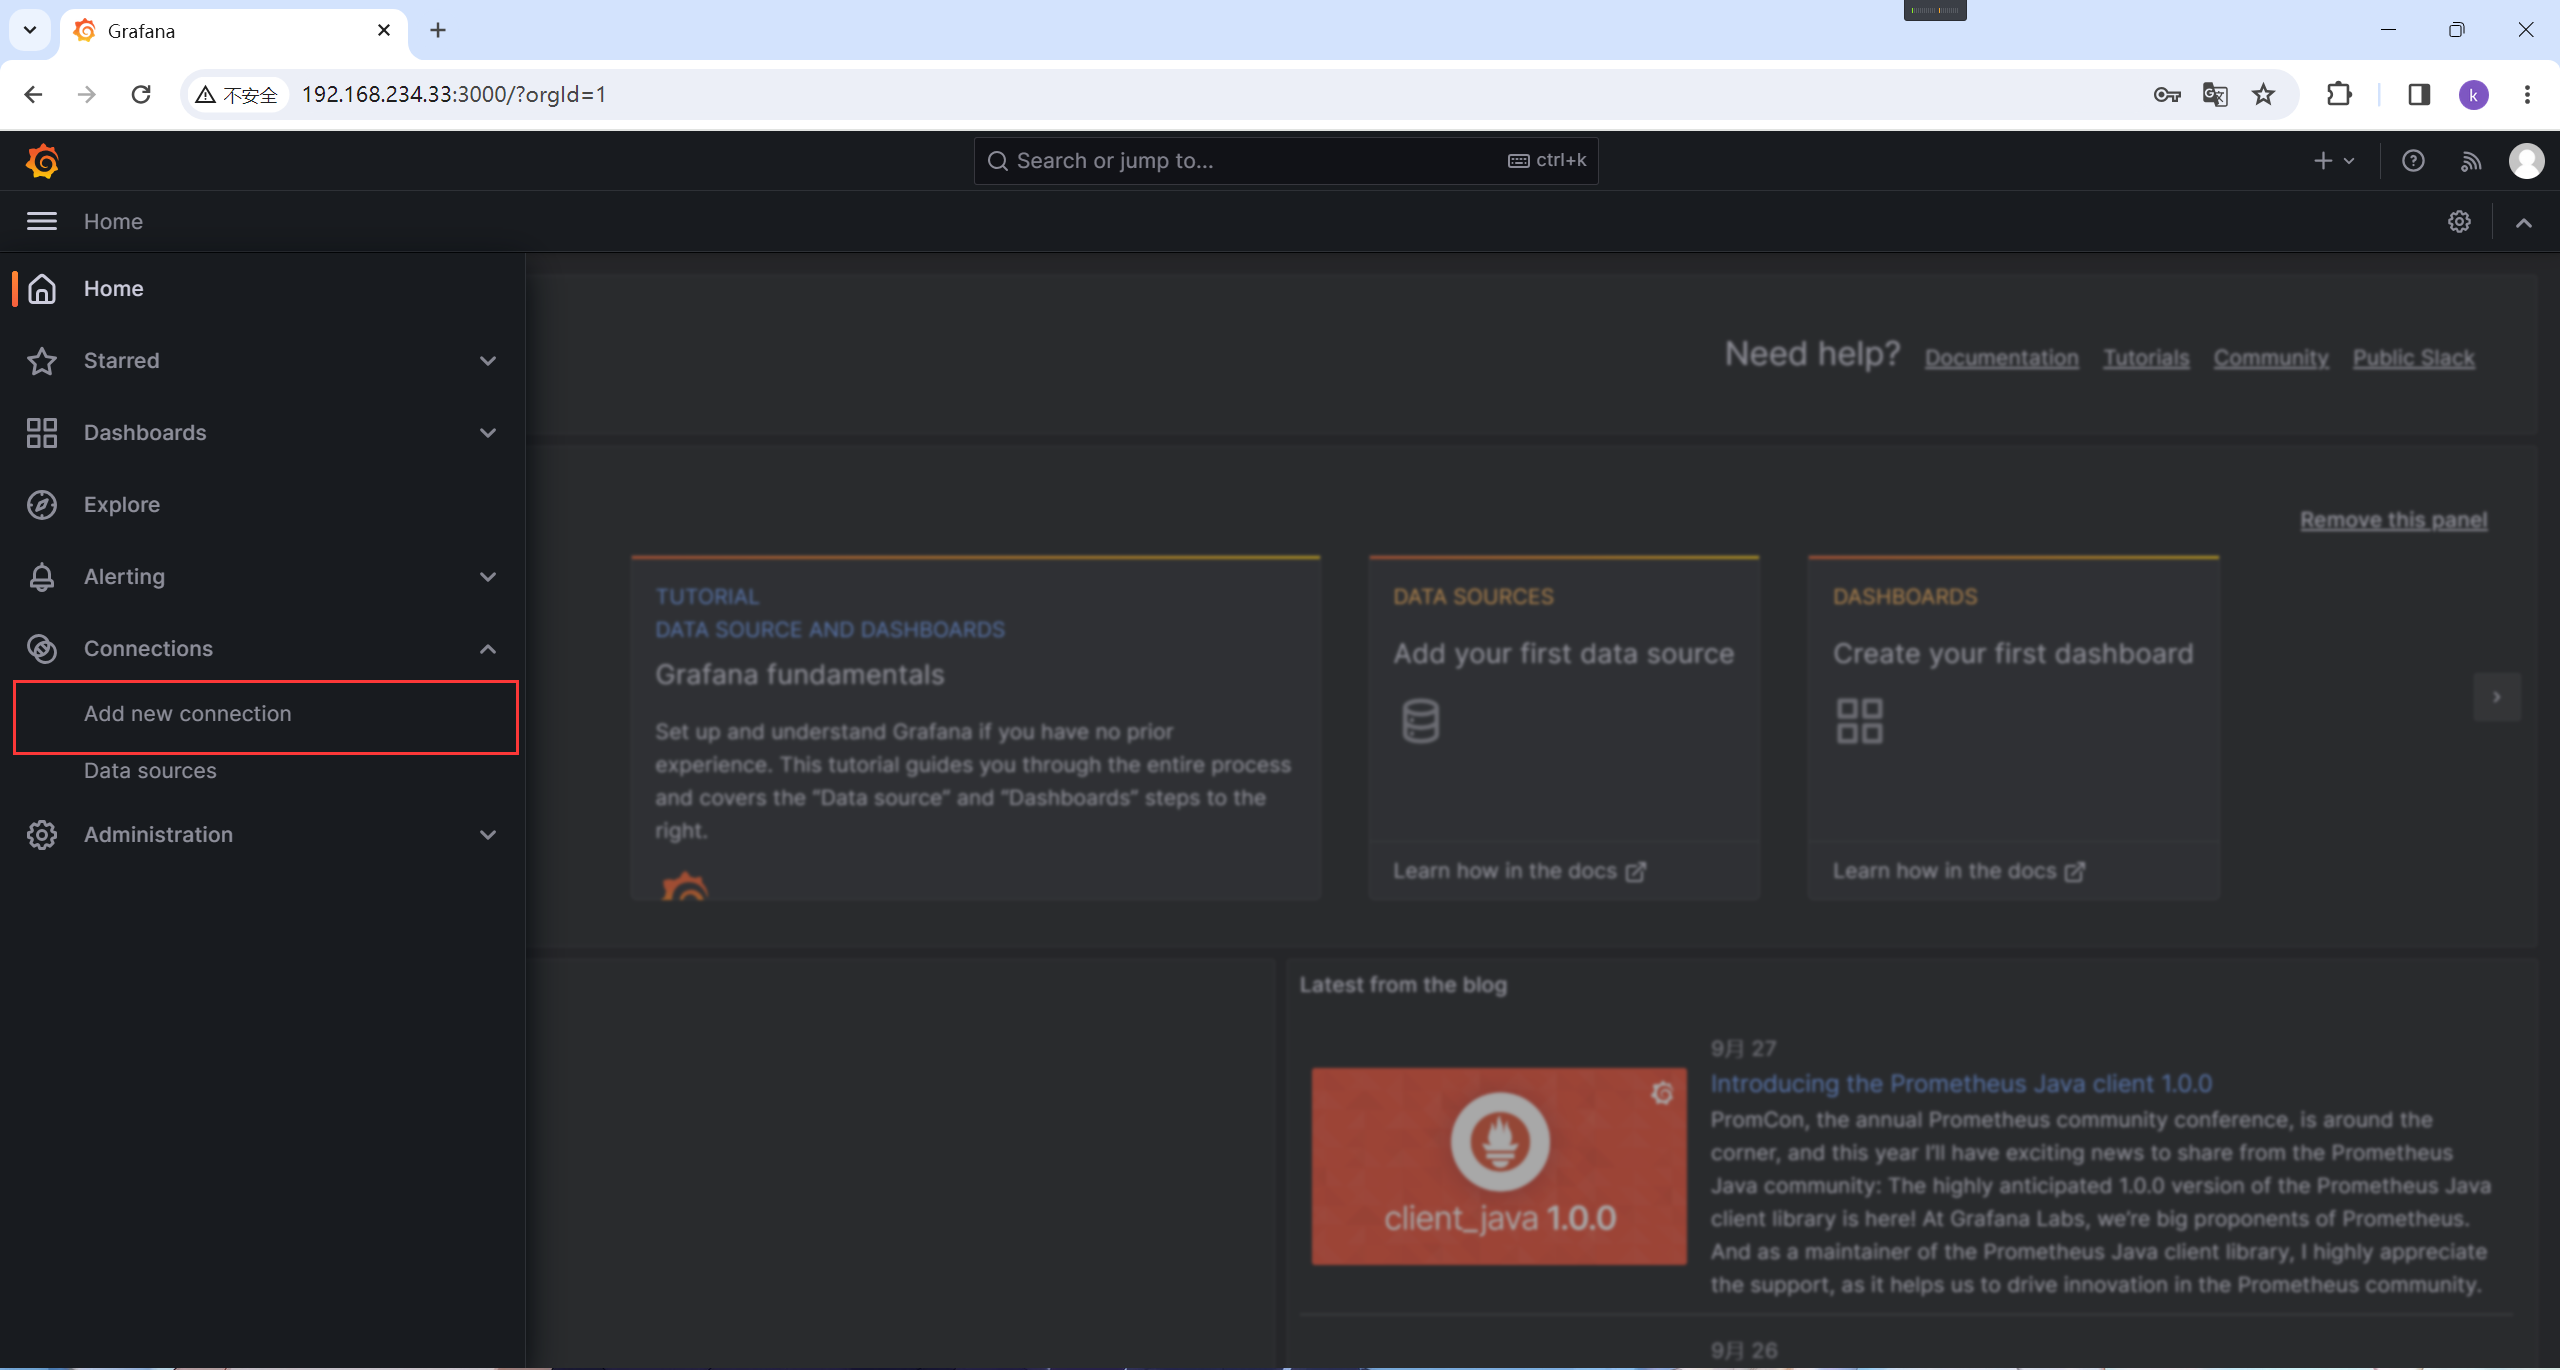
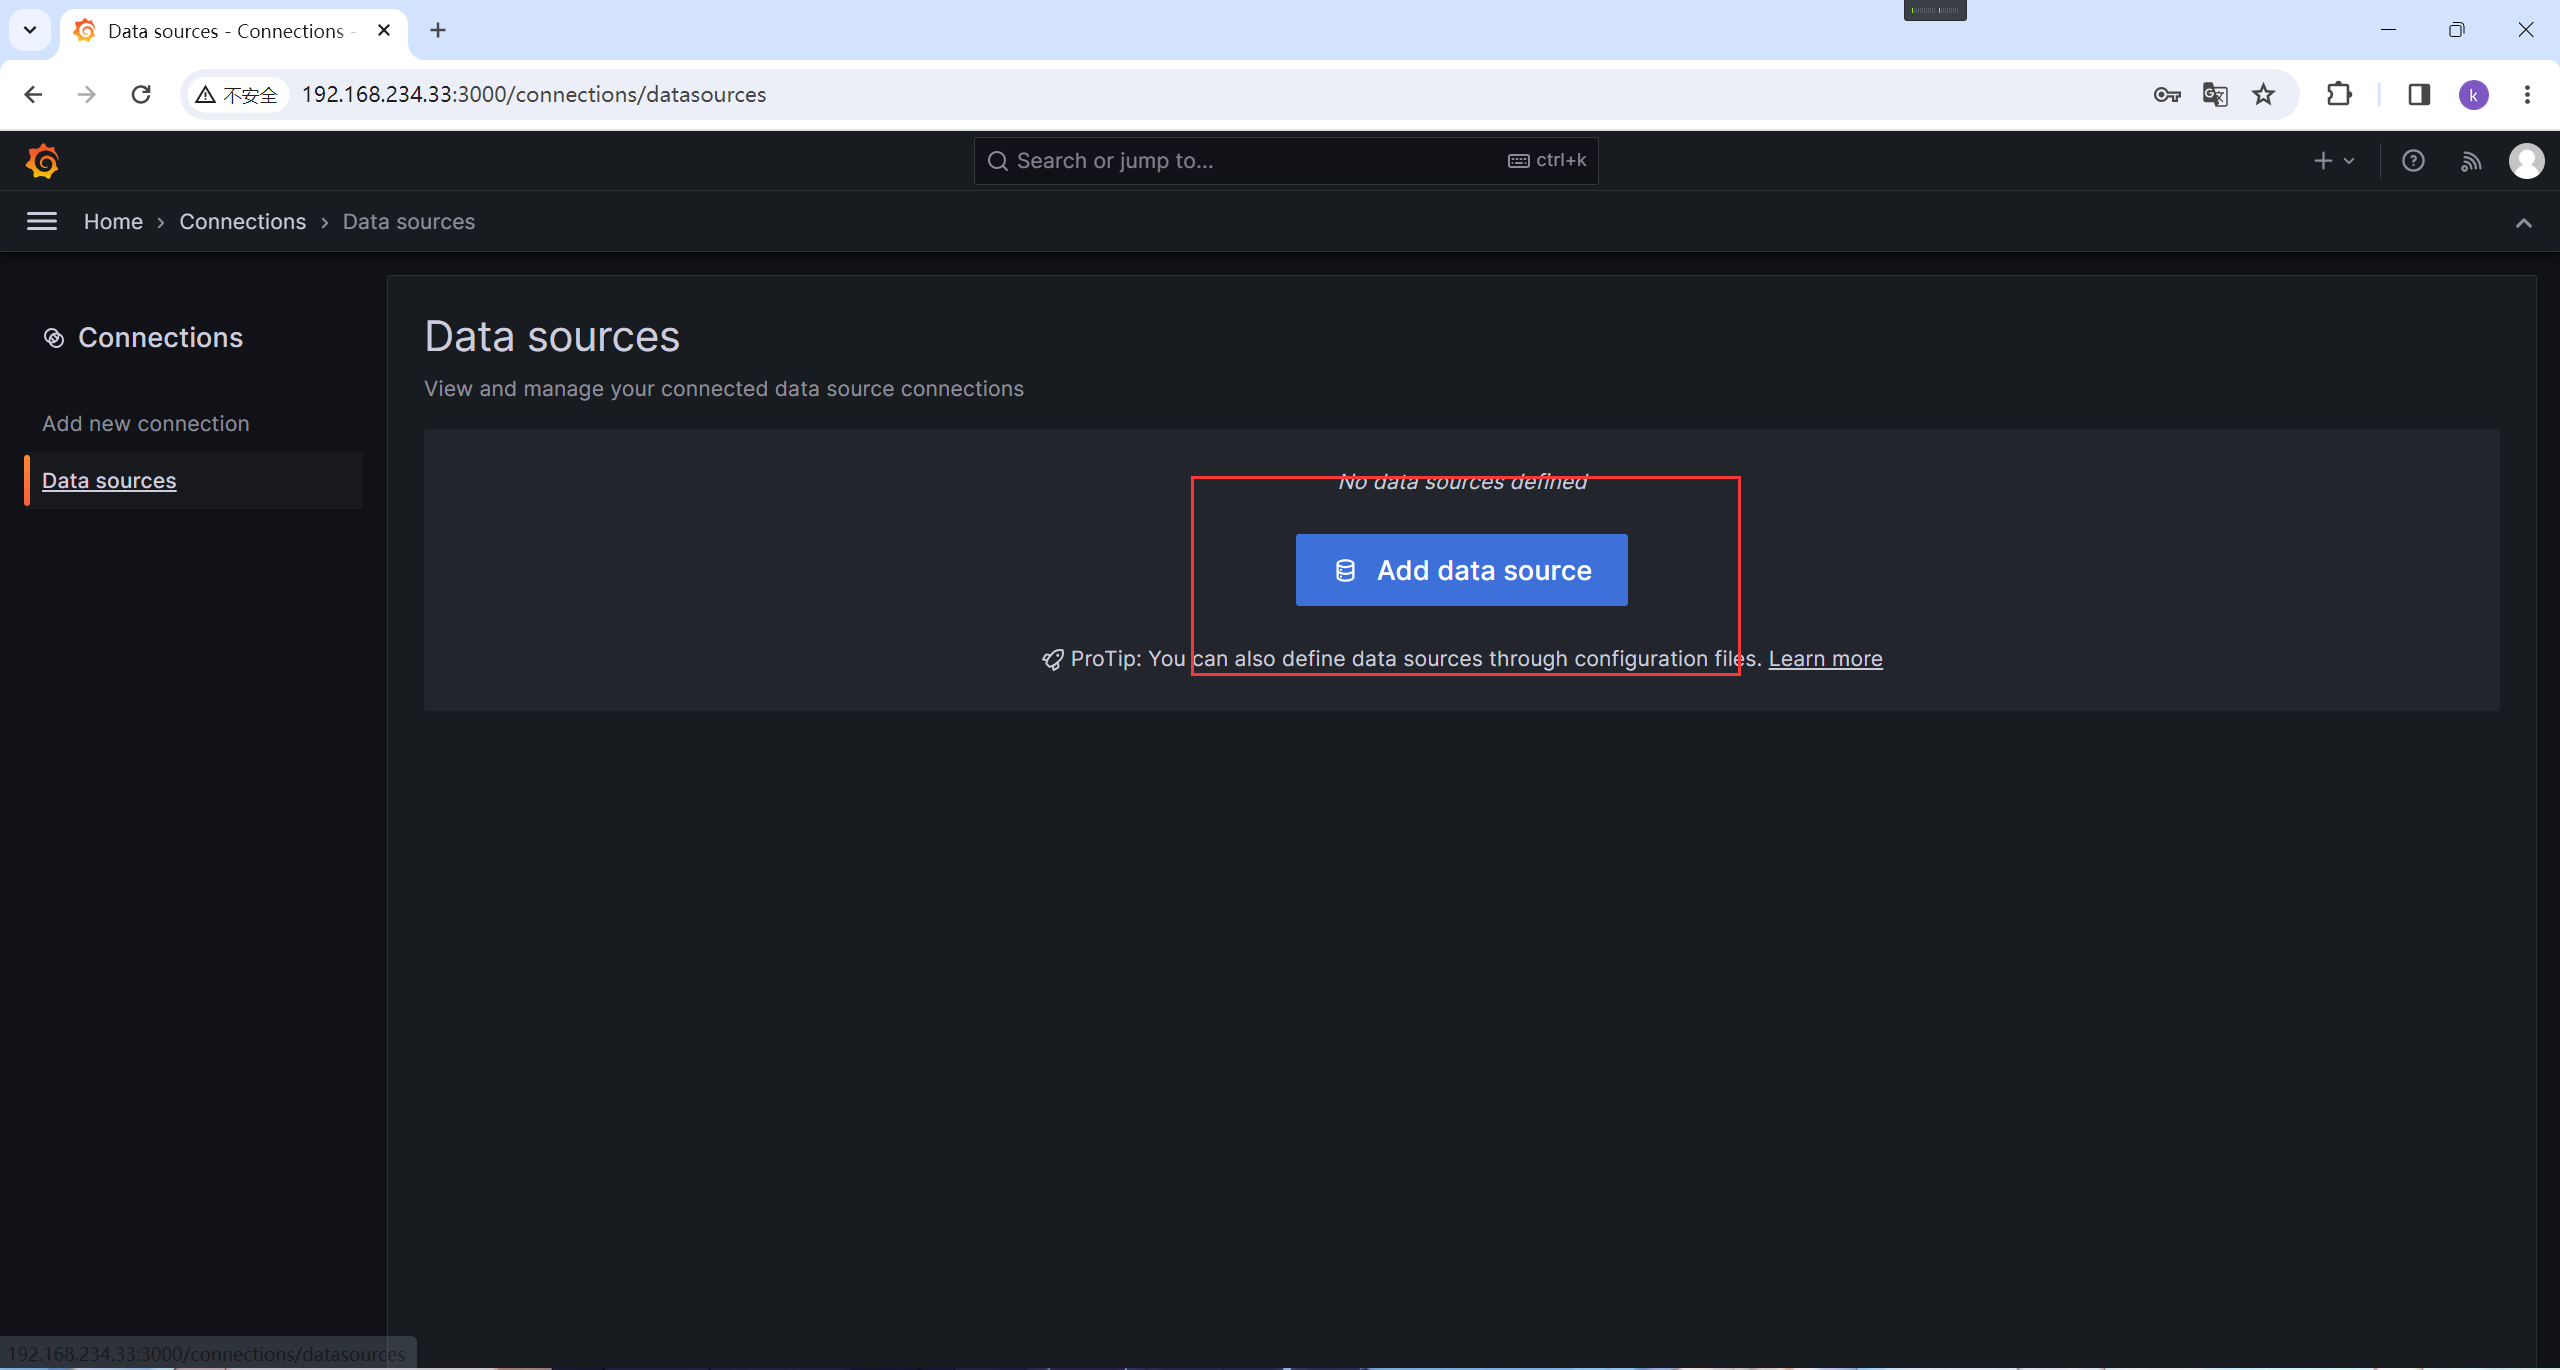
点击进去
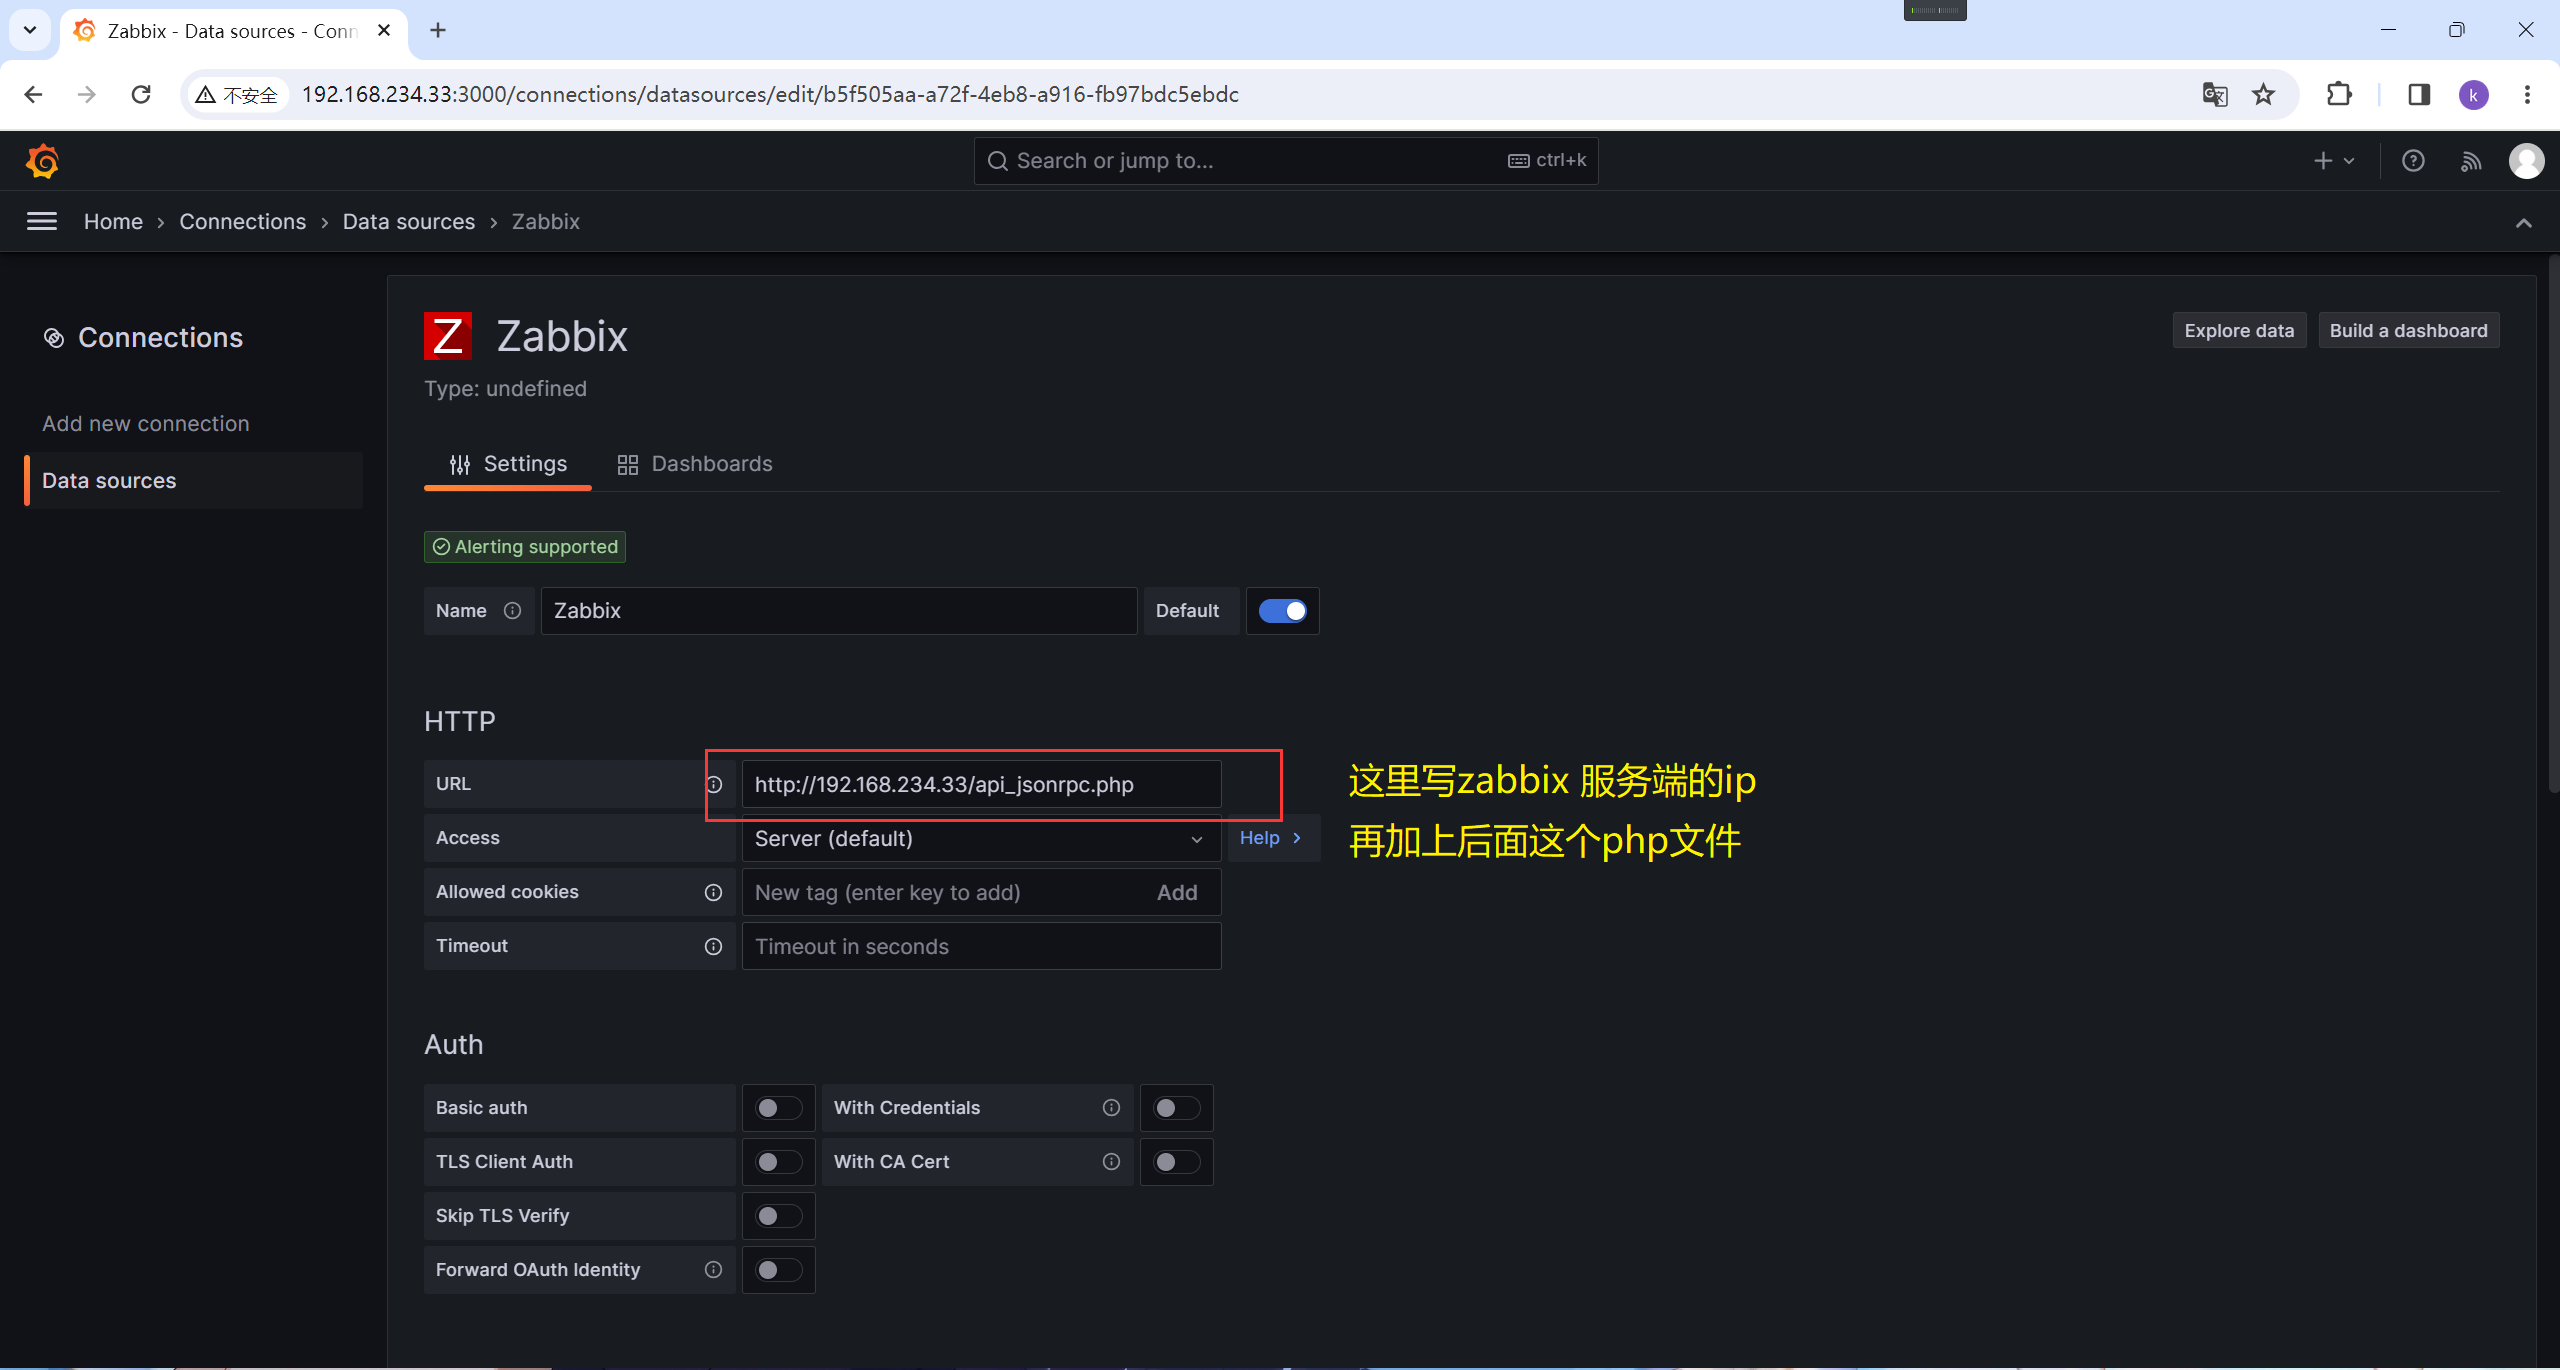
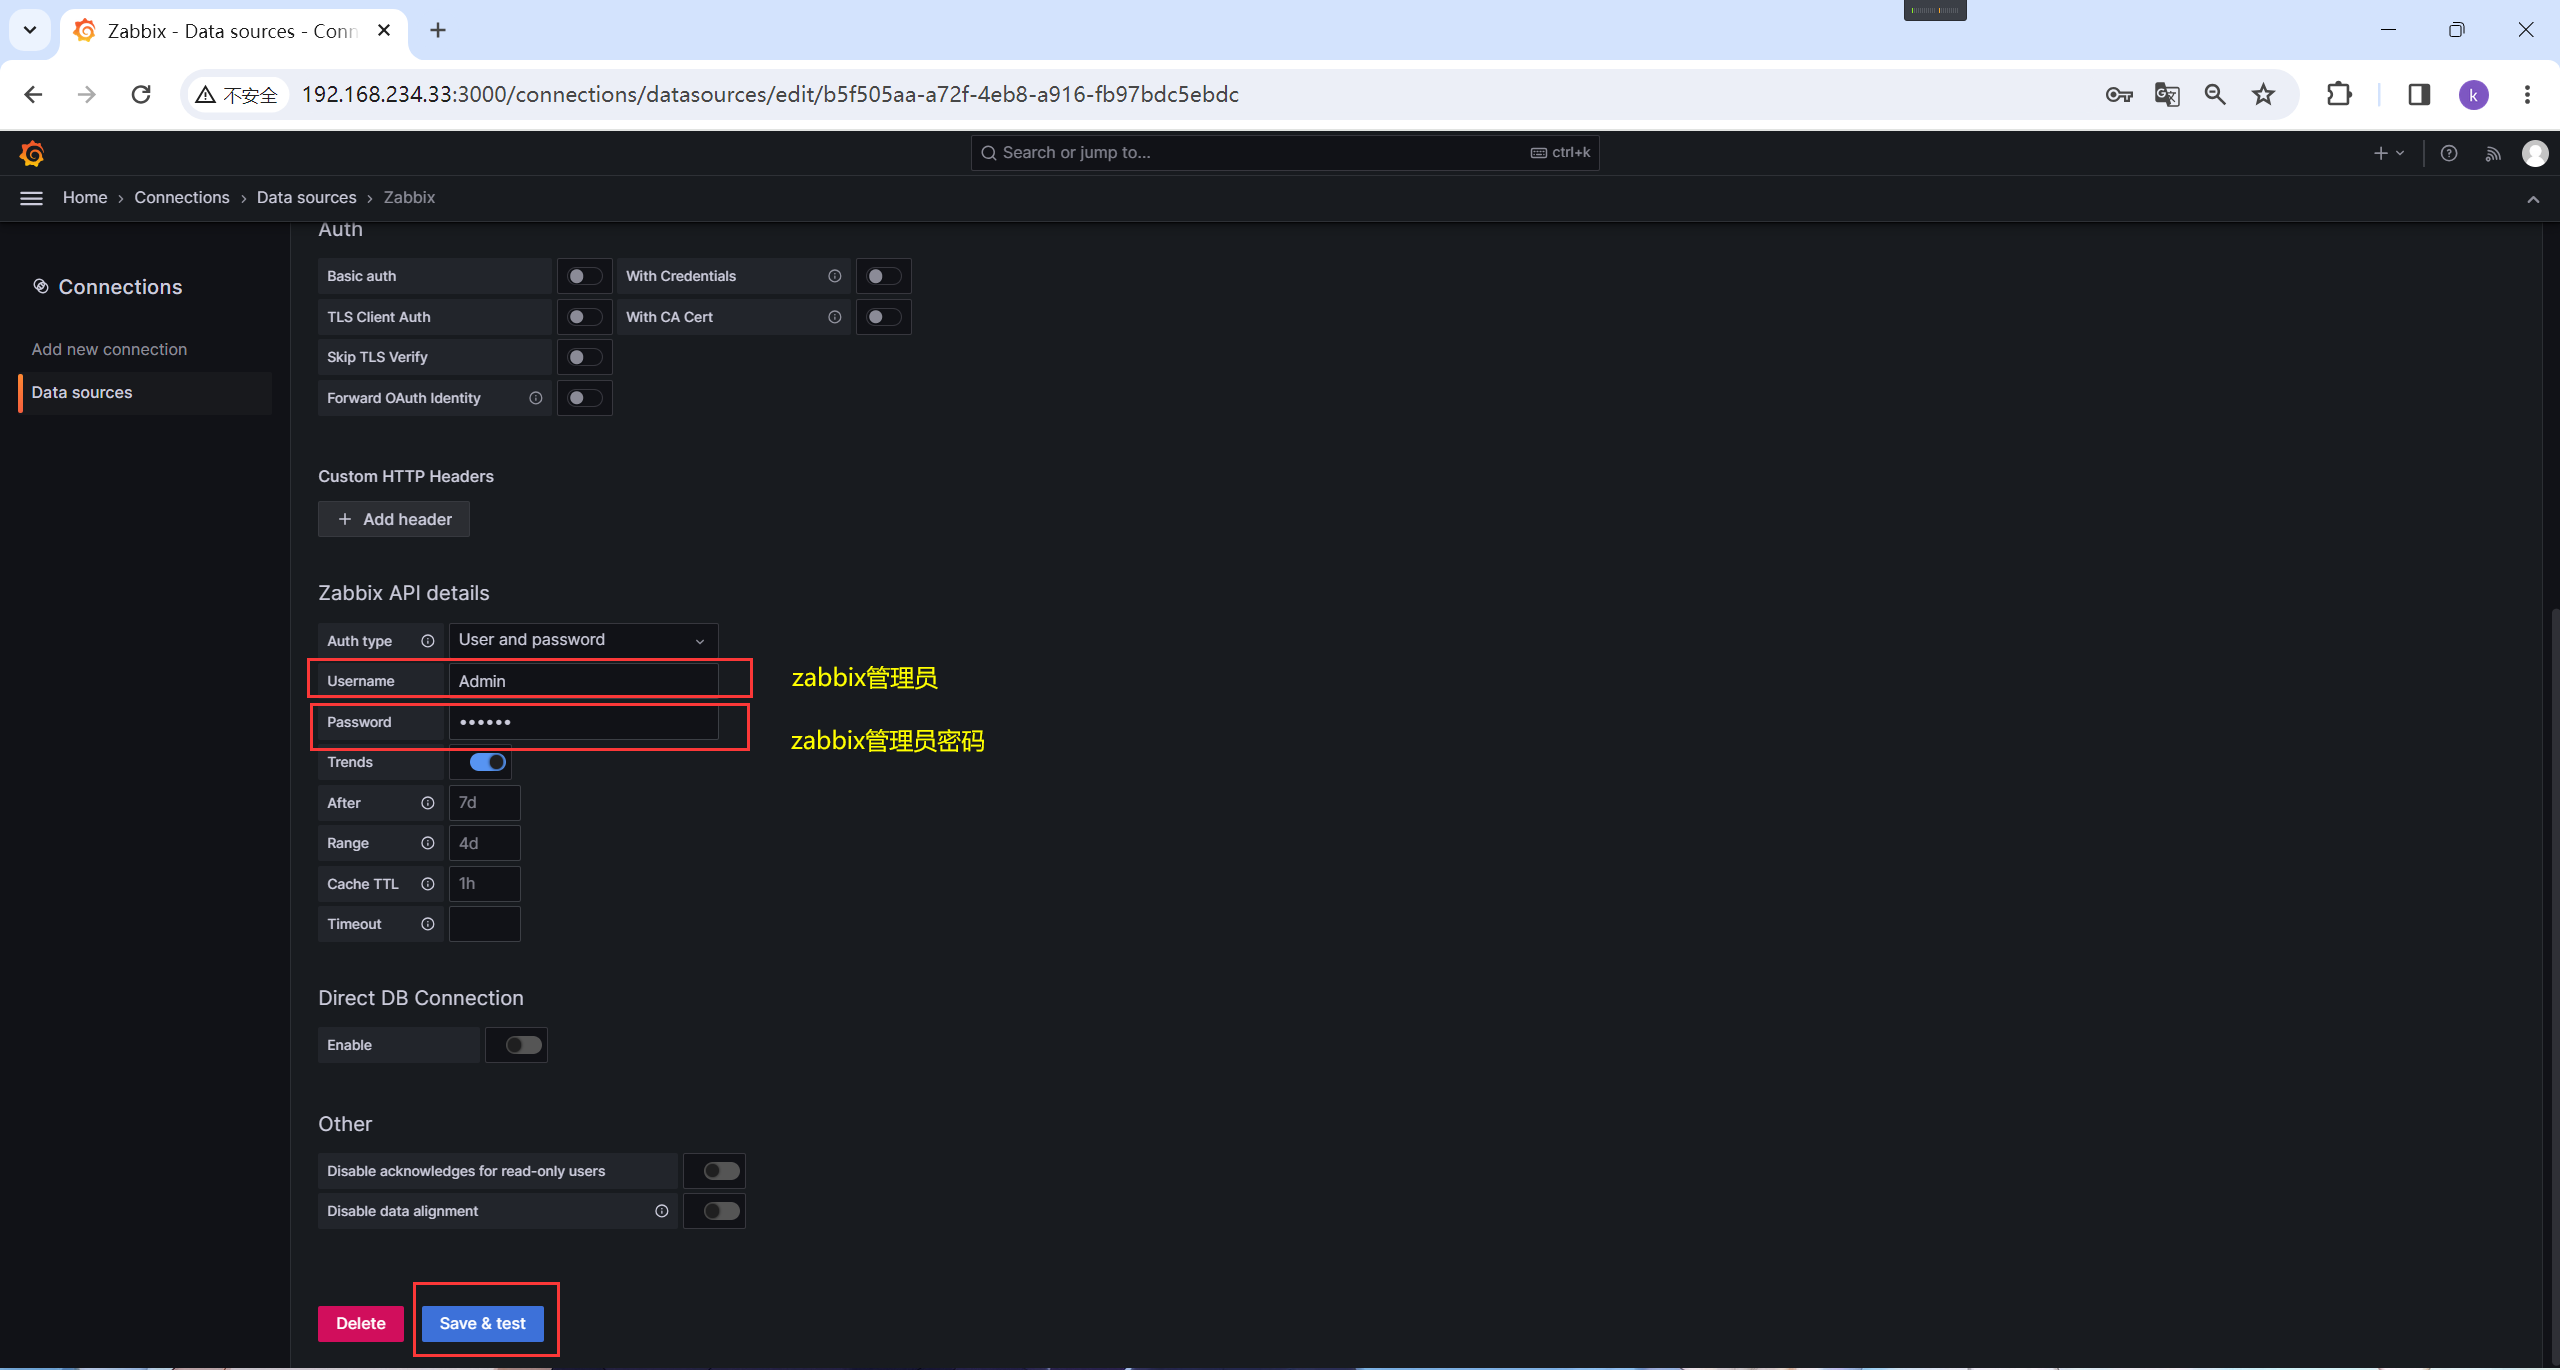
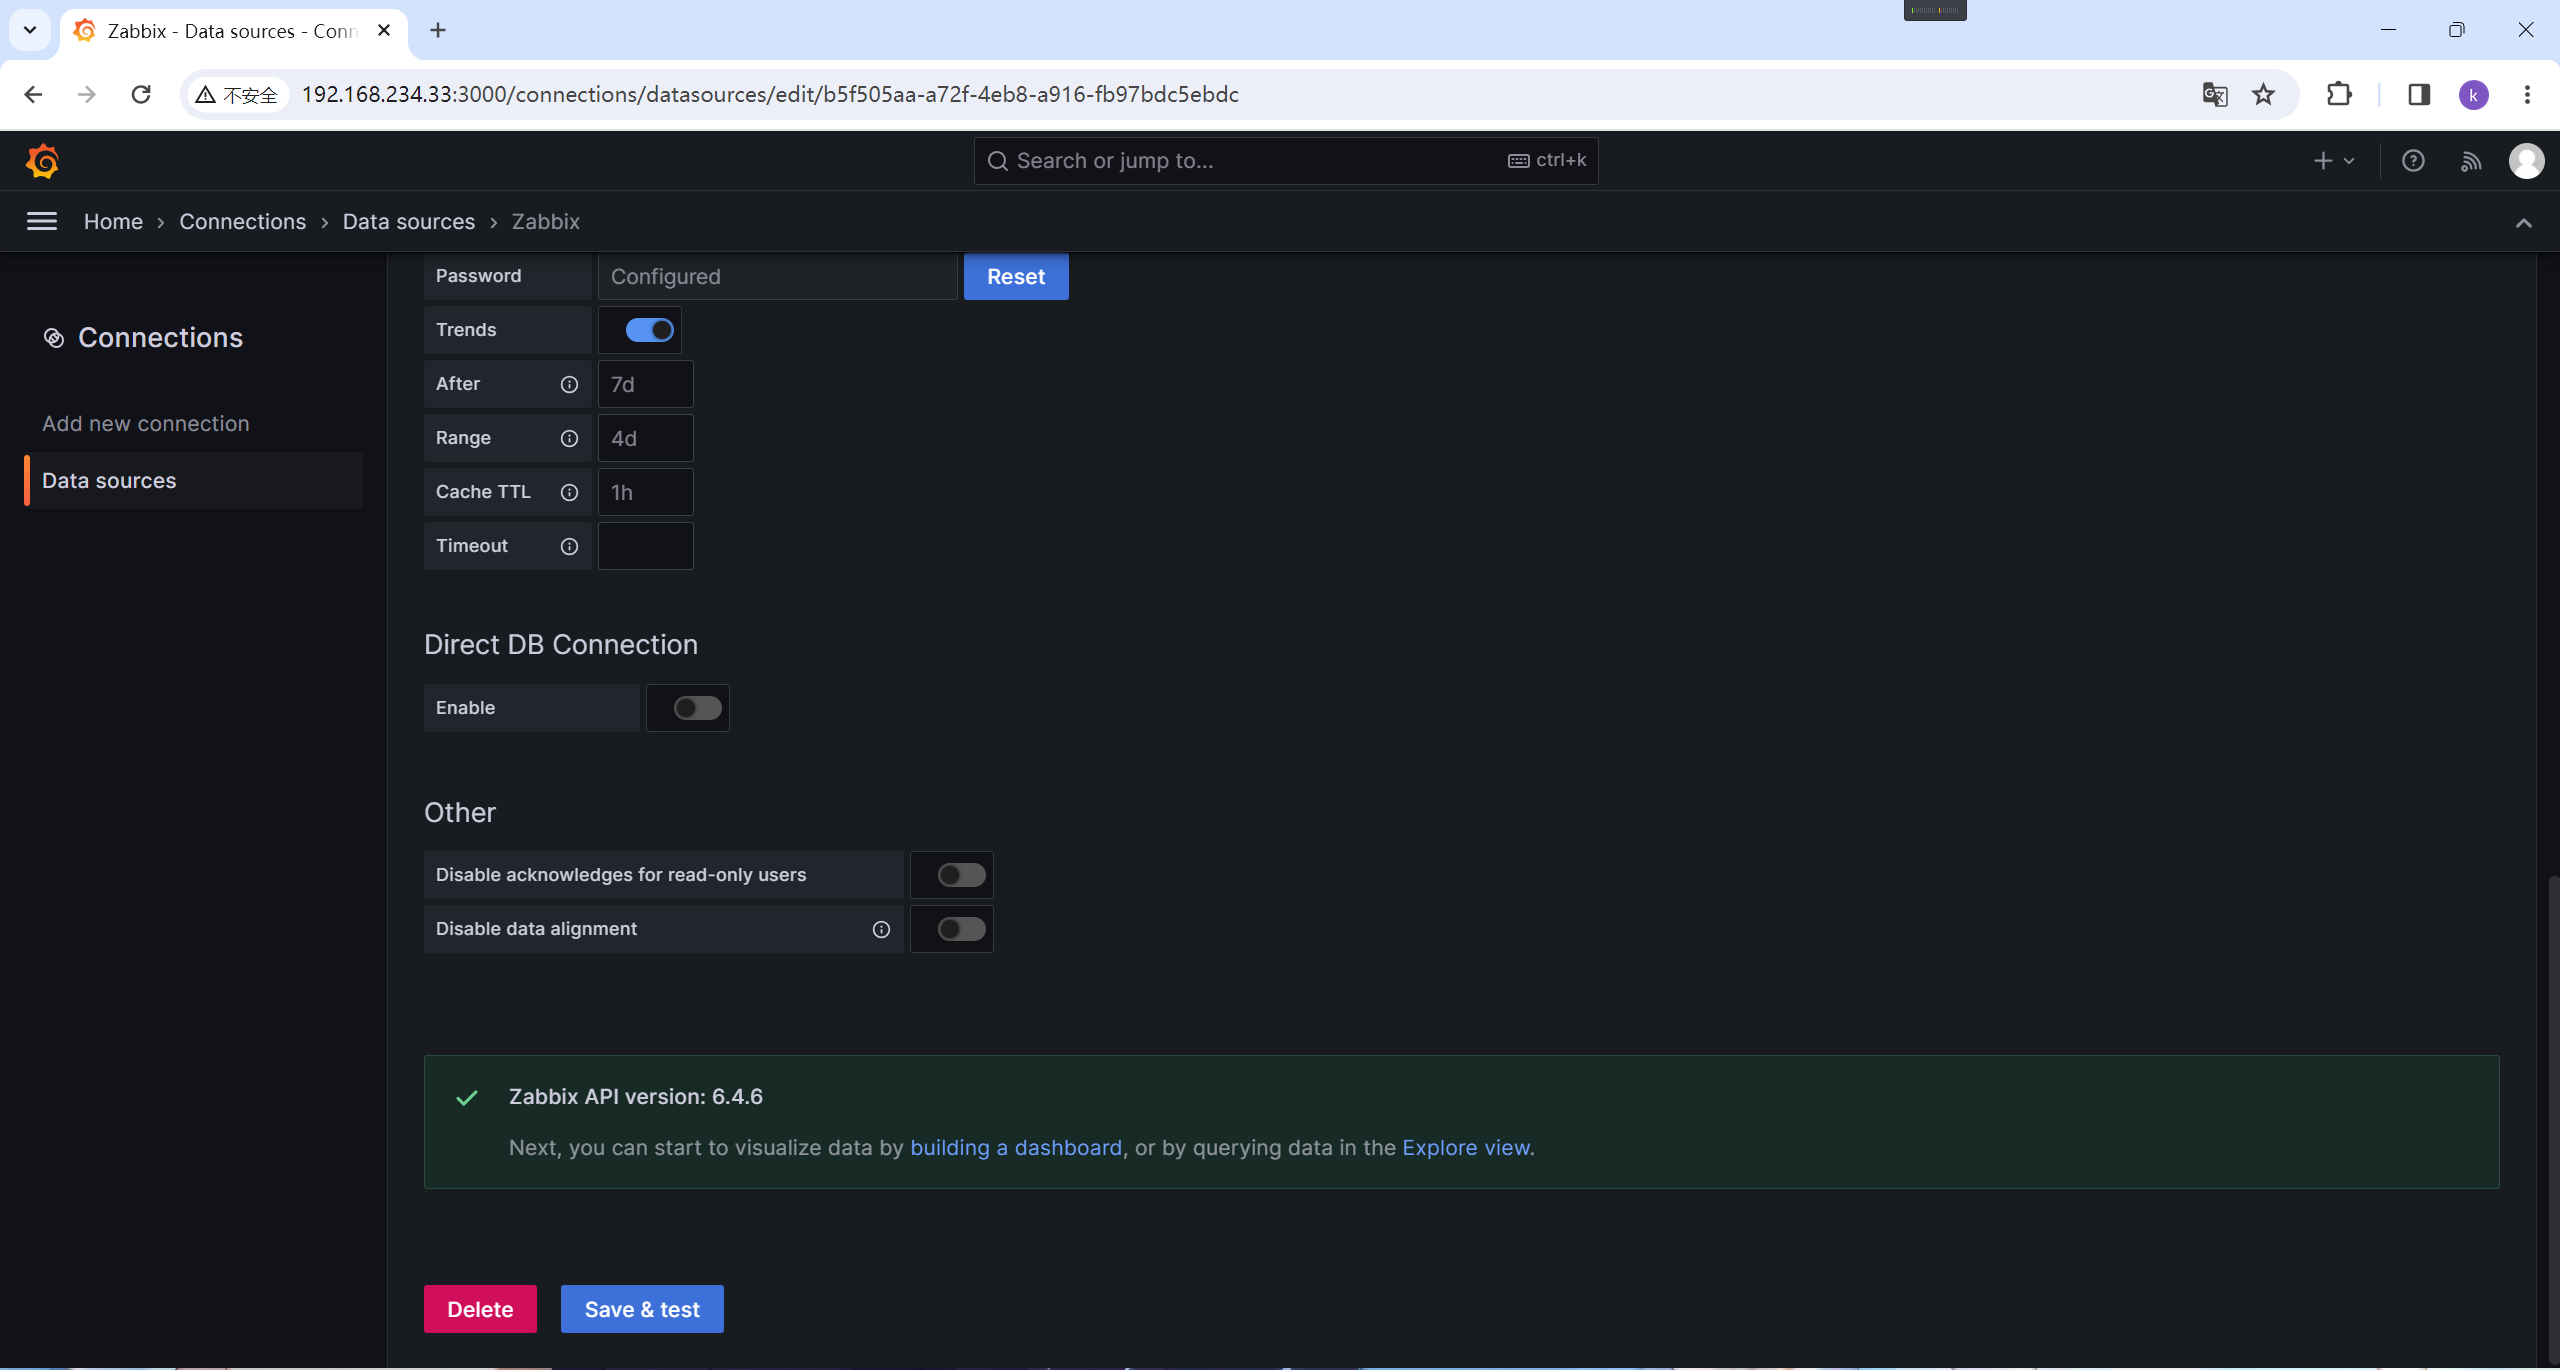
这样就是配置好了
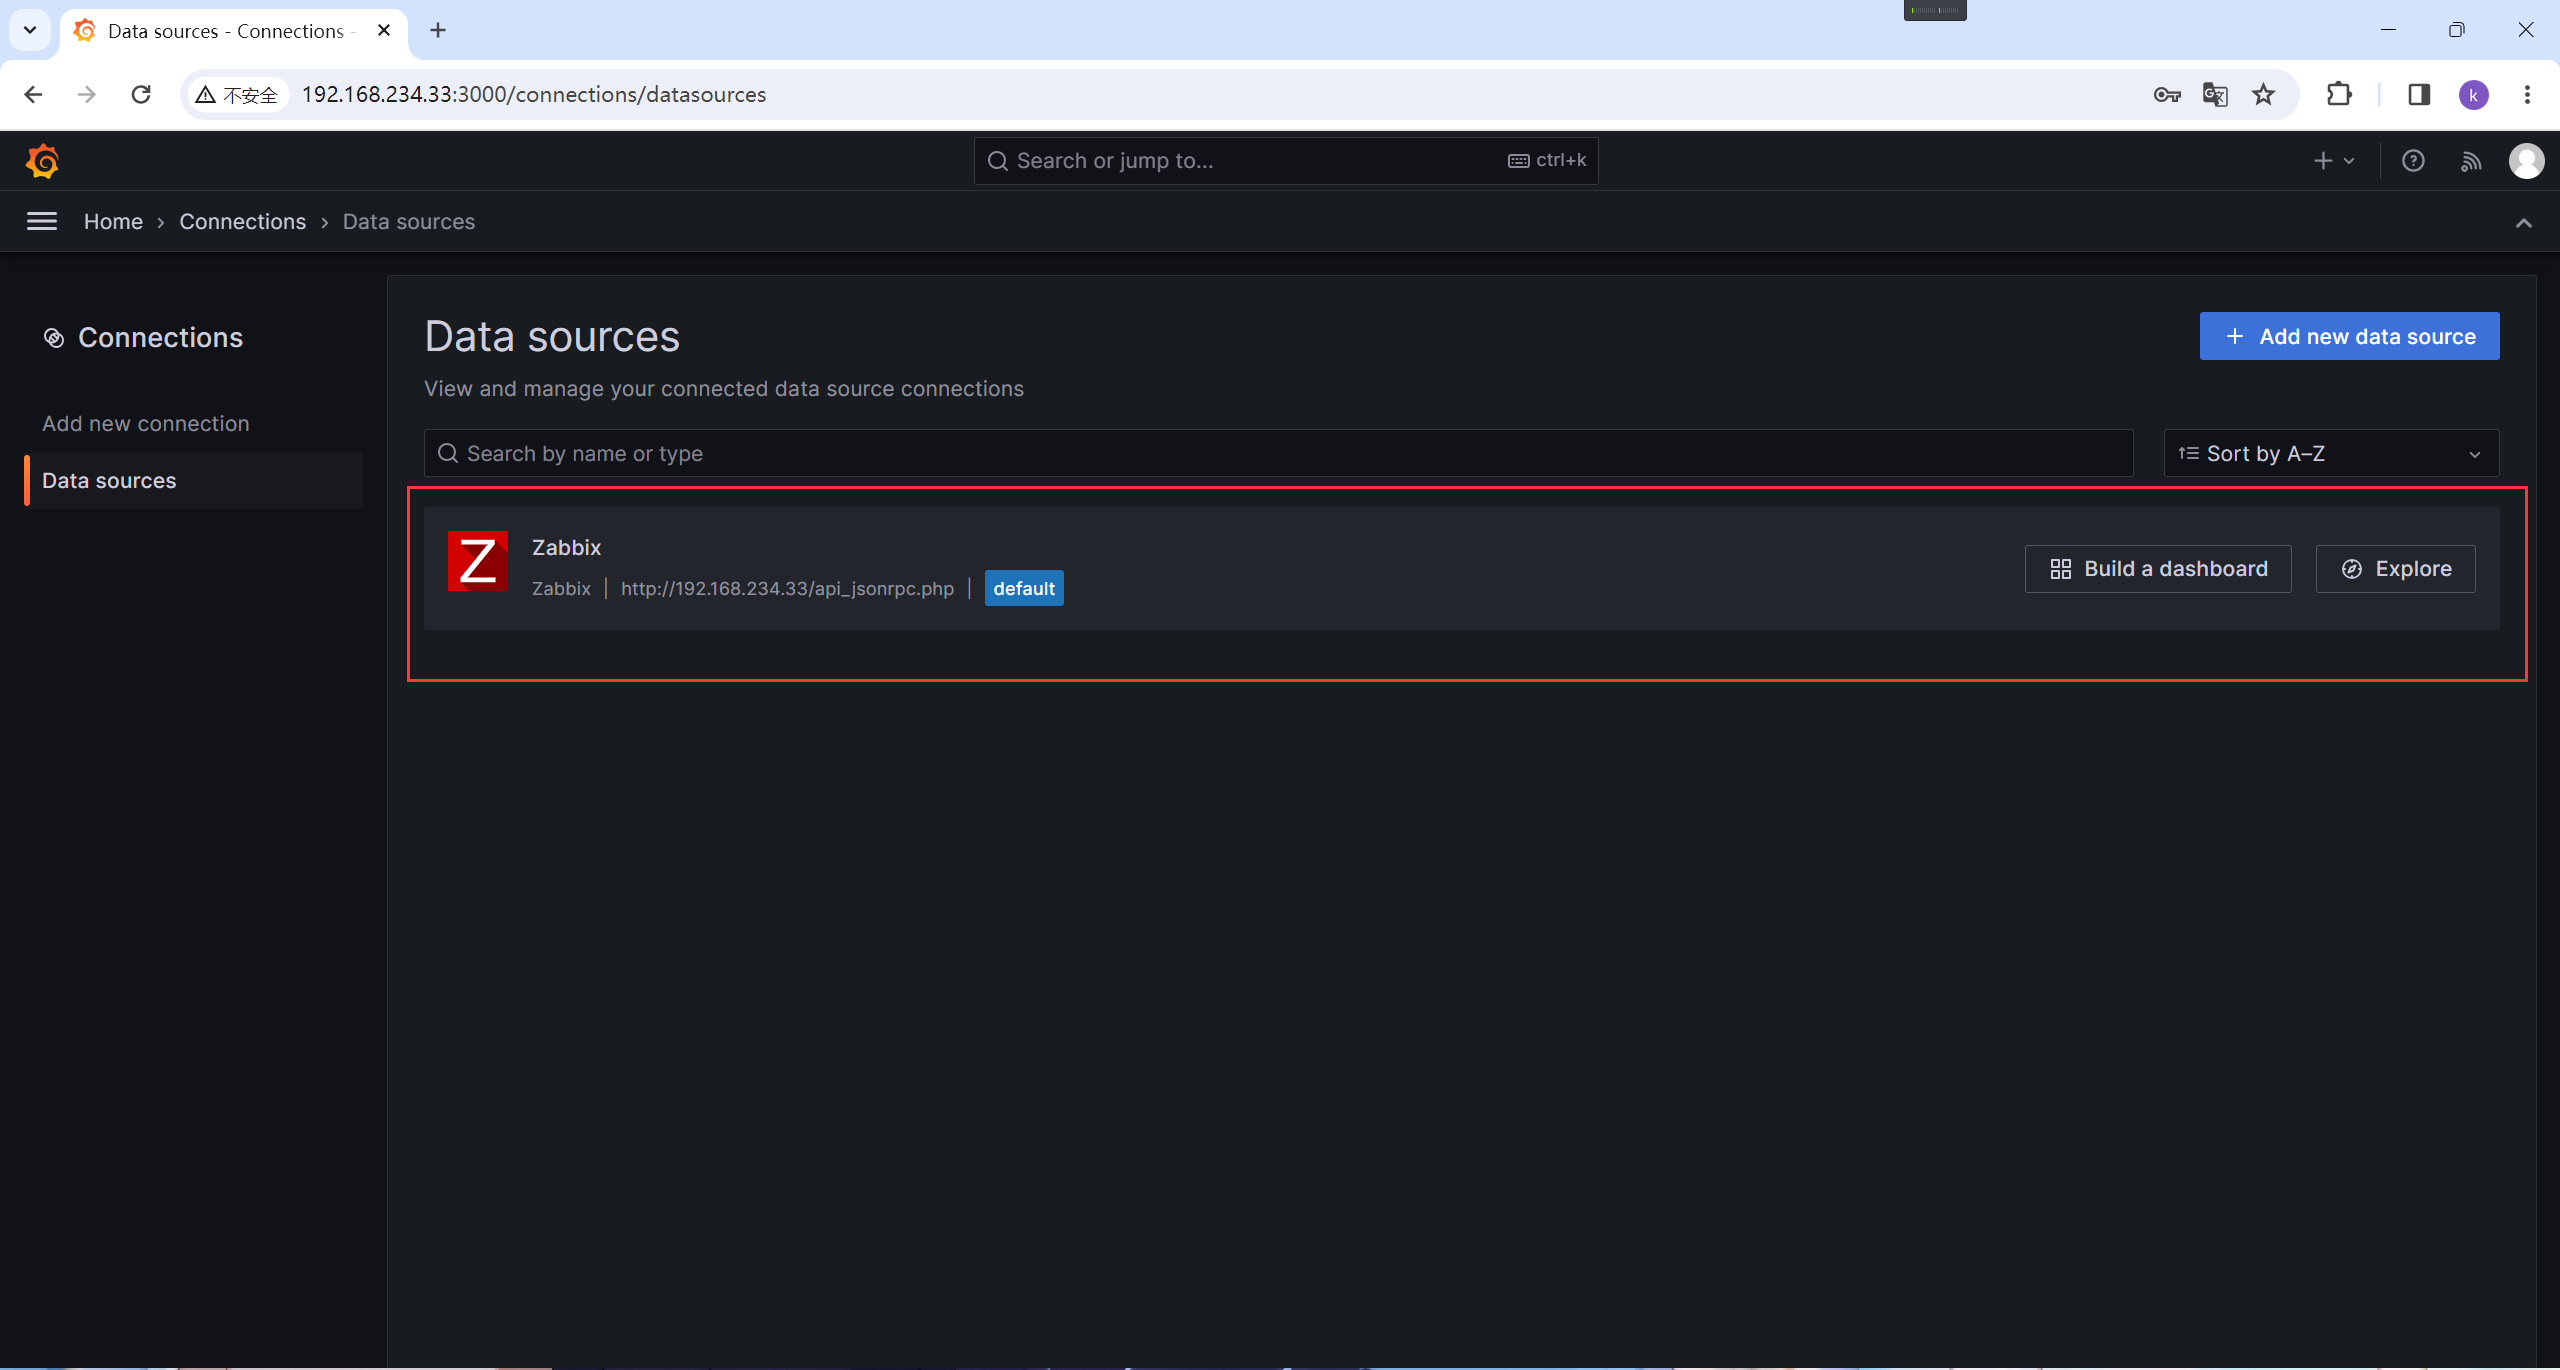
返回上一级,看到有这就表示创建成功
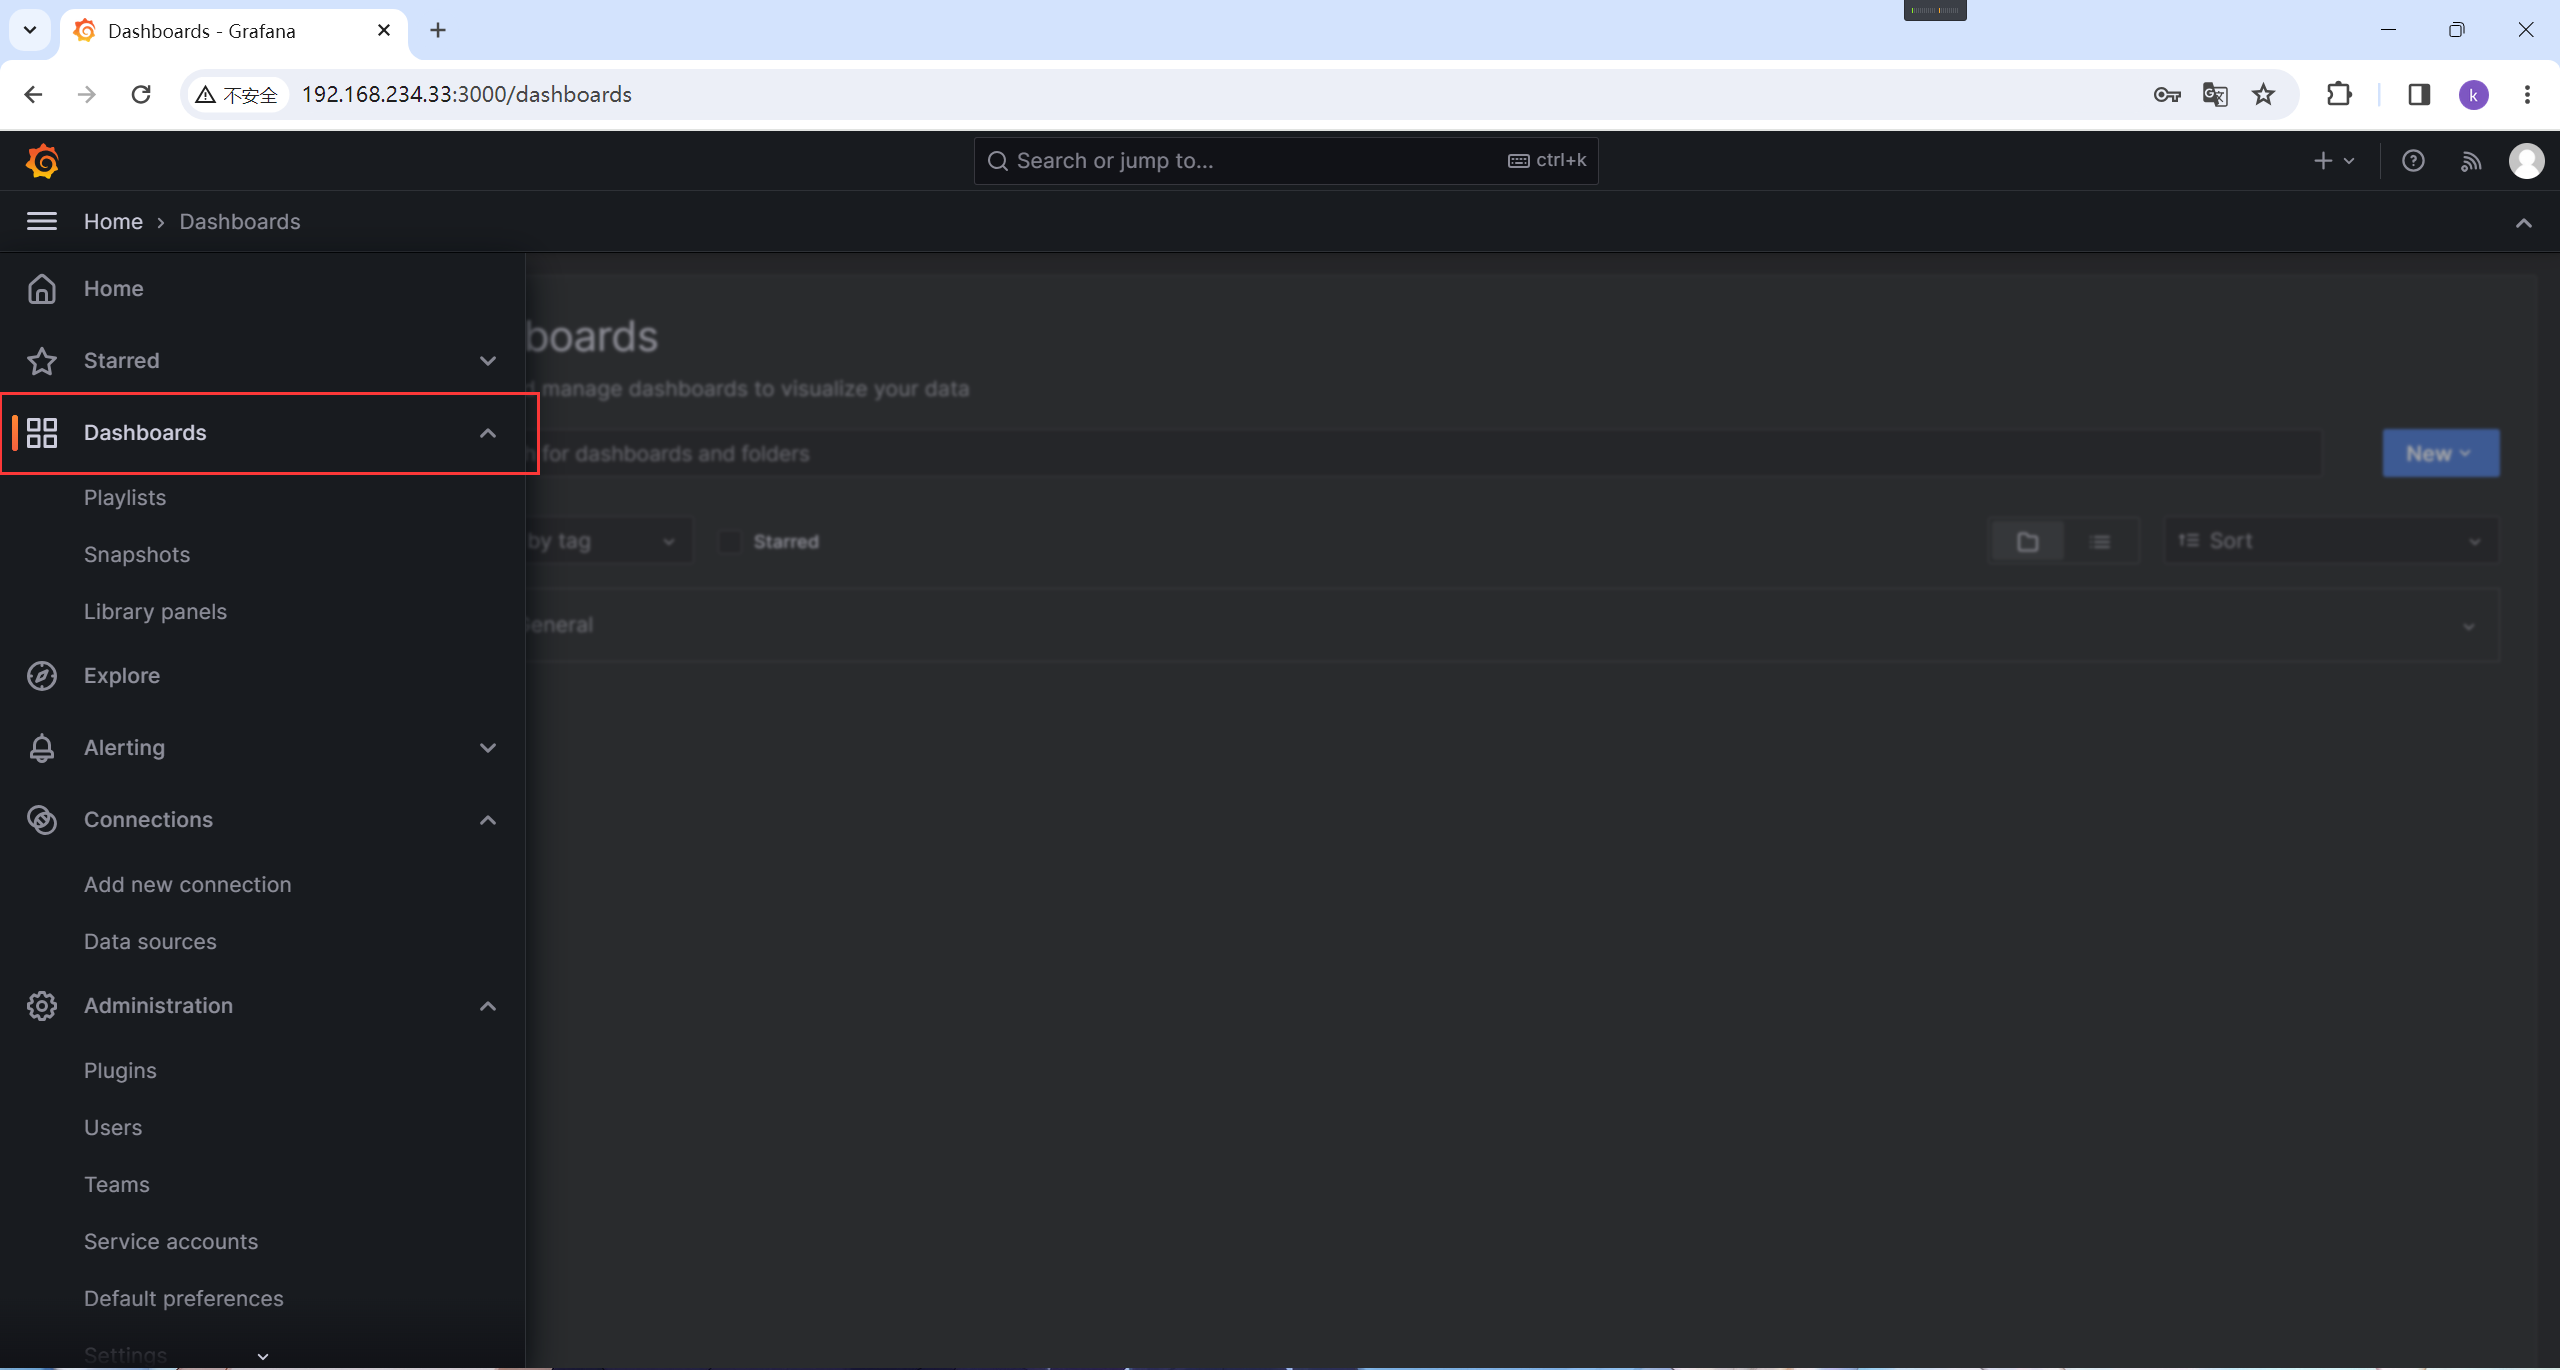
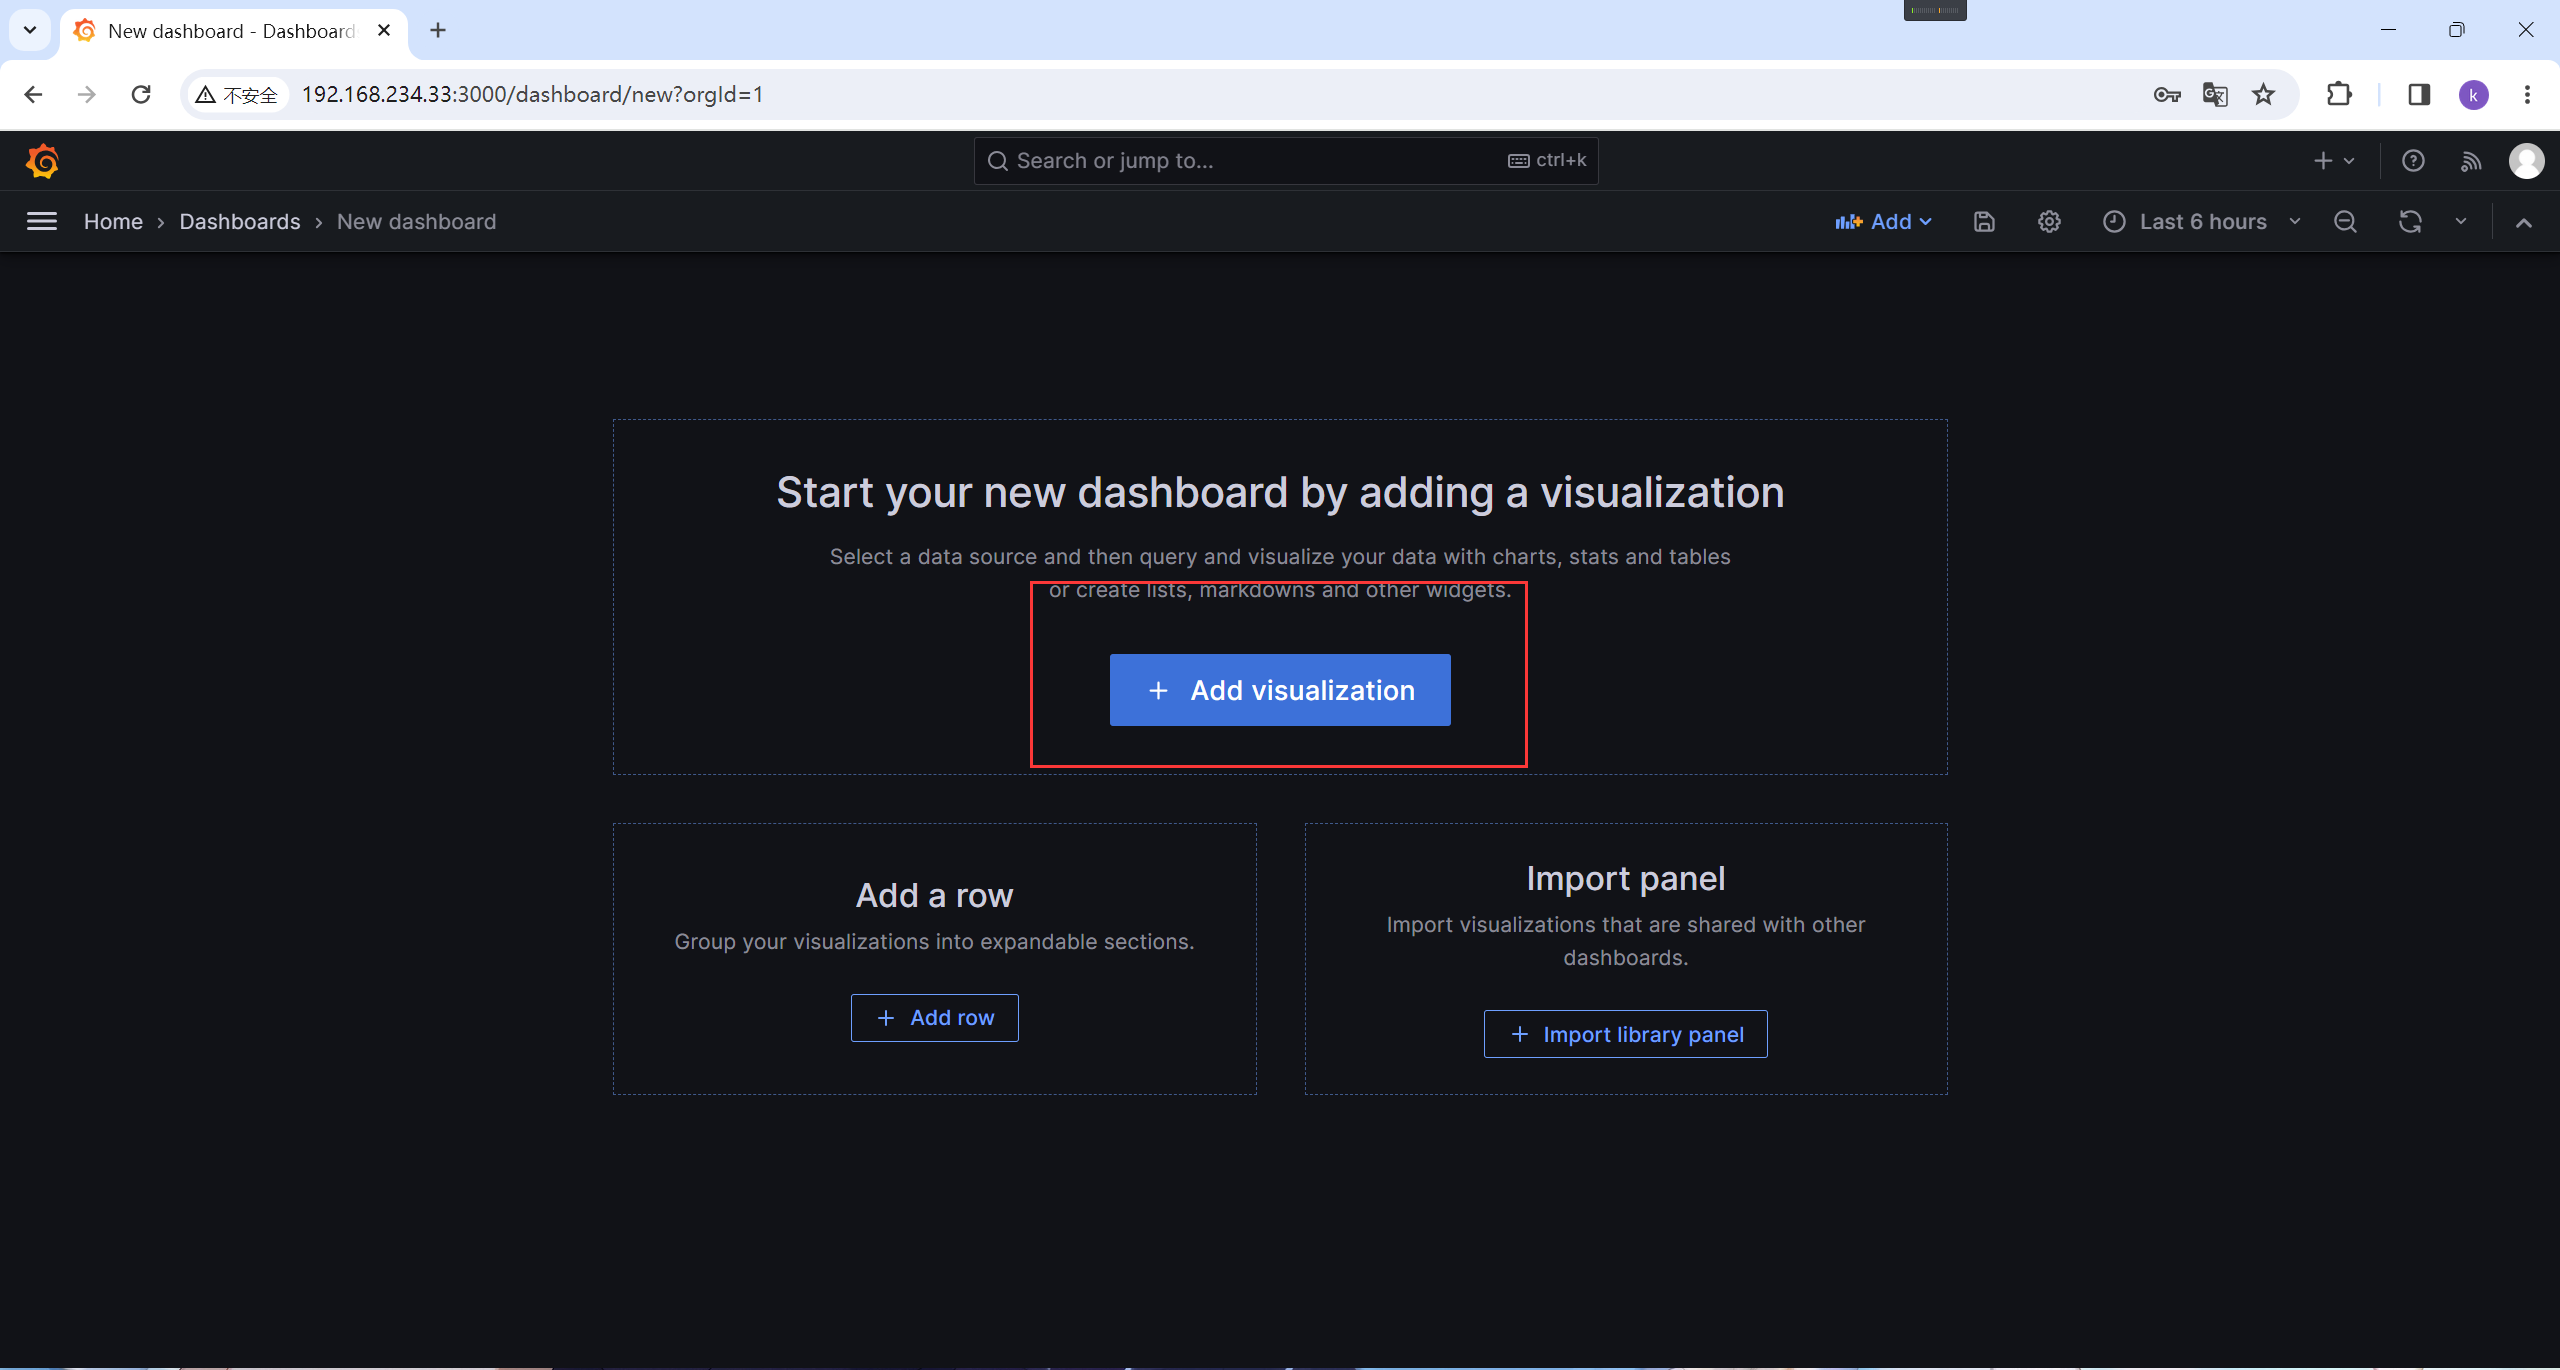
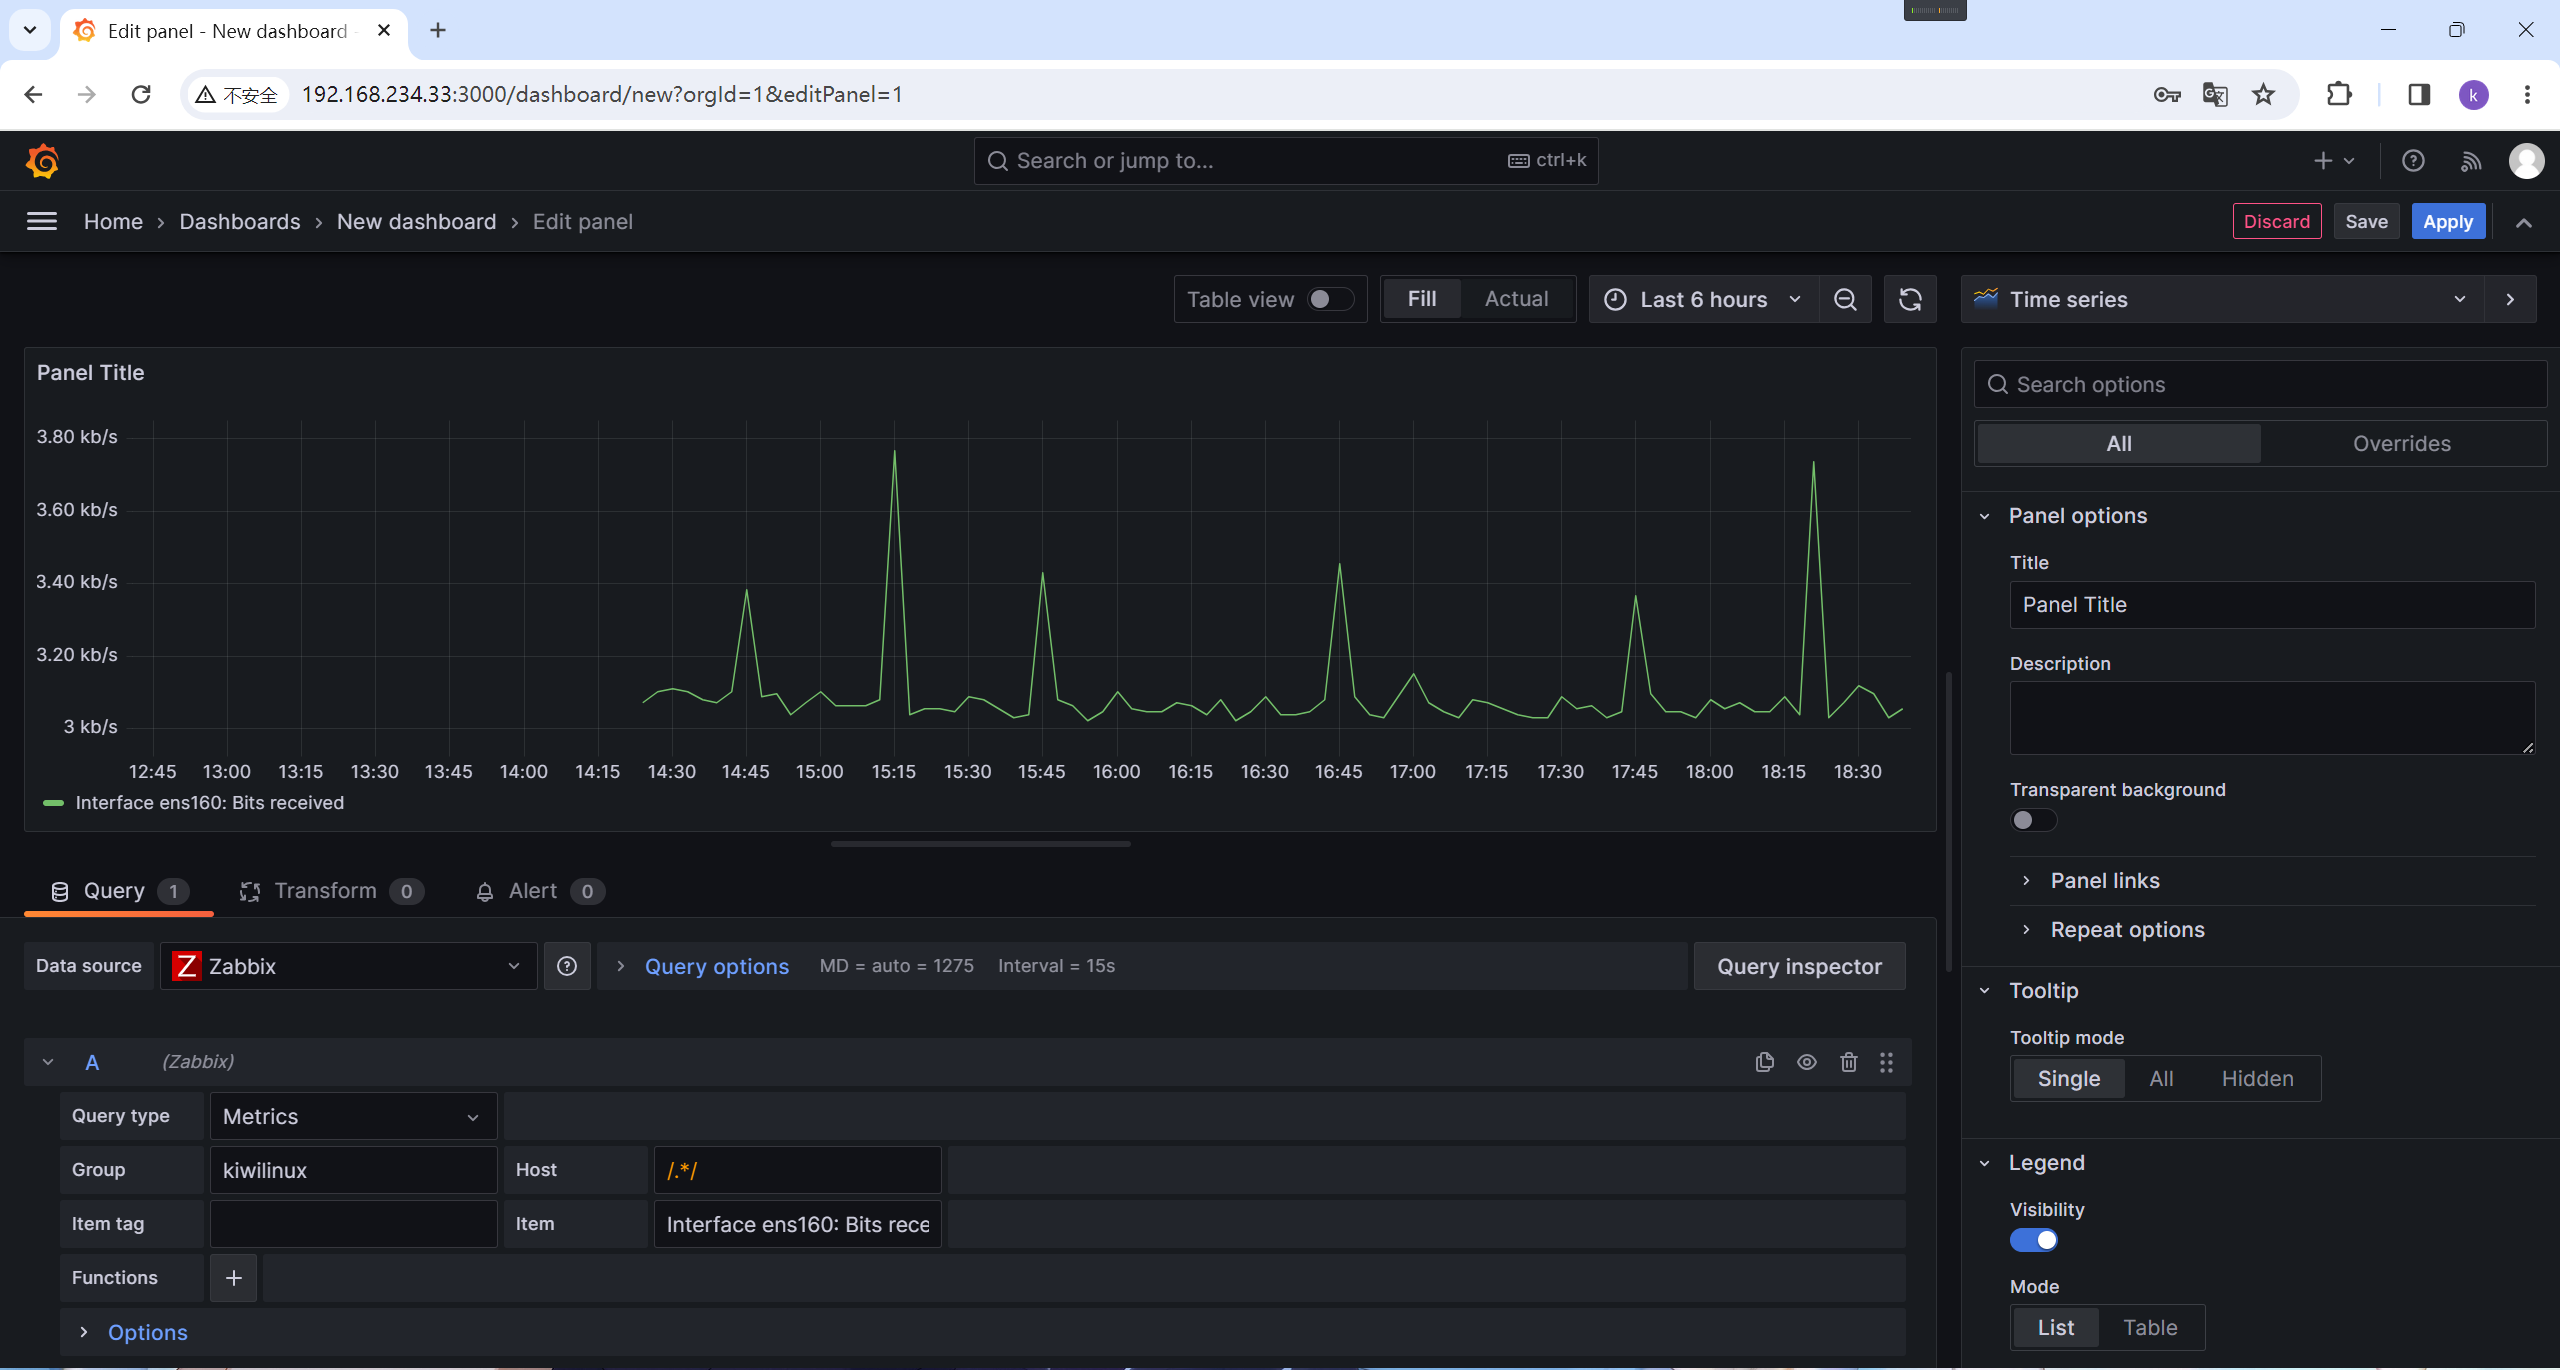
2.5 在web端添加监控图表
点击Dashboards
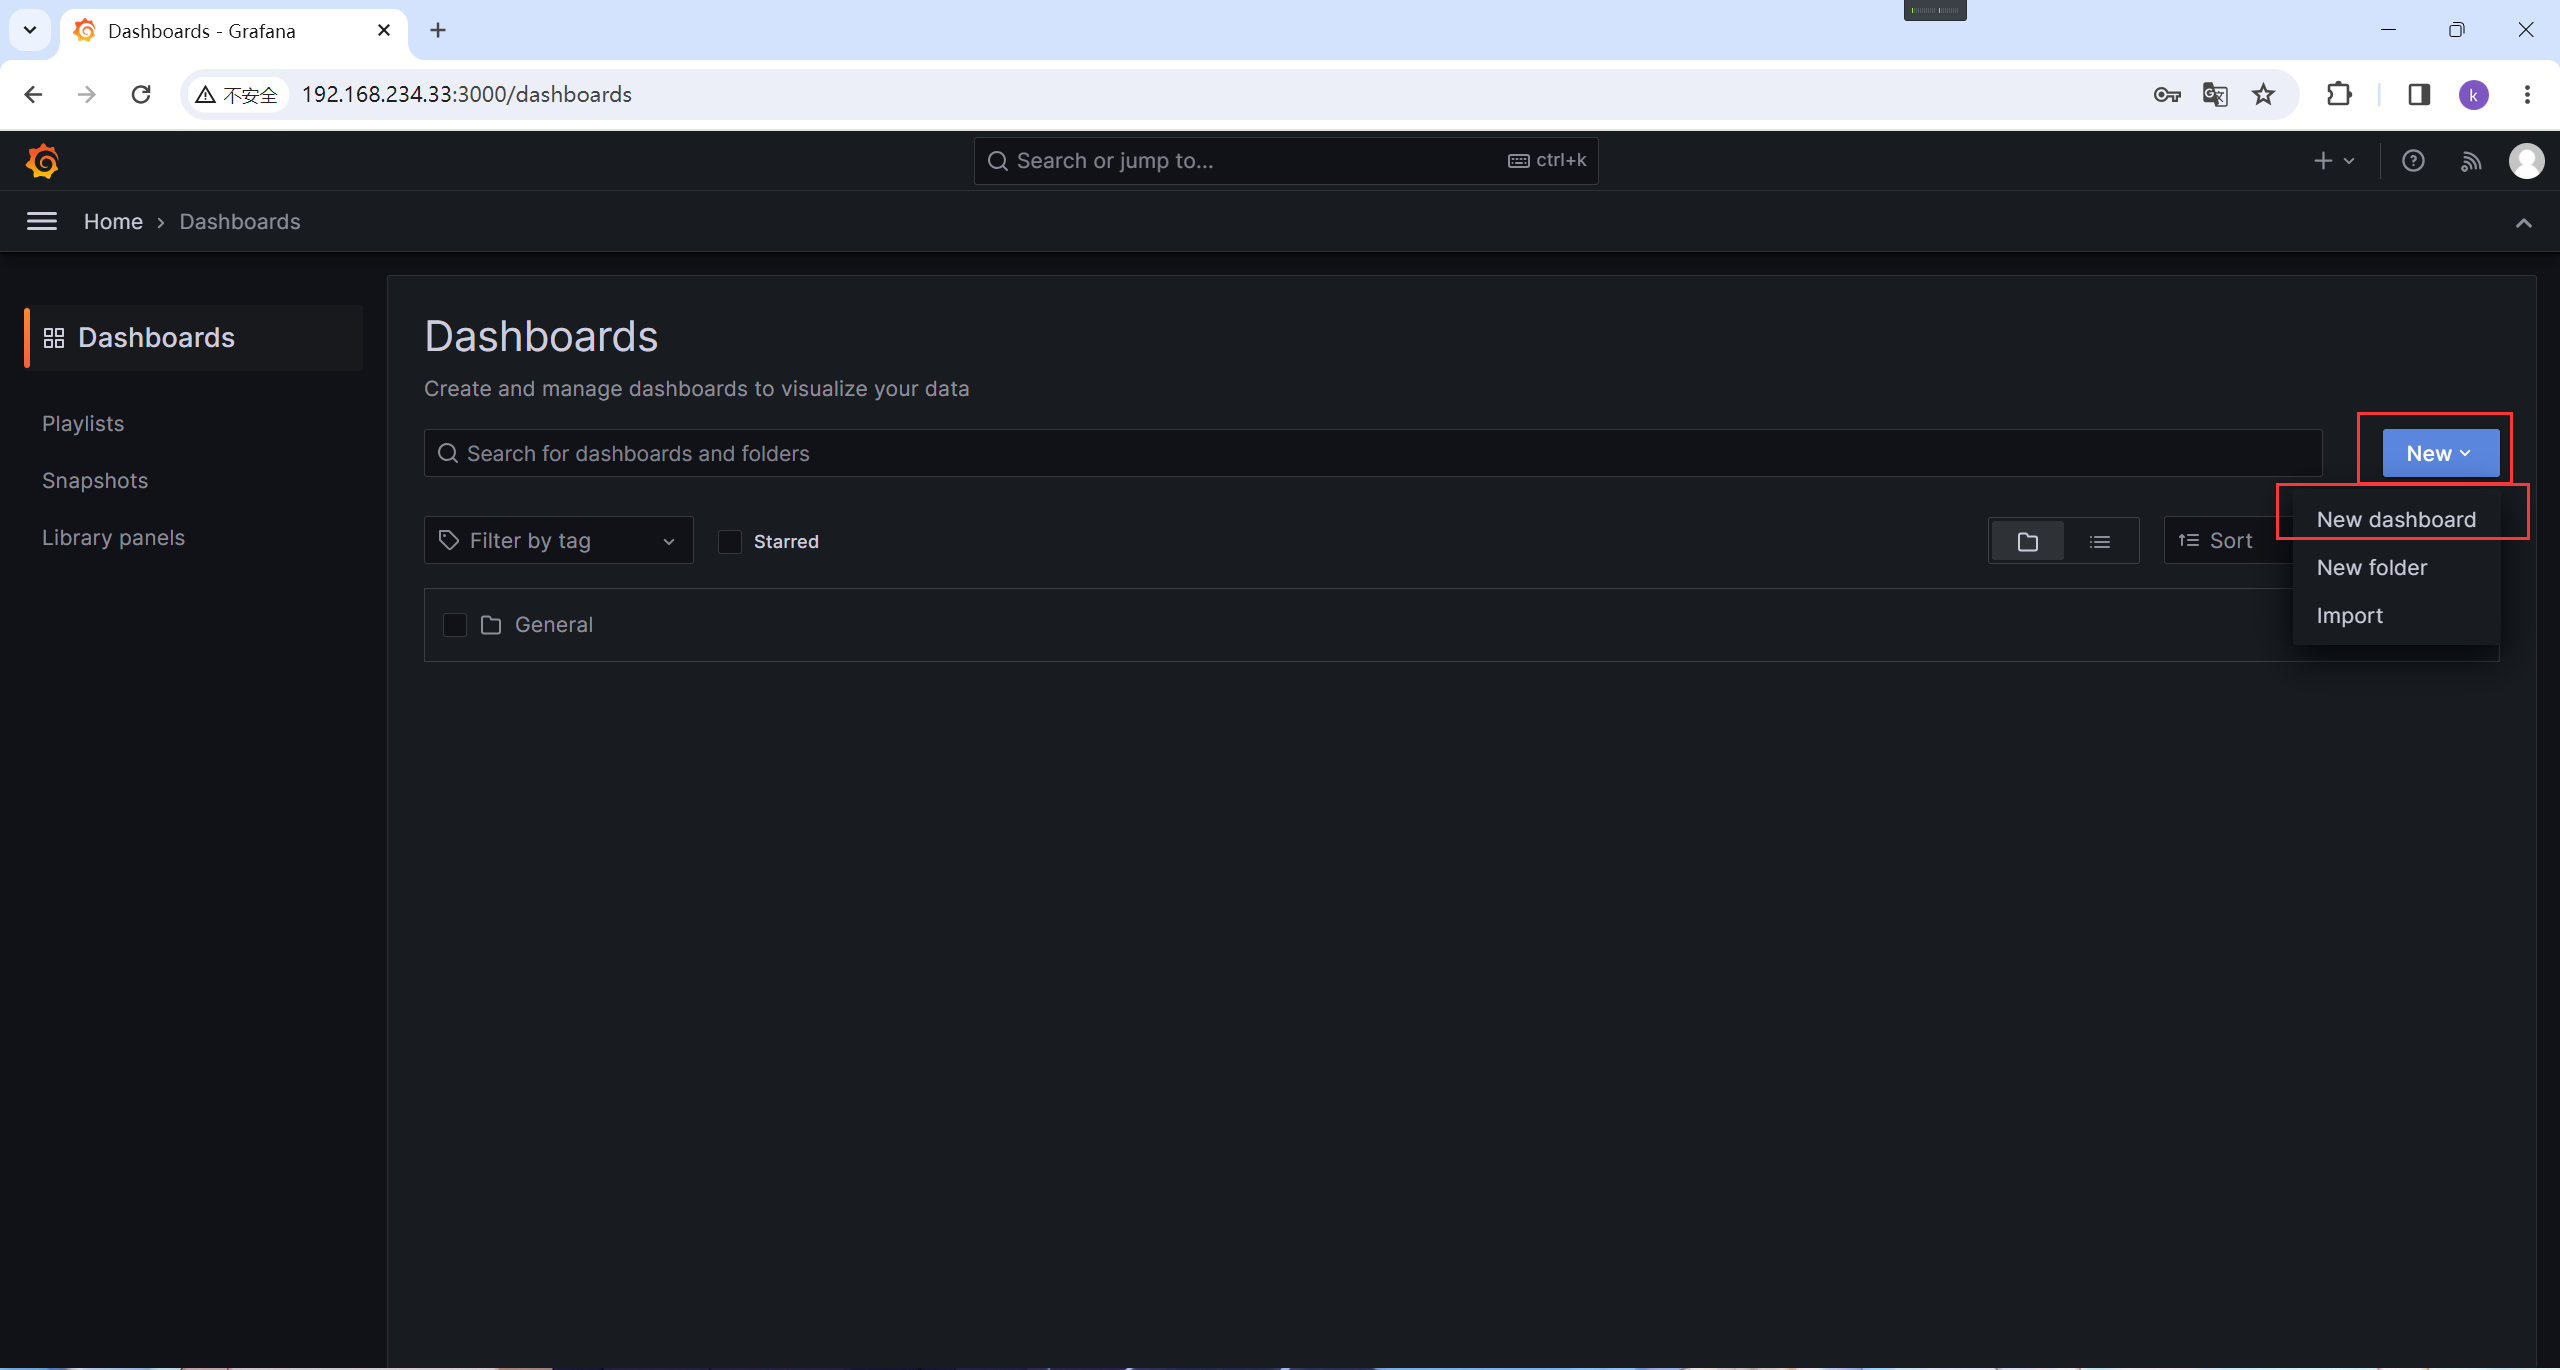
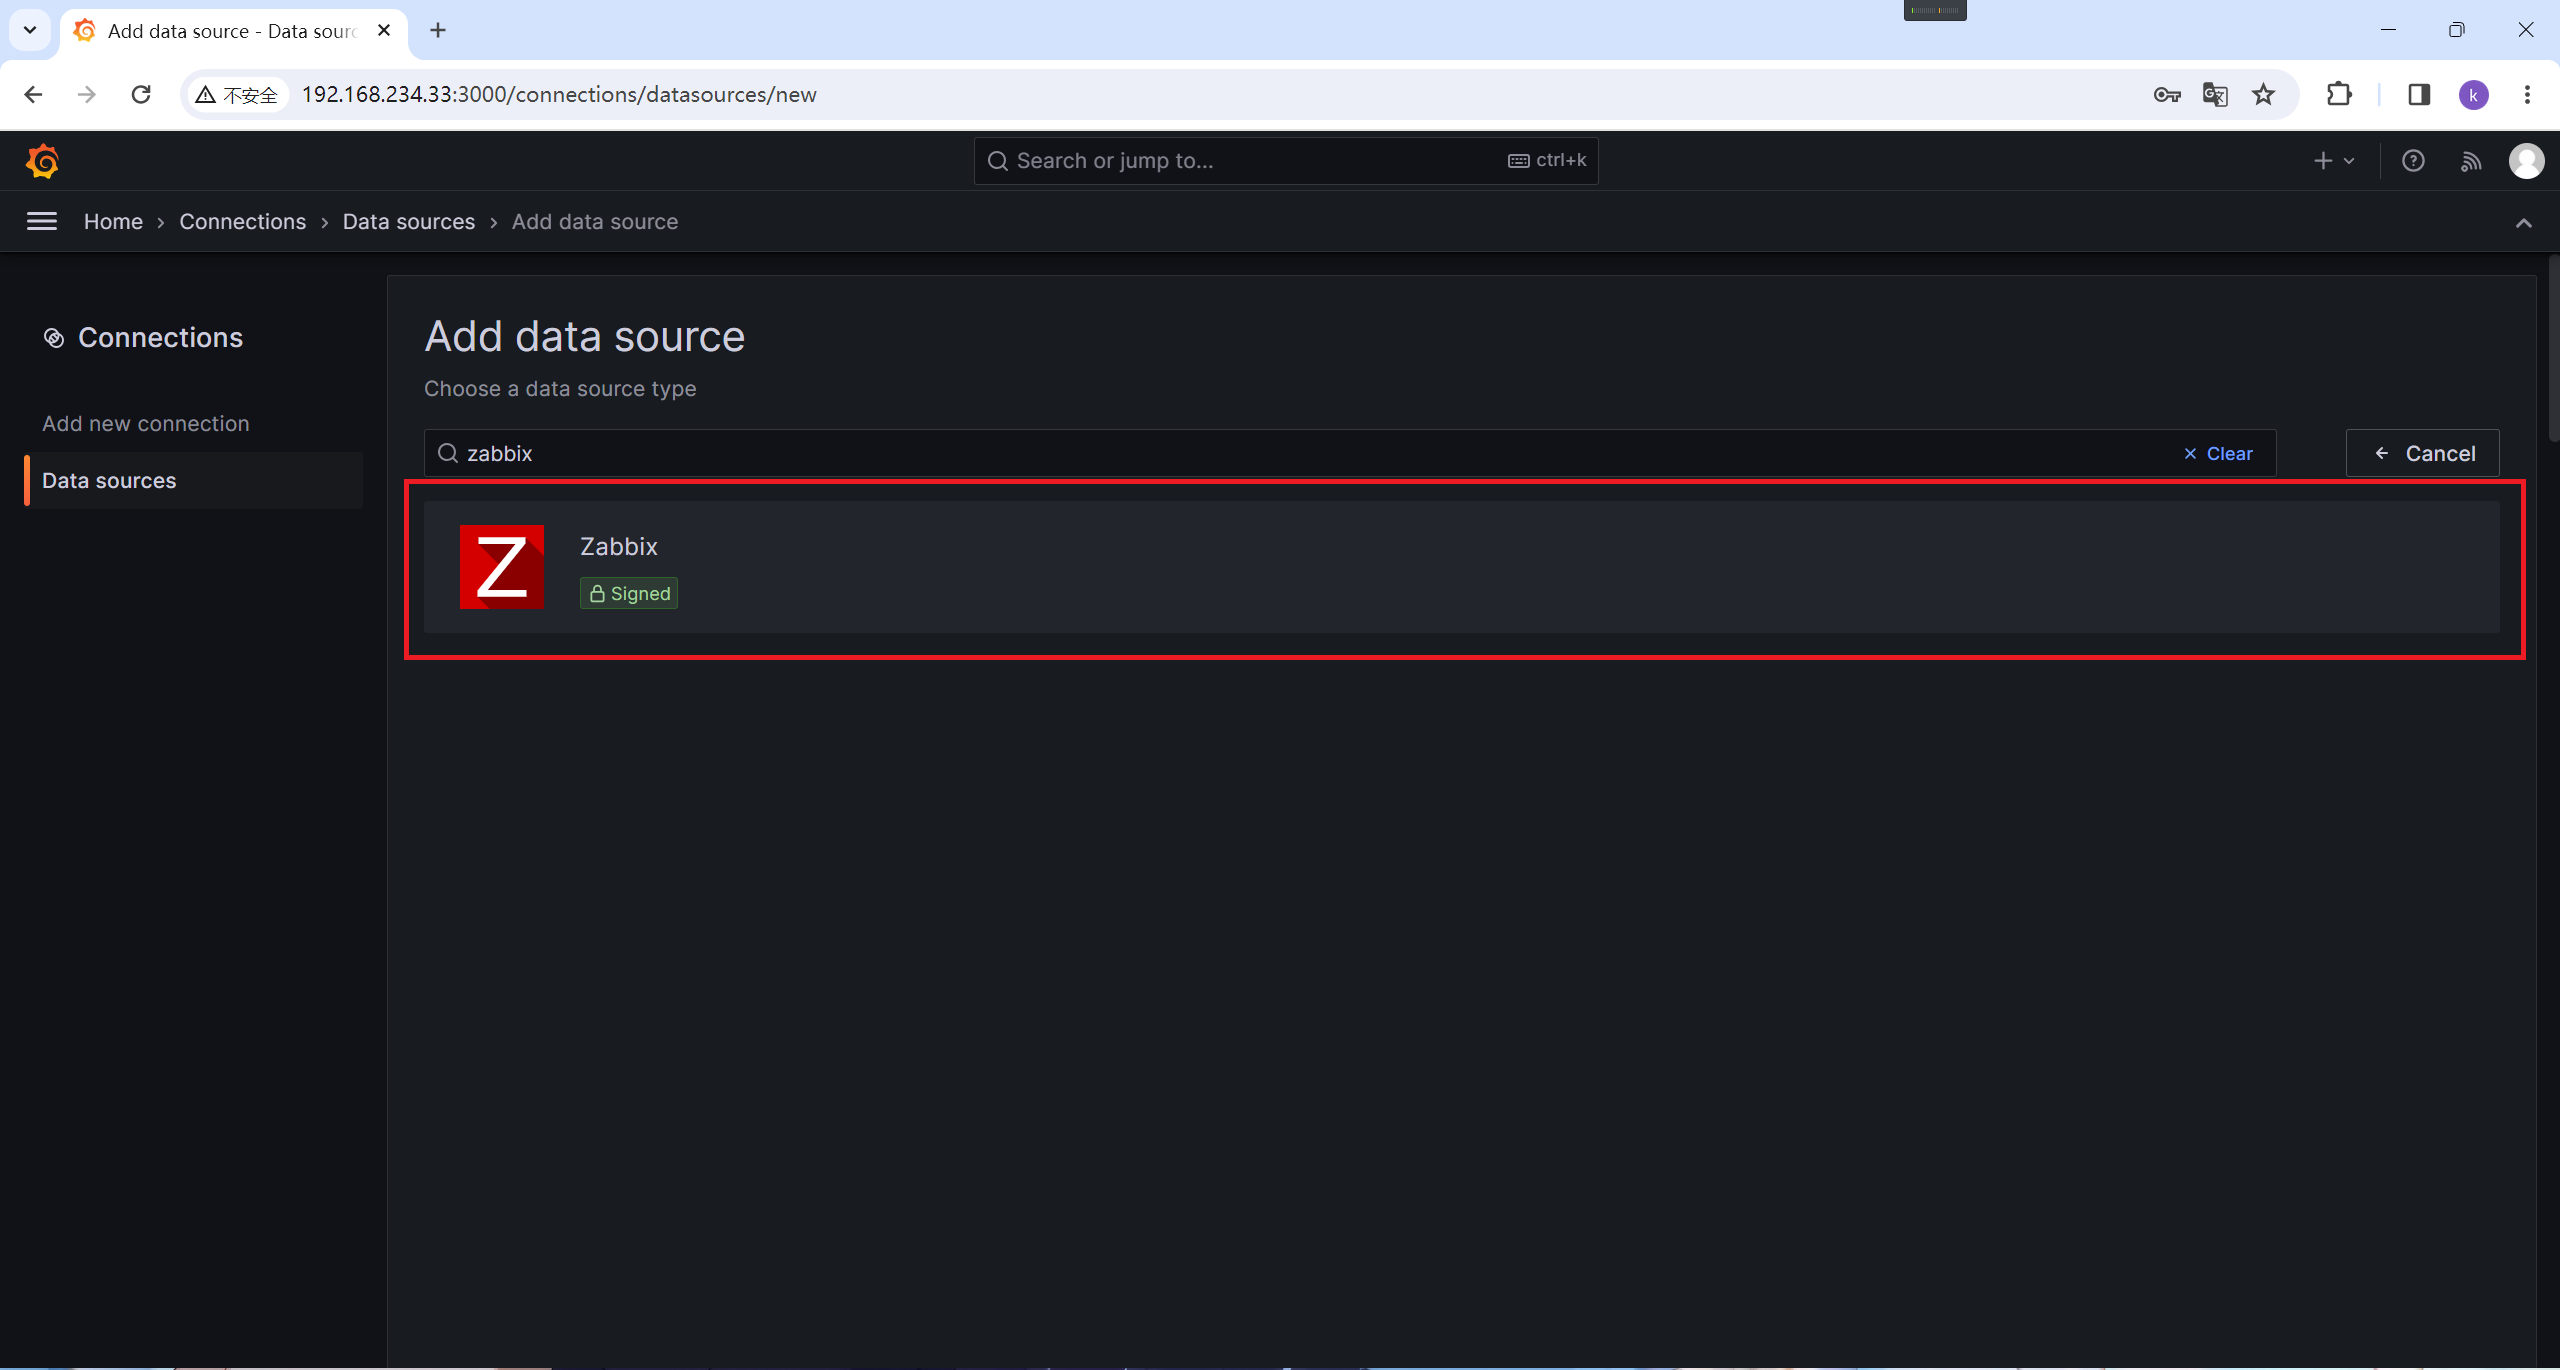
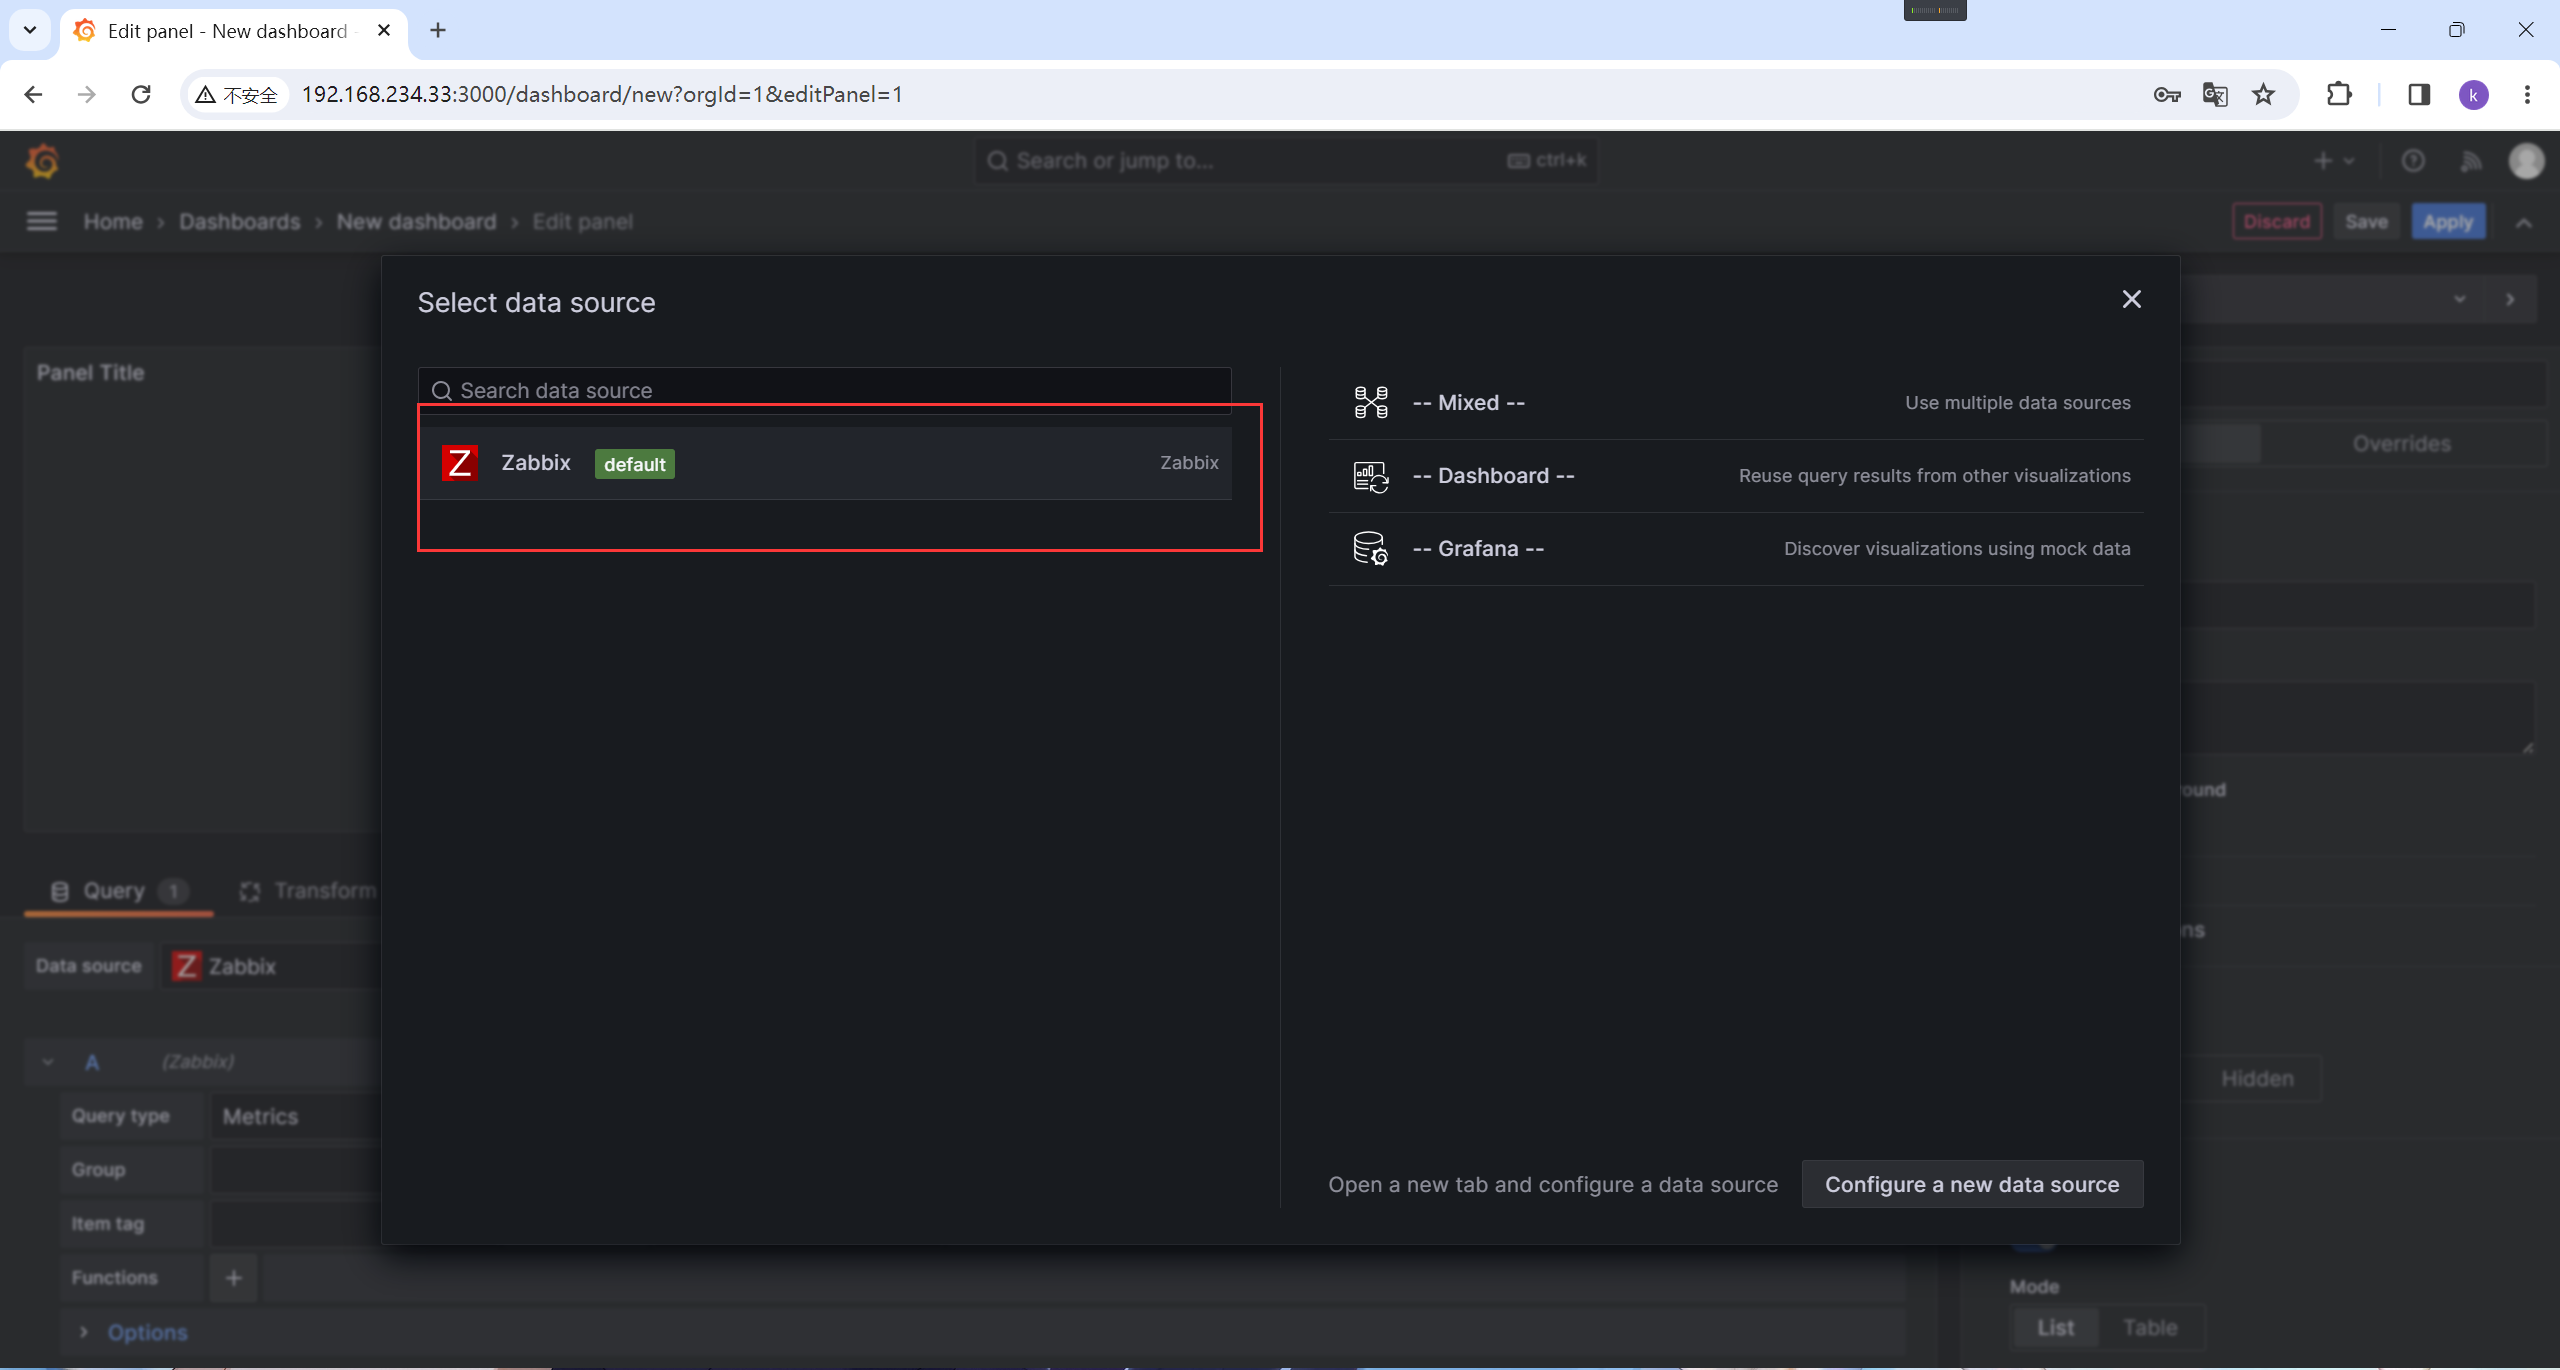
选择zabbix
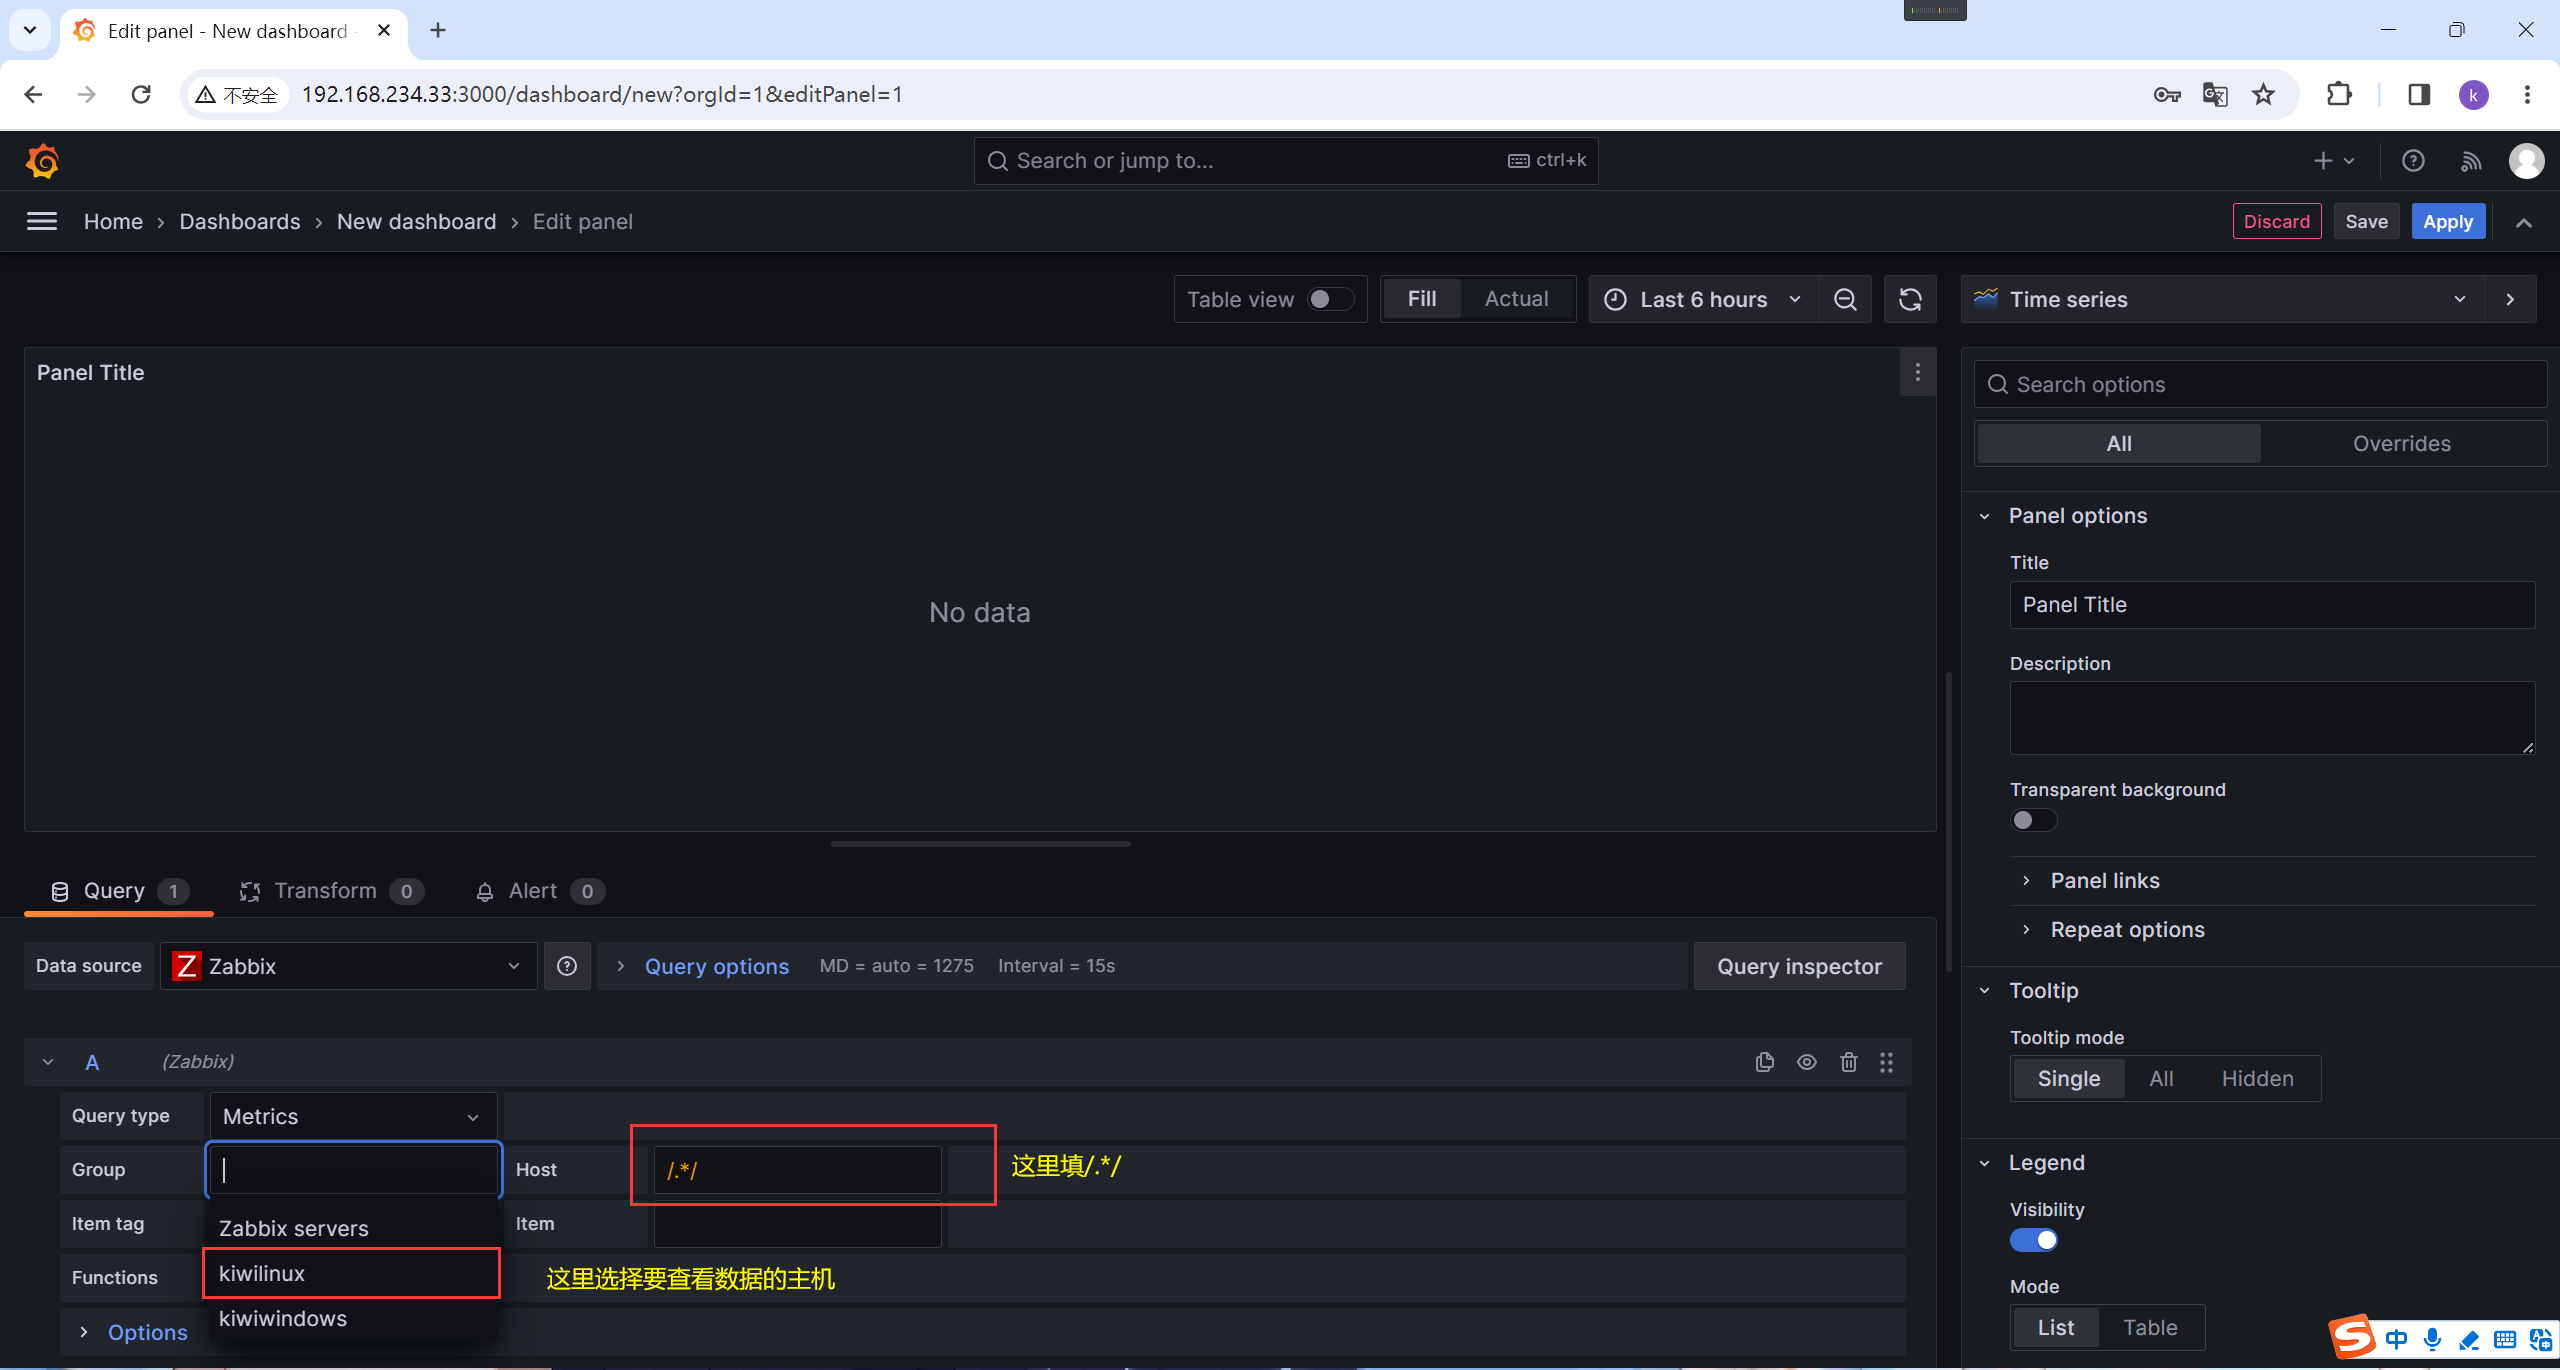
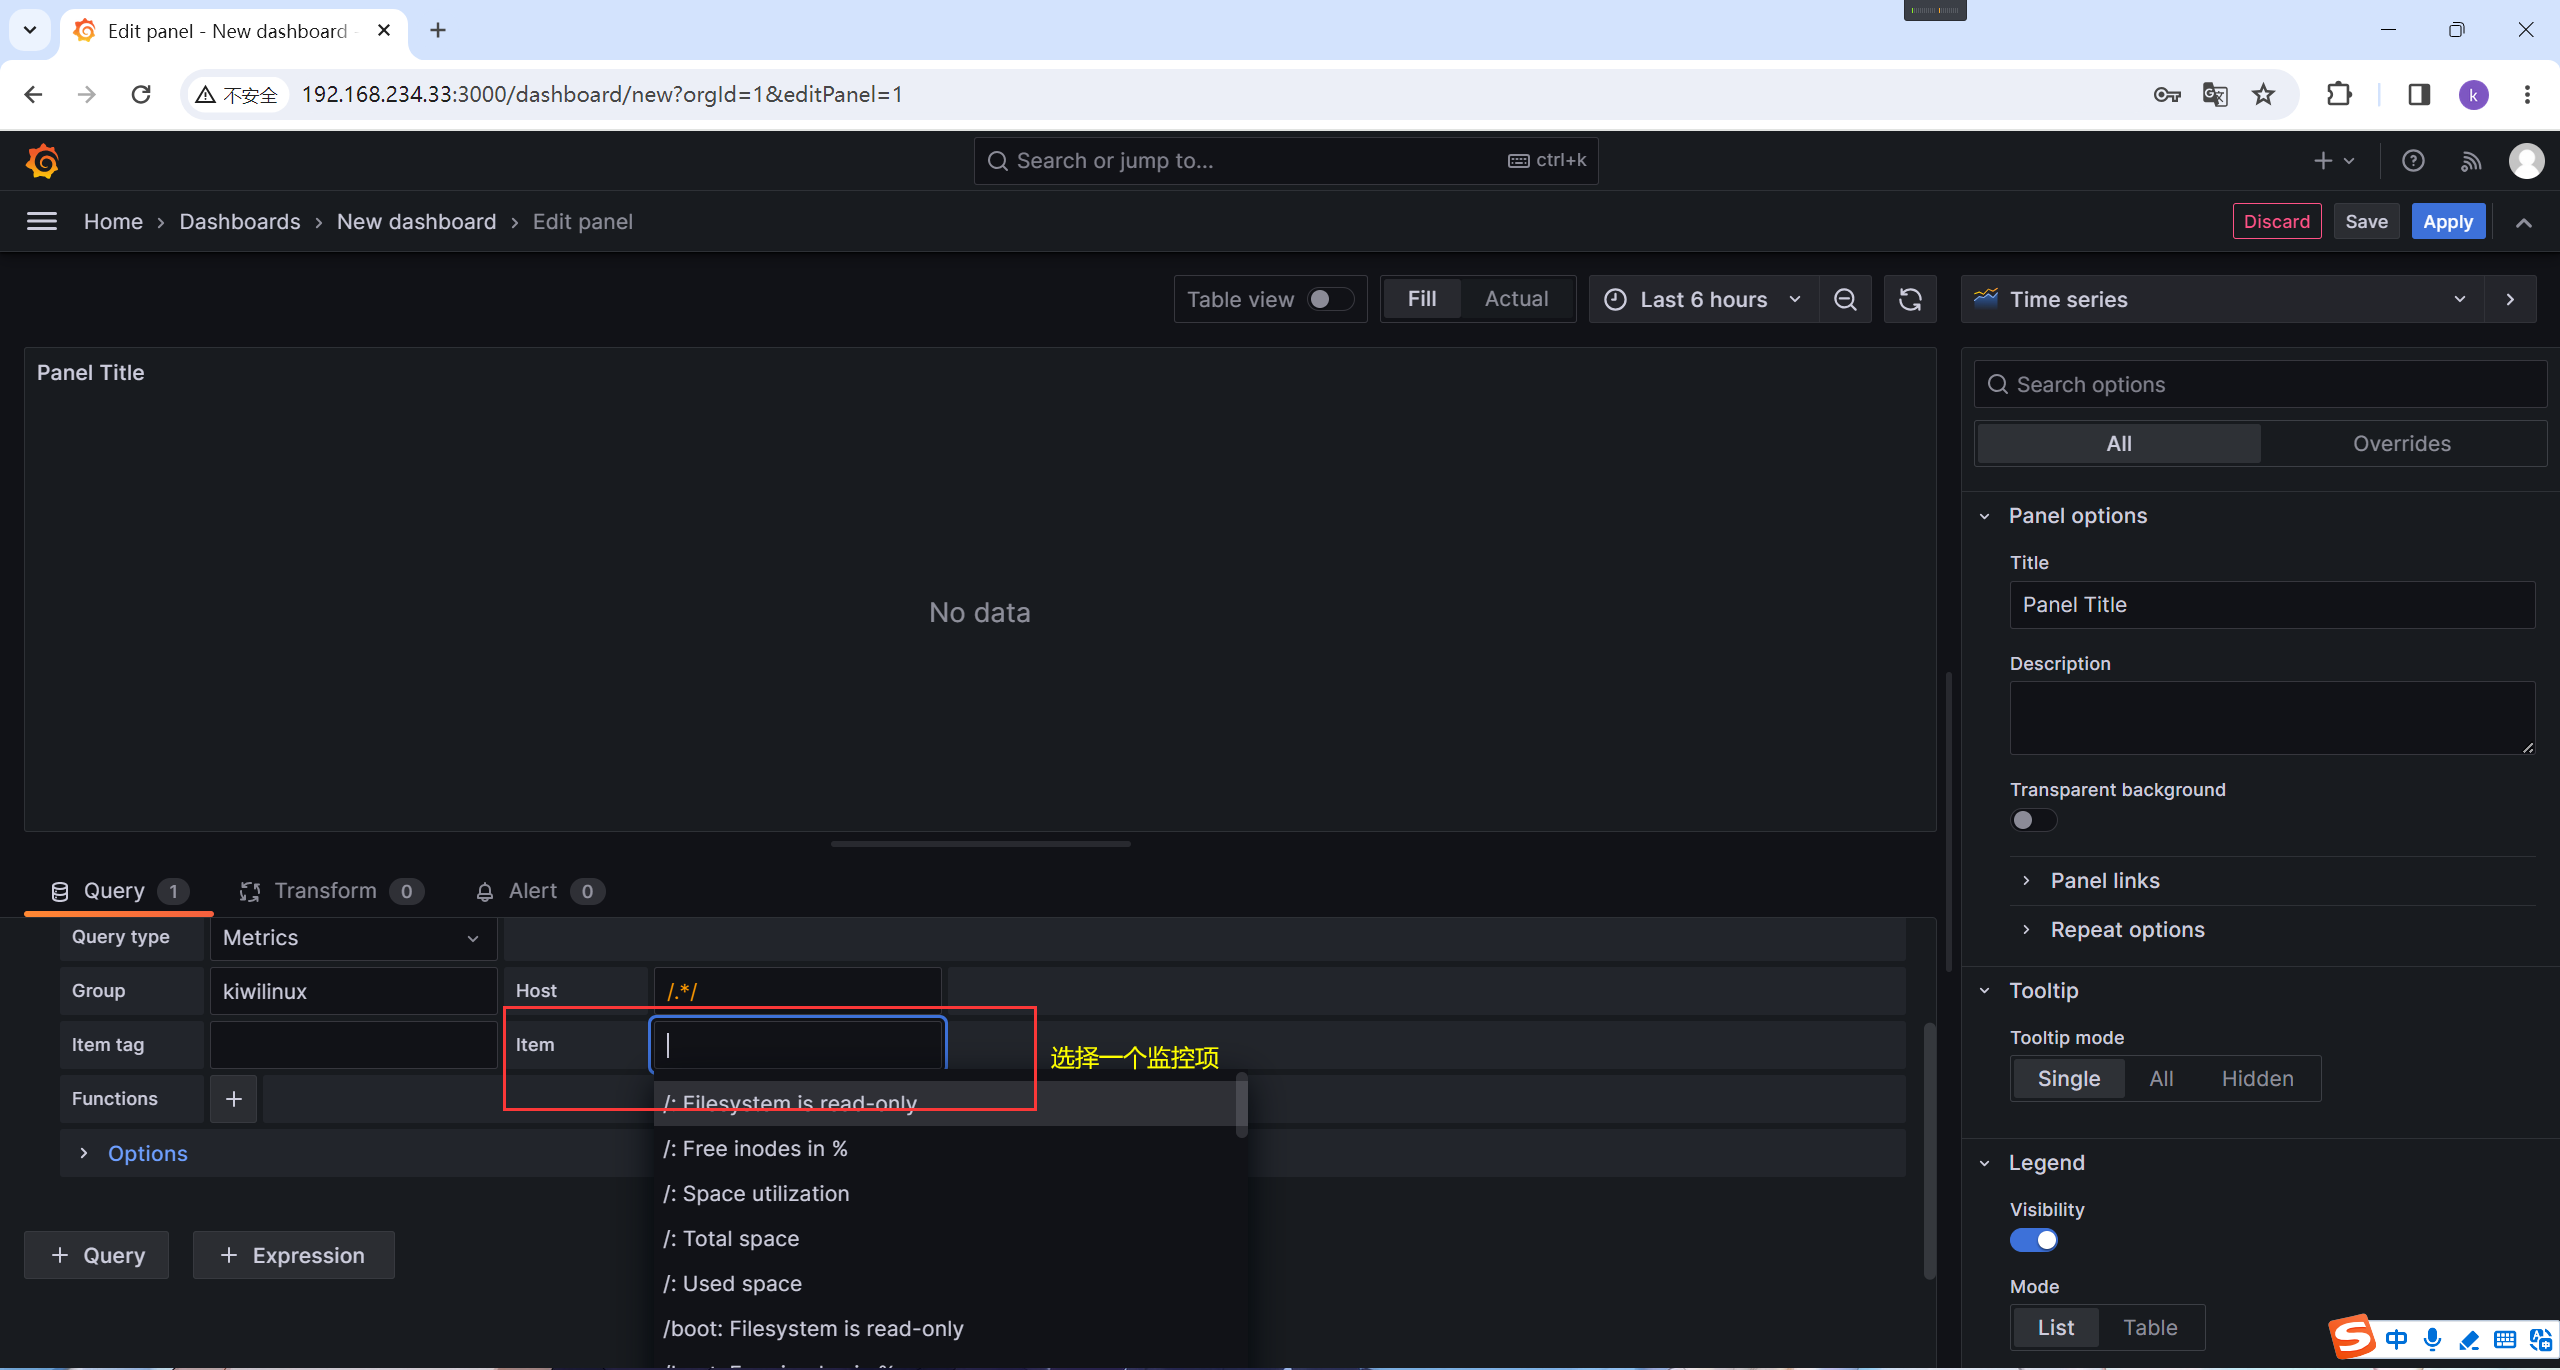
可以看到已经有数据了


 1595
1595


 被折叠的 条评论
为什么被折叠?
被折叠的 条评论
为什么被折叠?
 到【灌水乐园】发言


