


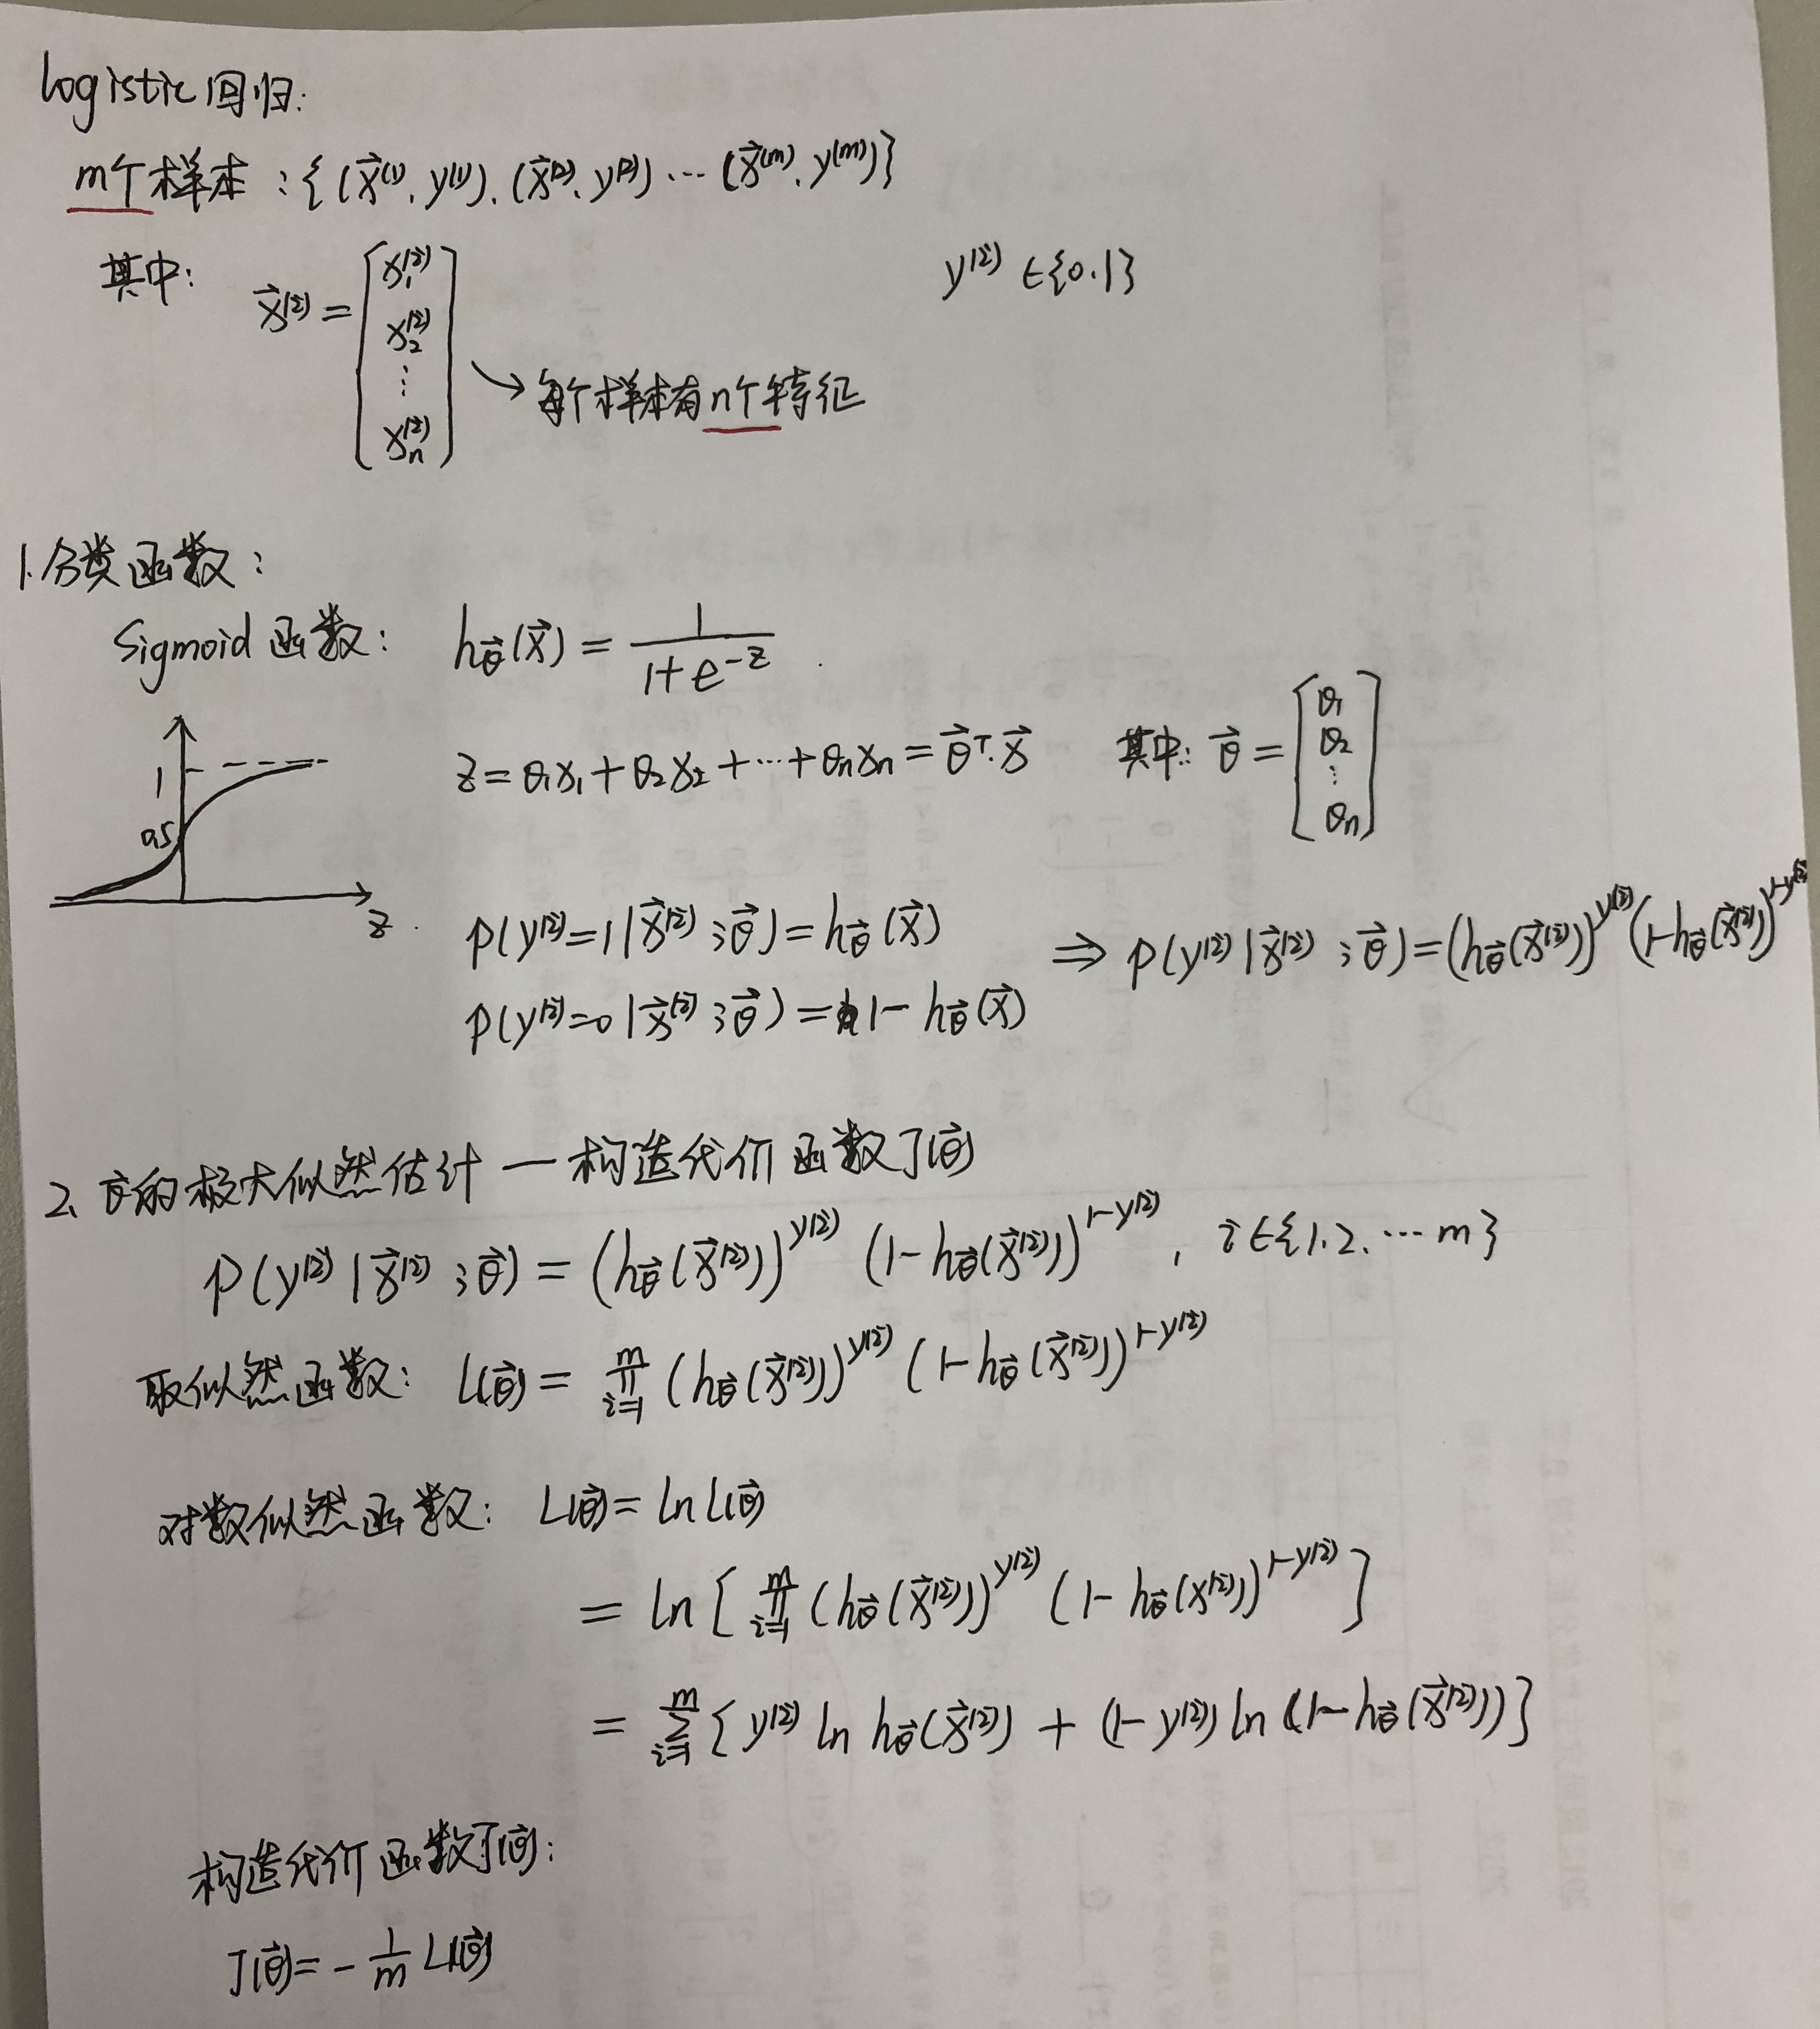
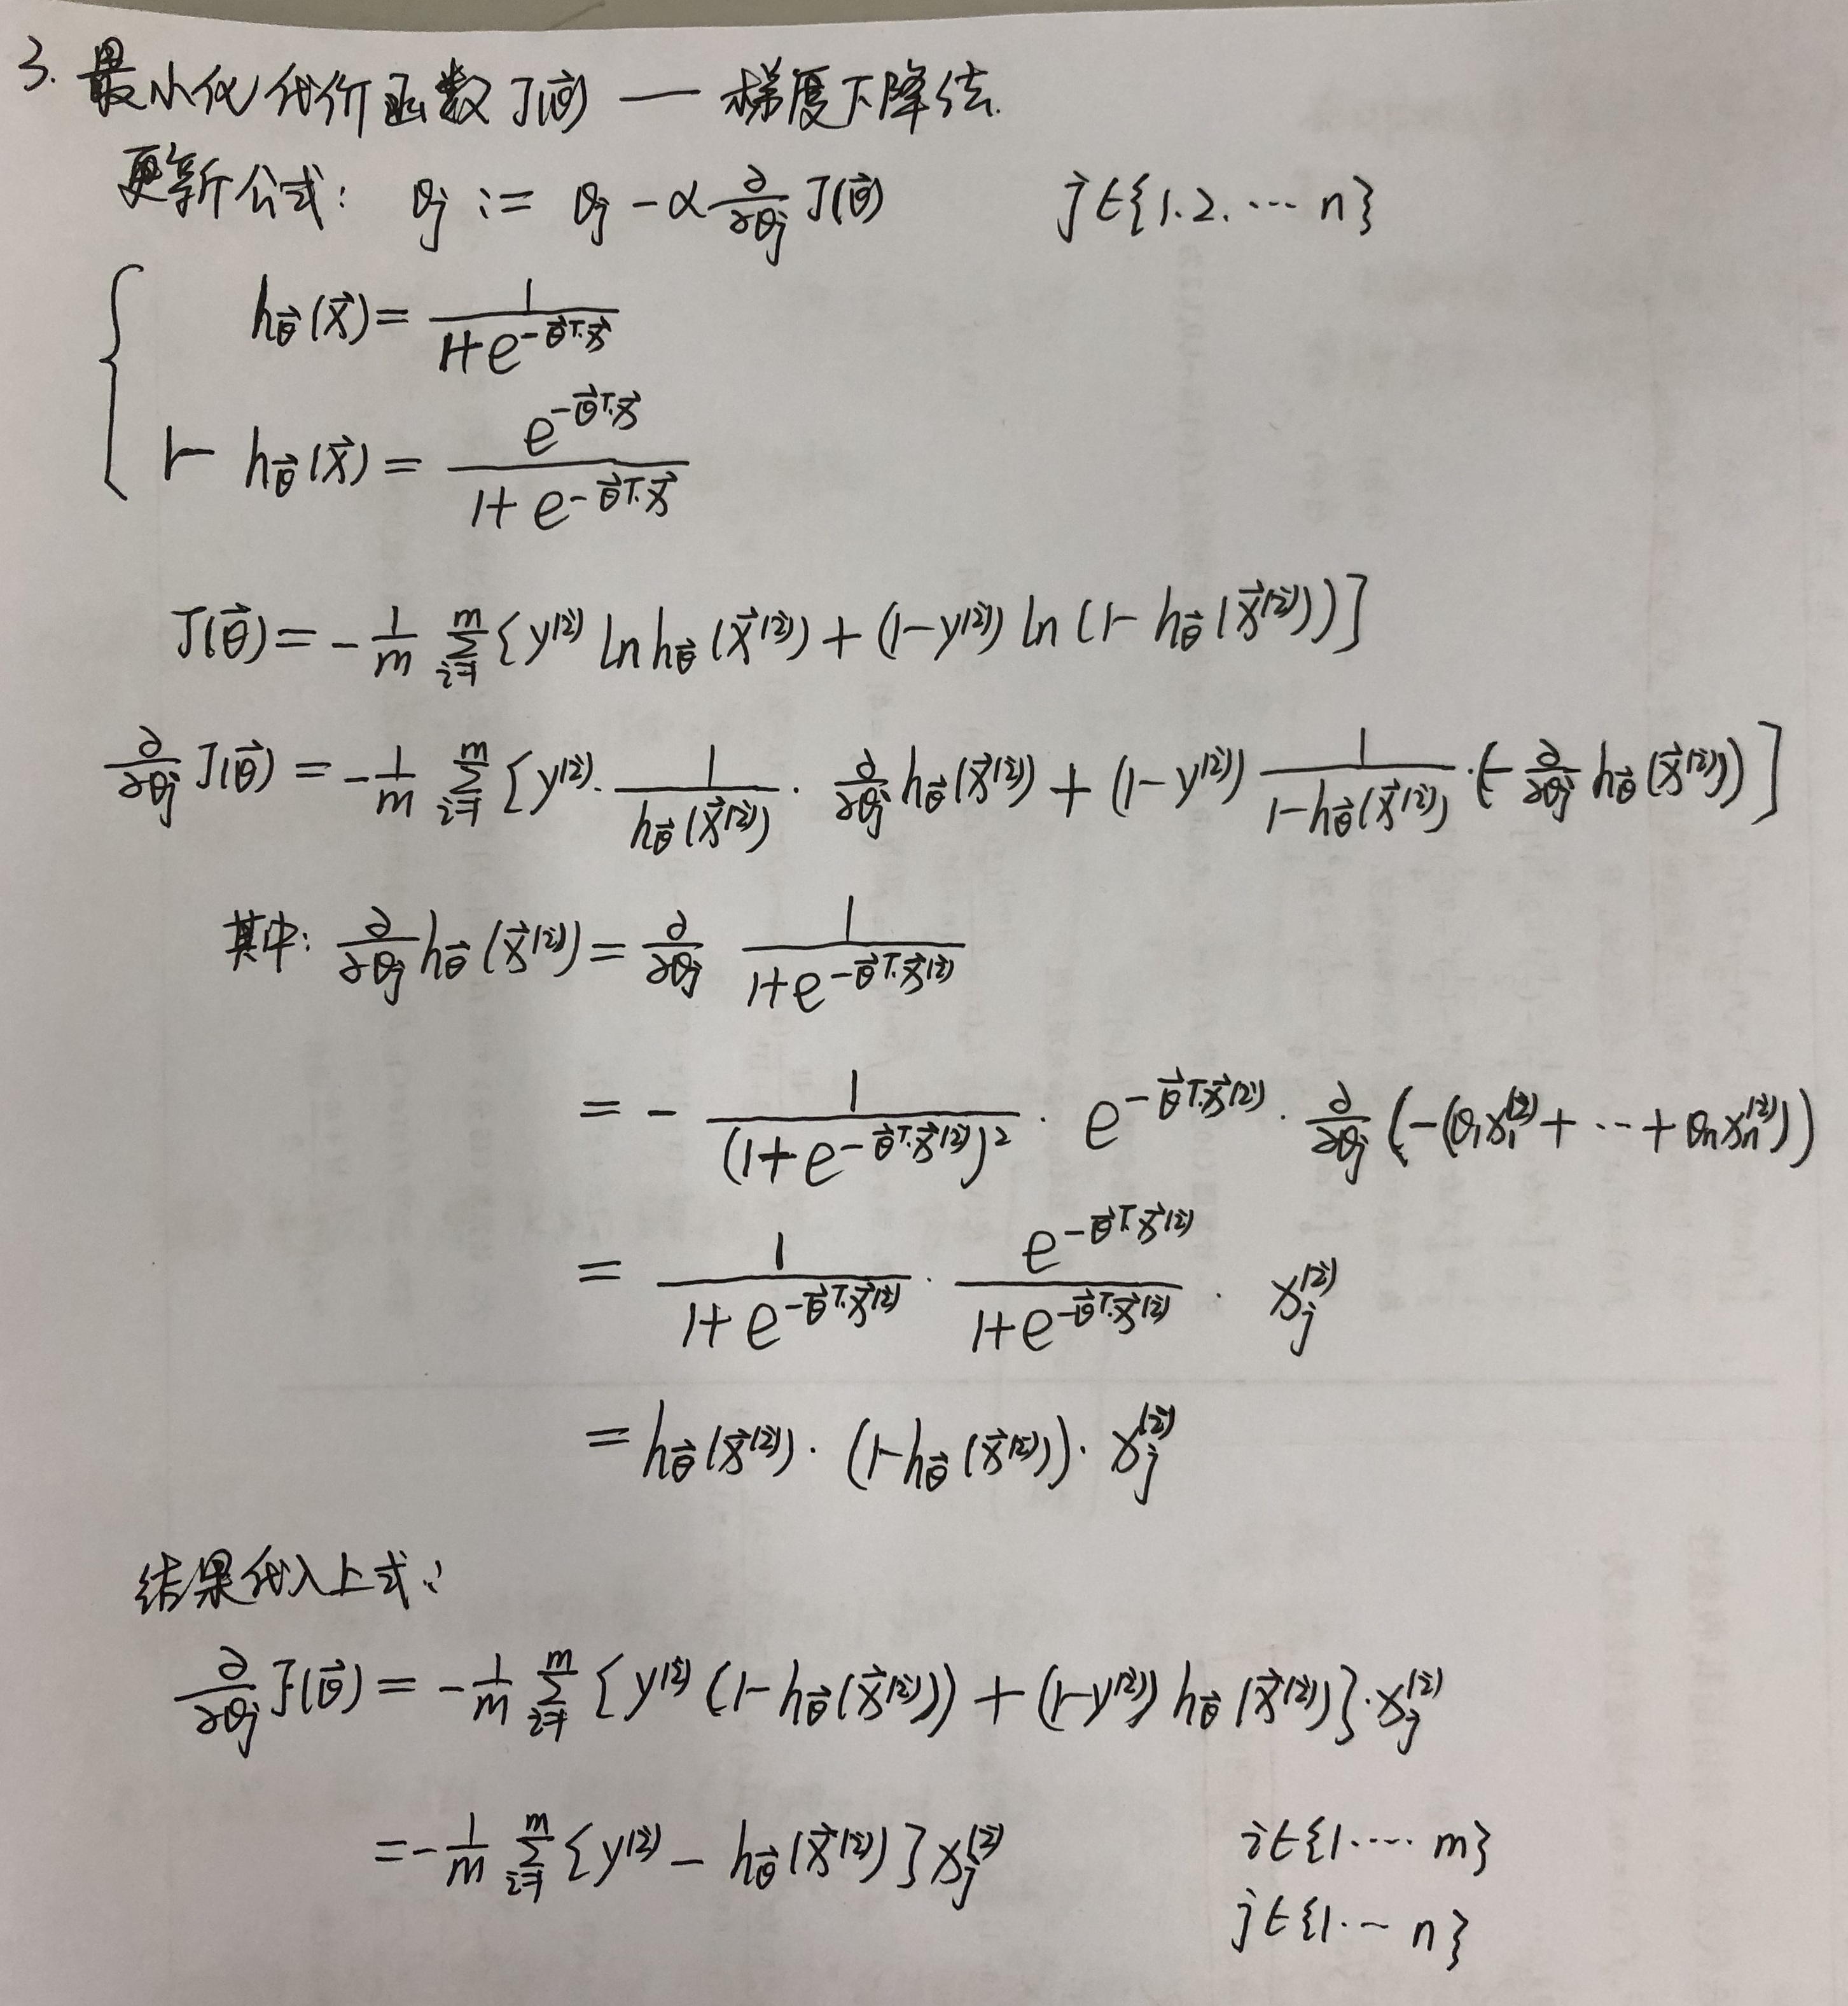
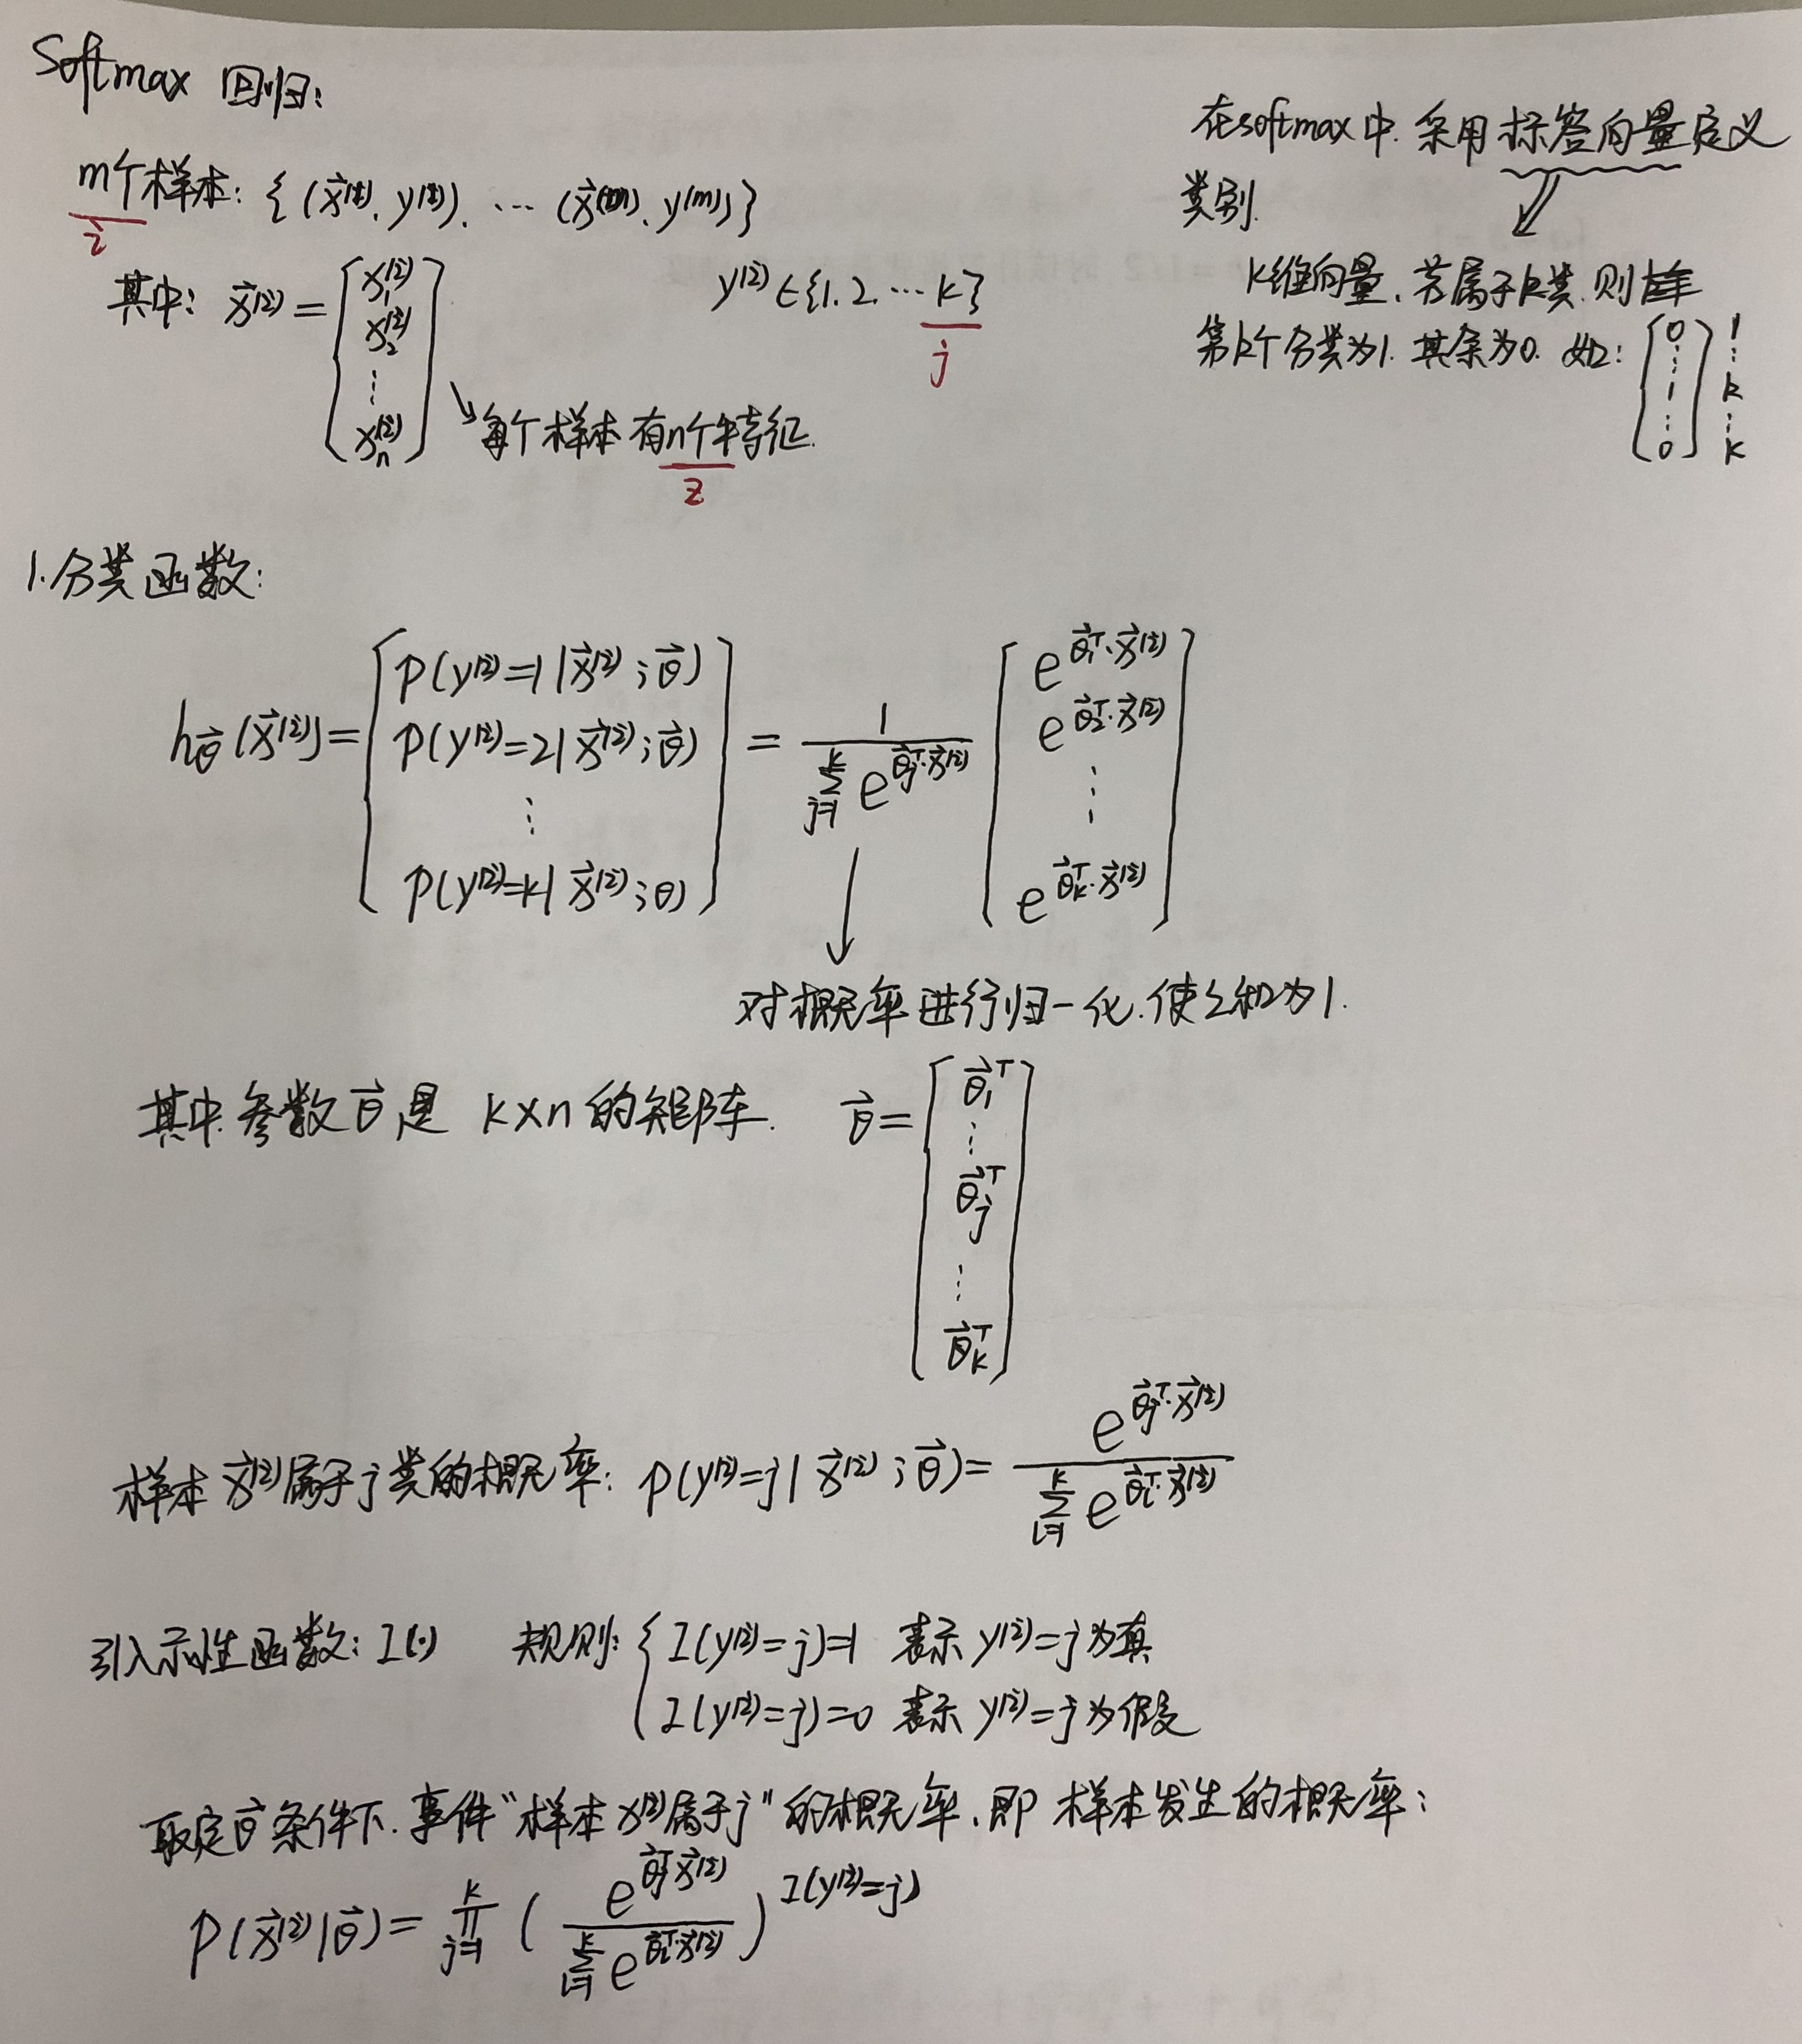
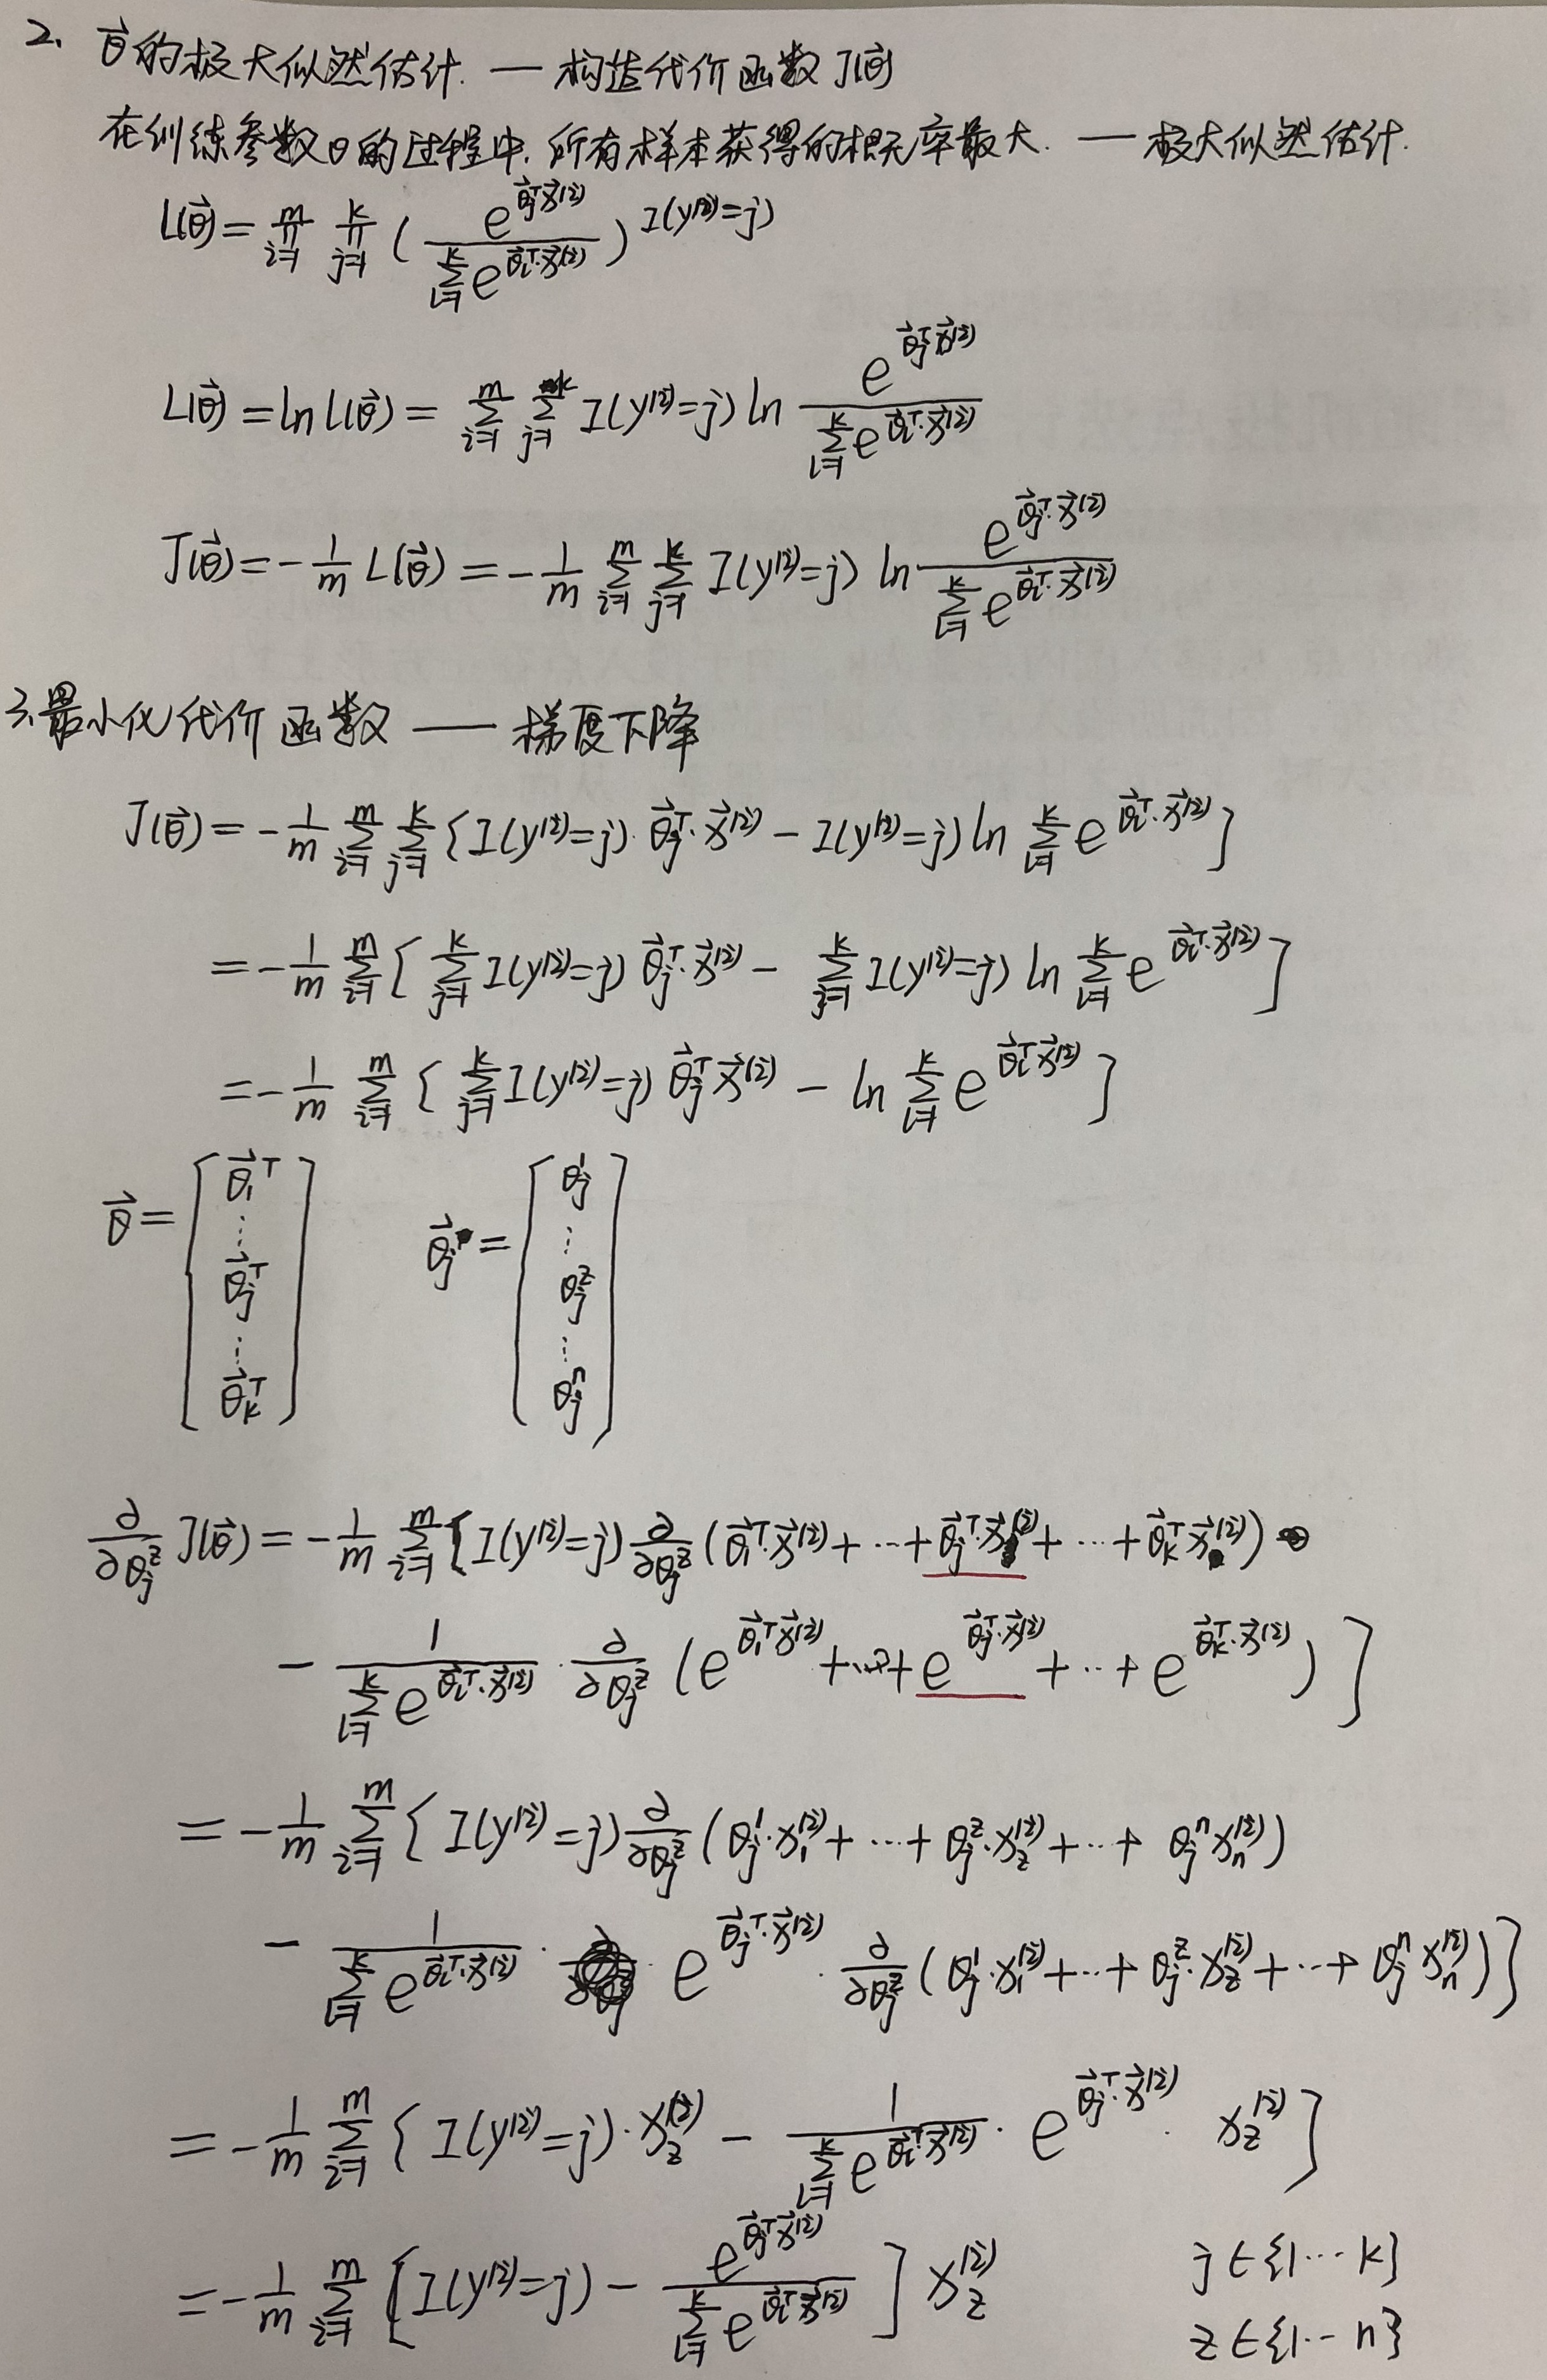
softmax回归实现mnist数据集分类python代码:
# -*- coding: utf-8 -*-
import numpy as np
import matplotlib.pyplot as plt
import struct
#image是一个n*m的数组,n是样本数(行数),m是特征数(列数)。训练数据集包含60000个样本,测试数据集包含10000个样本。在mnist数据集中的每张图片由28*28个像素点构成,每个像素点用一个灰度值表示。我们将28*28的像素展开为一个一维的行向量(每行784个值,或者说每行代表一张图片)。
#label包含相应的目标变量,也就是手写数字的类标签(整数0-9)。
image = []; label = []; testImage = []; testLabel = []
trainData = 60000; testData = 10000
fileImage = 'D:\\Python\\pythonAZ\\Lib\\idlelib\\mnist\\train-images.idx3-ubyte' #训练数据集路径
fileLabel = 'D:\\Python\\pythonAZ\\Lib\\idlelib\\mnist\\train-labels.idx1-ubyte' #训练数据集路径
fileTestImage = 'D:\\Python\\pythonAZ\\Lib\\idlelib\\mnist\\t10k-images.idx3-ubyte' #测试数据集路径
fileTestLabel = 'D:\\Python\\pythonAZ\\Lib\\idlelib\\mnist\\t10k-labels.idx1-ubyte' #测试数据集路径
frImage = open(fileImage,'rb')
bufImage = frImage.read()
indexImage = 0
indexImage += struct.calcsize('>IIII')
#">"是指大端(用来定义字节是如何存储的)。
#"I"这是指一个无符号整数
for i in range(trainData):
image_i = struct.unpack_from('>784B',bufImage,indexImage)
image.append(image_i)
indexImage += struct.calcsize('>784B')
frTestImage = open(fileTestImage,'rb')
bufTestImage = frTestImage.read()
indexTestImage = 0
indexTestImage += struct.calcsize('>IIII')
for i in range(testData):
testImage_i = struct.unpack_from('>784B',bufTestImage,indexTestImage)
testImage.append(testImage_i)
indexTestImage += struct.calcsize('>784B')
frLabel = open(fileLabel,'rb')
bufLabel = frLabel.read()
indexLabel = 0
indexLabel += struct.calcsize('>II')
label_j = np.zeros((trainData, 10))
for i in range(trainData):
label_i = struct.unpack_from('>1B',bufLabel,indexLabel)
label_k = label_j[i]
label_k[label_i] = 1
label.append(label_k)
indexLabel += struct.calcsize('1B')
frTestLabel = open(fileTestLabel,'rb')
bufTestLabel = frTestLabel.read()
indexTestLabel = 0
indexTestLabel += struct.calcsize('>II')
testLabel_j = np.zeros((testData, 10))
for i in range(testData):
testLabel_i = struct.unpack_from('>1B',bufTestLabel,indexTestLabel)
testLabel_k = testLabel_j[i]
testLabel_k[testLabel_i] = 1
testLabel.append(testLabel_k)
indexTestLabel += struct.calcsize('1B')
#显示图片,改变image中的标签显示不同的图片
im = image[50]
im = np.array(im)
im = im.reshape(28,28)
fig = plt.figure()
plotwindow = fig.add_subplot(111)
plt.imshow(im , cmap = 'gray')
plt.show()
def objective(w,x,k):
pp = np.dot(x, w.T)
pp = pp - np.max(pp)
ppp = np.exp(pp)
b = np.sum(ppp,axis = 1)
b = b.reshape(k,1)
p = ppp/b
return p
def loss_function(w,x):
p = np.log(objective(w,x,trainData))
j = -1/60000 * np.sum(np.dot(np.array(label).T , p))
return j
def gradweight(w,x):
pp = objective(w,x,trainData)
alpha = 1
gradw = -1/60000 * np.dot((label - pp).T,x)
w = w - alpha*gradw
return w
def softmax():
maxCycles = 600
x = np.array(image) / 255
w = np.random.rand(10,784)
J = []
for i in range(maxCycles):
w = gradweight(w,x)
J.append(loss_function(w,x))
plt.plot(J)
plt.ylabel('The loss function')
plt.show()
return w
def test_function(w):
x = np.array(testImage) / 255
#w = softmax()
count = 0
p = objective(w,x,testData)
index1 = np.argmax(p,axis=1) #np.argmax()返回最大值的下标
index2 = np.argmax(testLabel,axis=1)
for i in range(10000):
if index1[i] == index2[i]:
count = count+1
corrent_rate = count/testData
return corrent_rate


 3646
3646


 被折叠的 条评论
为什么被折叠?
被折叠的 条评论
为什么被折叠?
 到【灌水乐园】发言


