


关于android性能分析,近期看了不少文章,但看了不代表自己会了,所以接下来会对自己看的文章进行总结,并加上自己的实践。这篇文章主要对google发布的leakcanary检测内存泄漏的使用方法,实现原理,使用注意事项,实例分析进行了总结。
一、使用方法
1. 引入包
在工作build.gradle中引入leakcanary的包;
debugCompile 'com.squareup.leakcanary:leakcanary-android:1.5.1'
releaseCompile 'com.squareup.leakcanary:leakcanary-android-no-op:1.5.1'
或是不区分build Type
compile 'com.squareup.leakcanary:leakcanary-android:1.5.1'2. 监测Activity
在Application文件中定义RefWatcher对象,调用install方法,即可监测到Activity的内存泄漏问题;
public class ExampleApplication extends Application {

  public static RefWatcher getRefWatcher(Context context) {
    ExampleApplication application = (ExampleApplication) context.getApplicationContext();
    return application.refWatcher;
  }

  private RefWatcher refWatcher;

  @Override public void onCreate() {
    super.onCreate();
    refWatcher = LeakCanary.install(this);//LeakCanary.install方法会返回一个预定义的RefWatcher,也会启用一个ActivityRefWatcher,用于自动监控调用Activity.onDestory()之后泄露的activity
  }
}
3. 监测Fragment
要监测Fragment的内存泄漏问题,获取Application中的RefWatcher对象,在onDestroy方法中调用其watch方法,检测那些本该回收的对象而没有被回收引发的内存泄漏;
public abstract class BaseFragment extends Fragment {

  @Override public void onDestroy() {
    super.onDestroy();
    RefWatcher refWatcher = ExampleApplication.getRefWatcher(getActivity());
    refWatcher.watch(this);//使用RefWatcher监控那些本该被回收的对象
  }
}
二、实现原理
1. RefWatcher.watch()创建KeyedWeakReference对象关联被监控对象
先来看下RefWatcher.watch(Object watchedReference)方法,它会调用内部的watch(Object watchedReference, String referenceName)方法。
public void watch(Object watchedReference) {
        this.watch(watchedReference, "");
    }
也就是具体实现是在带两个参数的watch方法中,该方法会创建一个KeyedWeakReference对象,用于关联到要被监控的对象。
public void watch(Object watchedReference, String referenceName) {
        if(this != DISABLED) {
            ...
            KeyedWeakReference reference = new KeyedWeakReference(watchedReference, key, referenceName, this.queue);//创建KeyedWeakReference对象关联到被监测对象
            this.ensureGoneAsync(watchStartNanoTime, reference);
        }
    }
2. RefWatcher.ensureGone()方法在后台线程检查引用是否被清除,没有则调用GC回收
我们再来看下ensureGoneAsync方法,该方法开启线程池,在子线程中调用ensureGone方法,ensureGone方法主要作用是:在后台线程中检查引用是否被清除,没有则调用GC。
private void ensureGoneAsync(final long watchStartNanoTime, final KeyedWeakReference reference) {
        this.watchExecutor.execute(new Retryable() {
            public Result run() {
                return RefWatcher.this.ensureGone(reference, watchStartNanoTime);
            }
        });
    }

    Result ensureGone(KeyedWeakReference reference, long watchStartNanoTime) {
        long gcStartNanoTime = System.nanoTime();
        long watchDurationMs = TimeUnit.NANOSECONDS.toMillis(gcStartNanoTime - watchStartNanoTime);
        this.removeWeaklyReachableReferences();//清除弱引用
        if(this.debuggerControl.isDebuggerAttached()) {
            return Result.RETRY;
        } else if(this.gone(reference)) {//如果引用被回收了,直接返回
            return Result.DONE;
        } else {
            this.gcTrigger.runGc();//调用GC回收对象
            this.removeWeaklyReachableReferences();
            if(!this.gone(reference)) {//如果该引用对象无法被清除
                long startDumpHeap = System.nanoTime();
                long gcDurationMs = TimeUnit.NANOSECONDS.toMillis(startDumpHeap - gcStartNanoTime);
                //把heap内存dump到APP对应的文件系统中一个.hprof文件中
                File heapDumpFile = this.heapDumper.dumpHeap();
                if(heapDumpFile == HeapDumper.RETRY_LATER) {
                    return Result.RETRY;
                }

                long heapDumpDurationMs = TimeUnit.NANOSECONDS.toMillis(System.nanoTime() - startDumpHeap);
                //调用另一个进程中HeapAnalyzerService的HeapAnalyzer进行解析.hprof文件
                this.heapdumpListener.analyze(new HeapDump(heapDumpFile, reference.key, reference.name, this.excludedRefs, watchDurationMs, gcDurationMs, heapDumpDurationMs));
            }

            return Result.DONE;
        }
    }
3. 若引用未清除,通过HeapAnalyzerService的onHandleIntent把引用的heap内存dump到.hprof文件中
ensureGone方法中倒数第二条语句会调用ServiceHeapDumpListener的analyze方法,该方法调用HeapAnalyzerService开启后台线程先保存引用的heap内存情况
public void analyze(HeapDump heapDump) {
        Preconditions.checkNotNull(heapDump, "heapDump");
        HeapAnalyzerService.runAnalysis(this.context, heapDump, this.listenerServiceClass);
    }
HeapAnalyzerService是一个继承IntentService的类,它的runAnalysis方法,会启动服务;
 public static void runAnalysis(Context context, HeapDump heapDump, Class<? extends AbstractAnalysisResultService> listenerServiceClass) {
        Intent intent = new Intent(context, HeapAnalyzerService.class);
        intent.putExtra("listener_class_extra", listenerServiceClass.getName());
        intent.putExtra("heapdump_extra", heapDump);
        context.startService(intent);
    }
HeapAnalyzerService先会将引用的heap内存dump到系统文件.prof文件中, 我们来看看它的onHandleIntent方法实现:
protected void onHandleIntent(Intent intent) {
        if(intent == null) {
            CanaryLog.d("HeapAnalyzerService received a null intent, ignoring.", new Object[0]);
        } else {
            String listenerClassName = intent.getStringExtra("listener_class_extra");
            HeapDump heapDump = (HeapDump)intent.getSerializableExtra("heapdump_extra");
            HeapAnalyzer heapAnalyzer = new HeapAnalyzer(heapDump.excludedRefs);//根据heapDump的引用新建一个HeapAnalyzer对象
            AnalysisResult result = heapAnalyzer.checkForLeak(heapDump.heapDumpFile, heapDump.referenceKey);//调用HeapAnalyzer的方法解析.prof文件
            AbstractAnalysisResultService.sendResultToListener(this, listenerClassName, heapDump, result);//找到内存泄漏引用链后,会调用AbstractAnalysisResultService的实现类DisplayLeakService,将结果以通知的形式展示出来
        }
    }
4. 通过HeapAnalyzer.checkForLeak方法使用HAHA解析.hprof文件
我们进入HeapAnalyzer类查看它的checkForLeak方法,发会新建一个解析器,并解析出引用链
public AnalysisResult checkForLeak(File heapDumpFile, String referenceKey) {
    MemoryMappedFileBuffer e = new MemoryMappedFileBuffer(heapDumpFile);
    HprofParser parser = new HprofParser(e);//新建HprofParser解析器对象
    Snapshot snapshot = parser.parse();//对生成的.hprof文件解析并生成快照
}
5. 根据referenceKey找到KeyedWeakReference,定位内存泄漏引用链
仍在HeapAnalyzer类的checkForLeak方法中
Instance leakingRef = this.findLeakingReference(referenceKey, snapshot);6. 计算到GCroots的最短强引用路径,并确定是否是泄露,如果是则建立导致泄露的引用链
this.deduplicateGcRoots(snapshot);//计算到GCroots的引用路径
return leakingRef == null?AnalysisResult.noLeak(this.since(analysisStartNanoTime)):this.findLeakTrace(analysisStartNanoTime, snapshot, leakingRef);//如果KeyedWeakReference存在,说明是内存泄漏,建立导到泄漏的引用链
7. 引用链传递到APP进程中的DisplayLeakService, 并以通知的形式展示出来
在HeapAnalyzerService的onHandleIntent的最后一句中,它会将引用链传递到DisplayLeakService中。
AbstractAnalysisResultService.sendResultToListener(this, listenerClassName, heapDump, result);//找到内存泄漏引用链后,会调用AbstractAnalysisResultService的实现类DisplayLeakService,将结果以通知的形式展示出来最后调用了DisplayLeakService.onHeapAnalyzed方法,将内存泄漏的引用链发送到通知栏。
LeakCanaryInternals.showNotification(this, contentTitle, contentText, pendingIntent, notificationId1);三、 使用注意事项(leakcanary引入方式不对可能导致不起作用)
1. 包的引入方式
随着组件化越来越流行,大家的工程可能不只一个module,一般会包含一个主module(工程入口,application), 一个基础包basemodule(library)和若干个子module(library),可能每个module都会依赖basemodule,所以一般依赖的第三方库一般都会写在basemodule的build.gradle中,这样也是为了避免多个module重复引用第三方库。
但是在引入第三方库时,有不同的引入形式,有以下六种:
1) compile:对所有的build type以及favlors都会参与编译并且打包到最终的apk文件中。
2) Provided:对所有的build type以及favlors只在编译时使用,类似eclipse中的external-libs,只参与编译,不打包到最终apk。
3) APK:只会打包到apk文件中,而不参与编译,所以不能再代码中直接调用jar中的类或方法,否则在编译时会报错
4) Test compile:仅仅是针对单元测试代码的编译编译以及最终打包测试apk时有效,而对正常的debug或者release apk包不起作用。
5) Debug compile:仅仅针对debug模式的编译和最终的debug apk打包。
6) Release compile:仅仅针对Release 模式的编译和最终的Release apk打包。
leakcanary官方建议用以下两种引入方式:
debugCompile 'com.squareup.leakcanary:leakcanary-android:1.5.1'
releaseCompile 'com.squareup.leakcanary:leakcanary-android-no-op:1.5.1'
如果你把这两行代码写到basemodule的build.gradle中,会发现leakcanary不起作用,不起作用可以从以下几方面进行判断:
(1) 从应用图标来看,按道理如果工程引入了leakcanary,会出现一个leakcanary的应用图标,黄色图标包含一个感吧号的,如果没有代表你工程没有正确引用leakcanary;
(2) 将apk包解压缩,查看leakcanary相关代码,如果没有,说明你的工程没有把leakcanary打包进去,这样肯定也不会起作用;
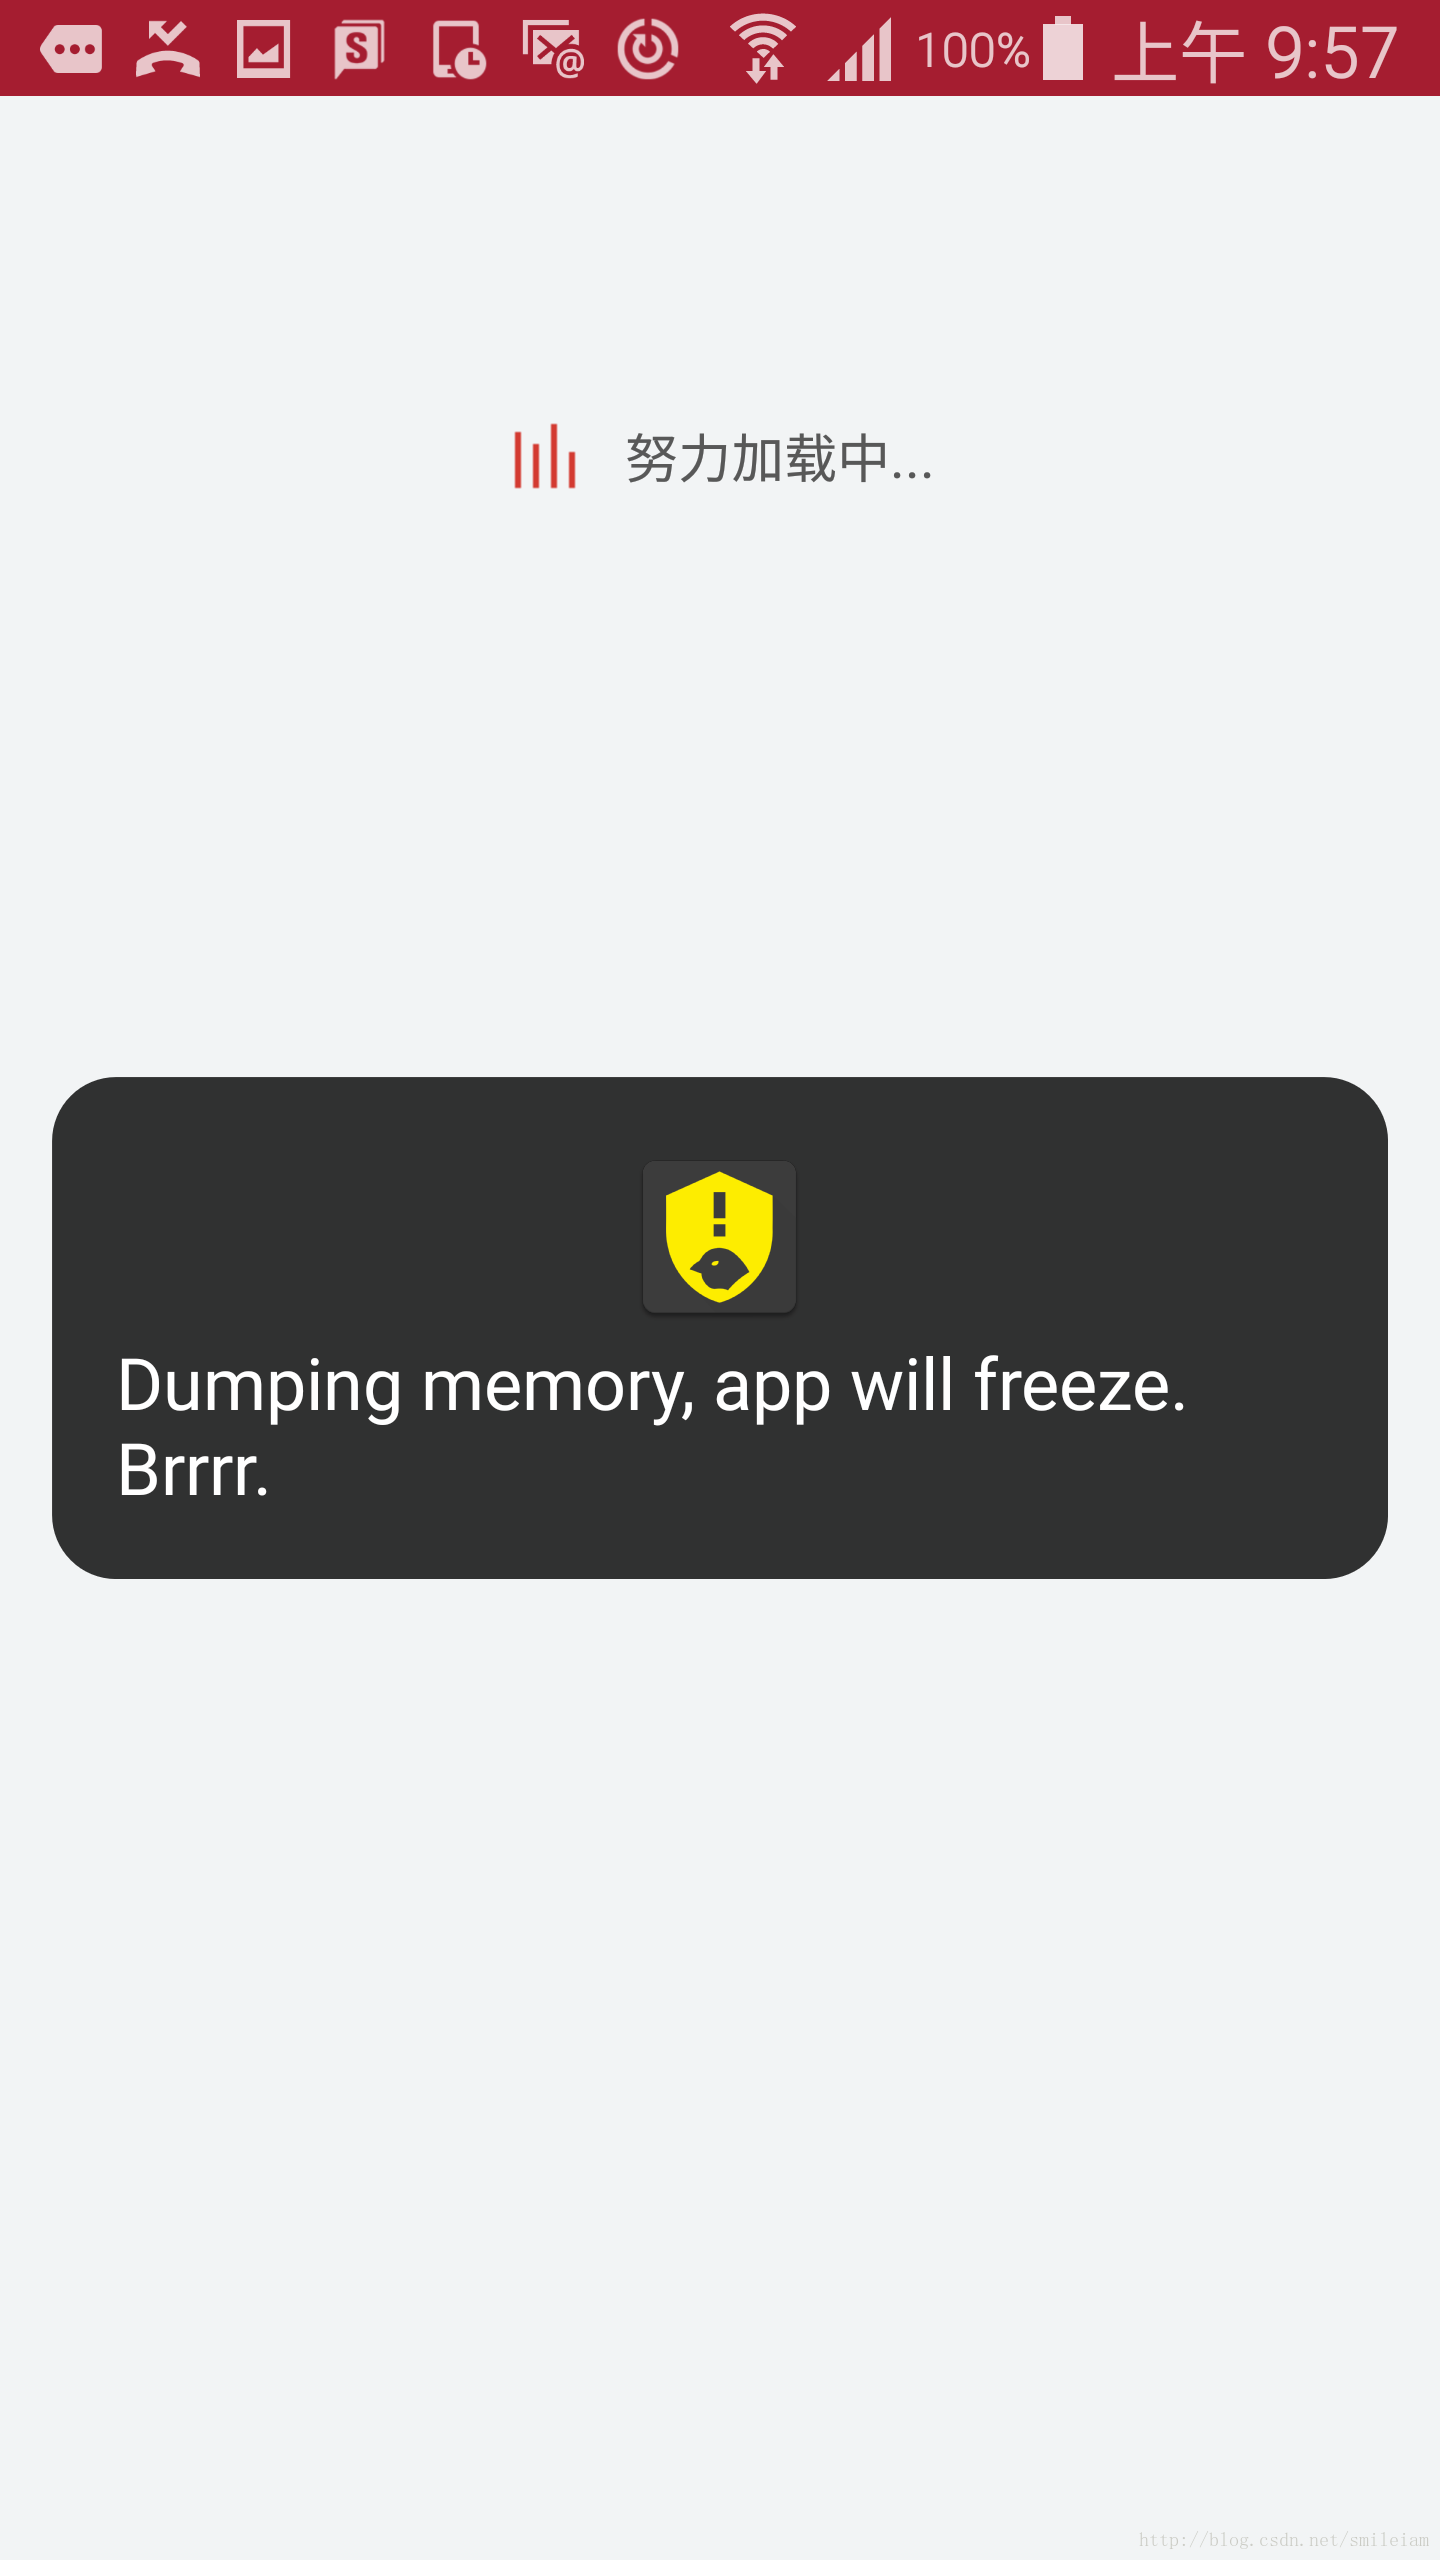
(3) 自己写一个内存泄漏的代码,看看leakcanary是否能会弹出freeze窗口,如果没有,说明leakcanary没有被正常引入工程中。
2. leakcanary不起作用原因&怎么才是正确的引入方式
2.1 为什么leakcanary不起作用呢?
按道理在basemodule里引入了leakcanary包,相应依赖它的父module也自动引入leakcanary包,可为什么没有起作用,笔者上网查了一些资料,觉得是子module通过debug或是release引入的第三方库,对于父module只对编译有效,但是不会打进父module的apk包中。
2.2 那怎么才是正确的引入方式呢?
将以下引入的module的语句写到app的 build.gradle文件中。
debugCompile 'com.squareup.leakcanary:leakcanary-android:1.5.1'
releaseCompile 'com.squareup.leakcanary:leakcanary-android-no-op:1.5.1'
或是引入leakcanary通过
compile 'com.squareup.leakcanary:leakcanary-android:1.5.1'引入,但记得release包把它注释掉,要不用户体验很不好。
四、 实例分析
如我在工程中通过上面的正确引入方式将leakcanary引入到工程中,会发现在应用图标旁边出现了一个如下图标:
我们正常运行自己的应用,如果应用发生了内存泄漏,会出app freeze页面,应用暂停几S,应该是等待leakcanary将内存泄漏文件导出:
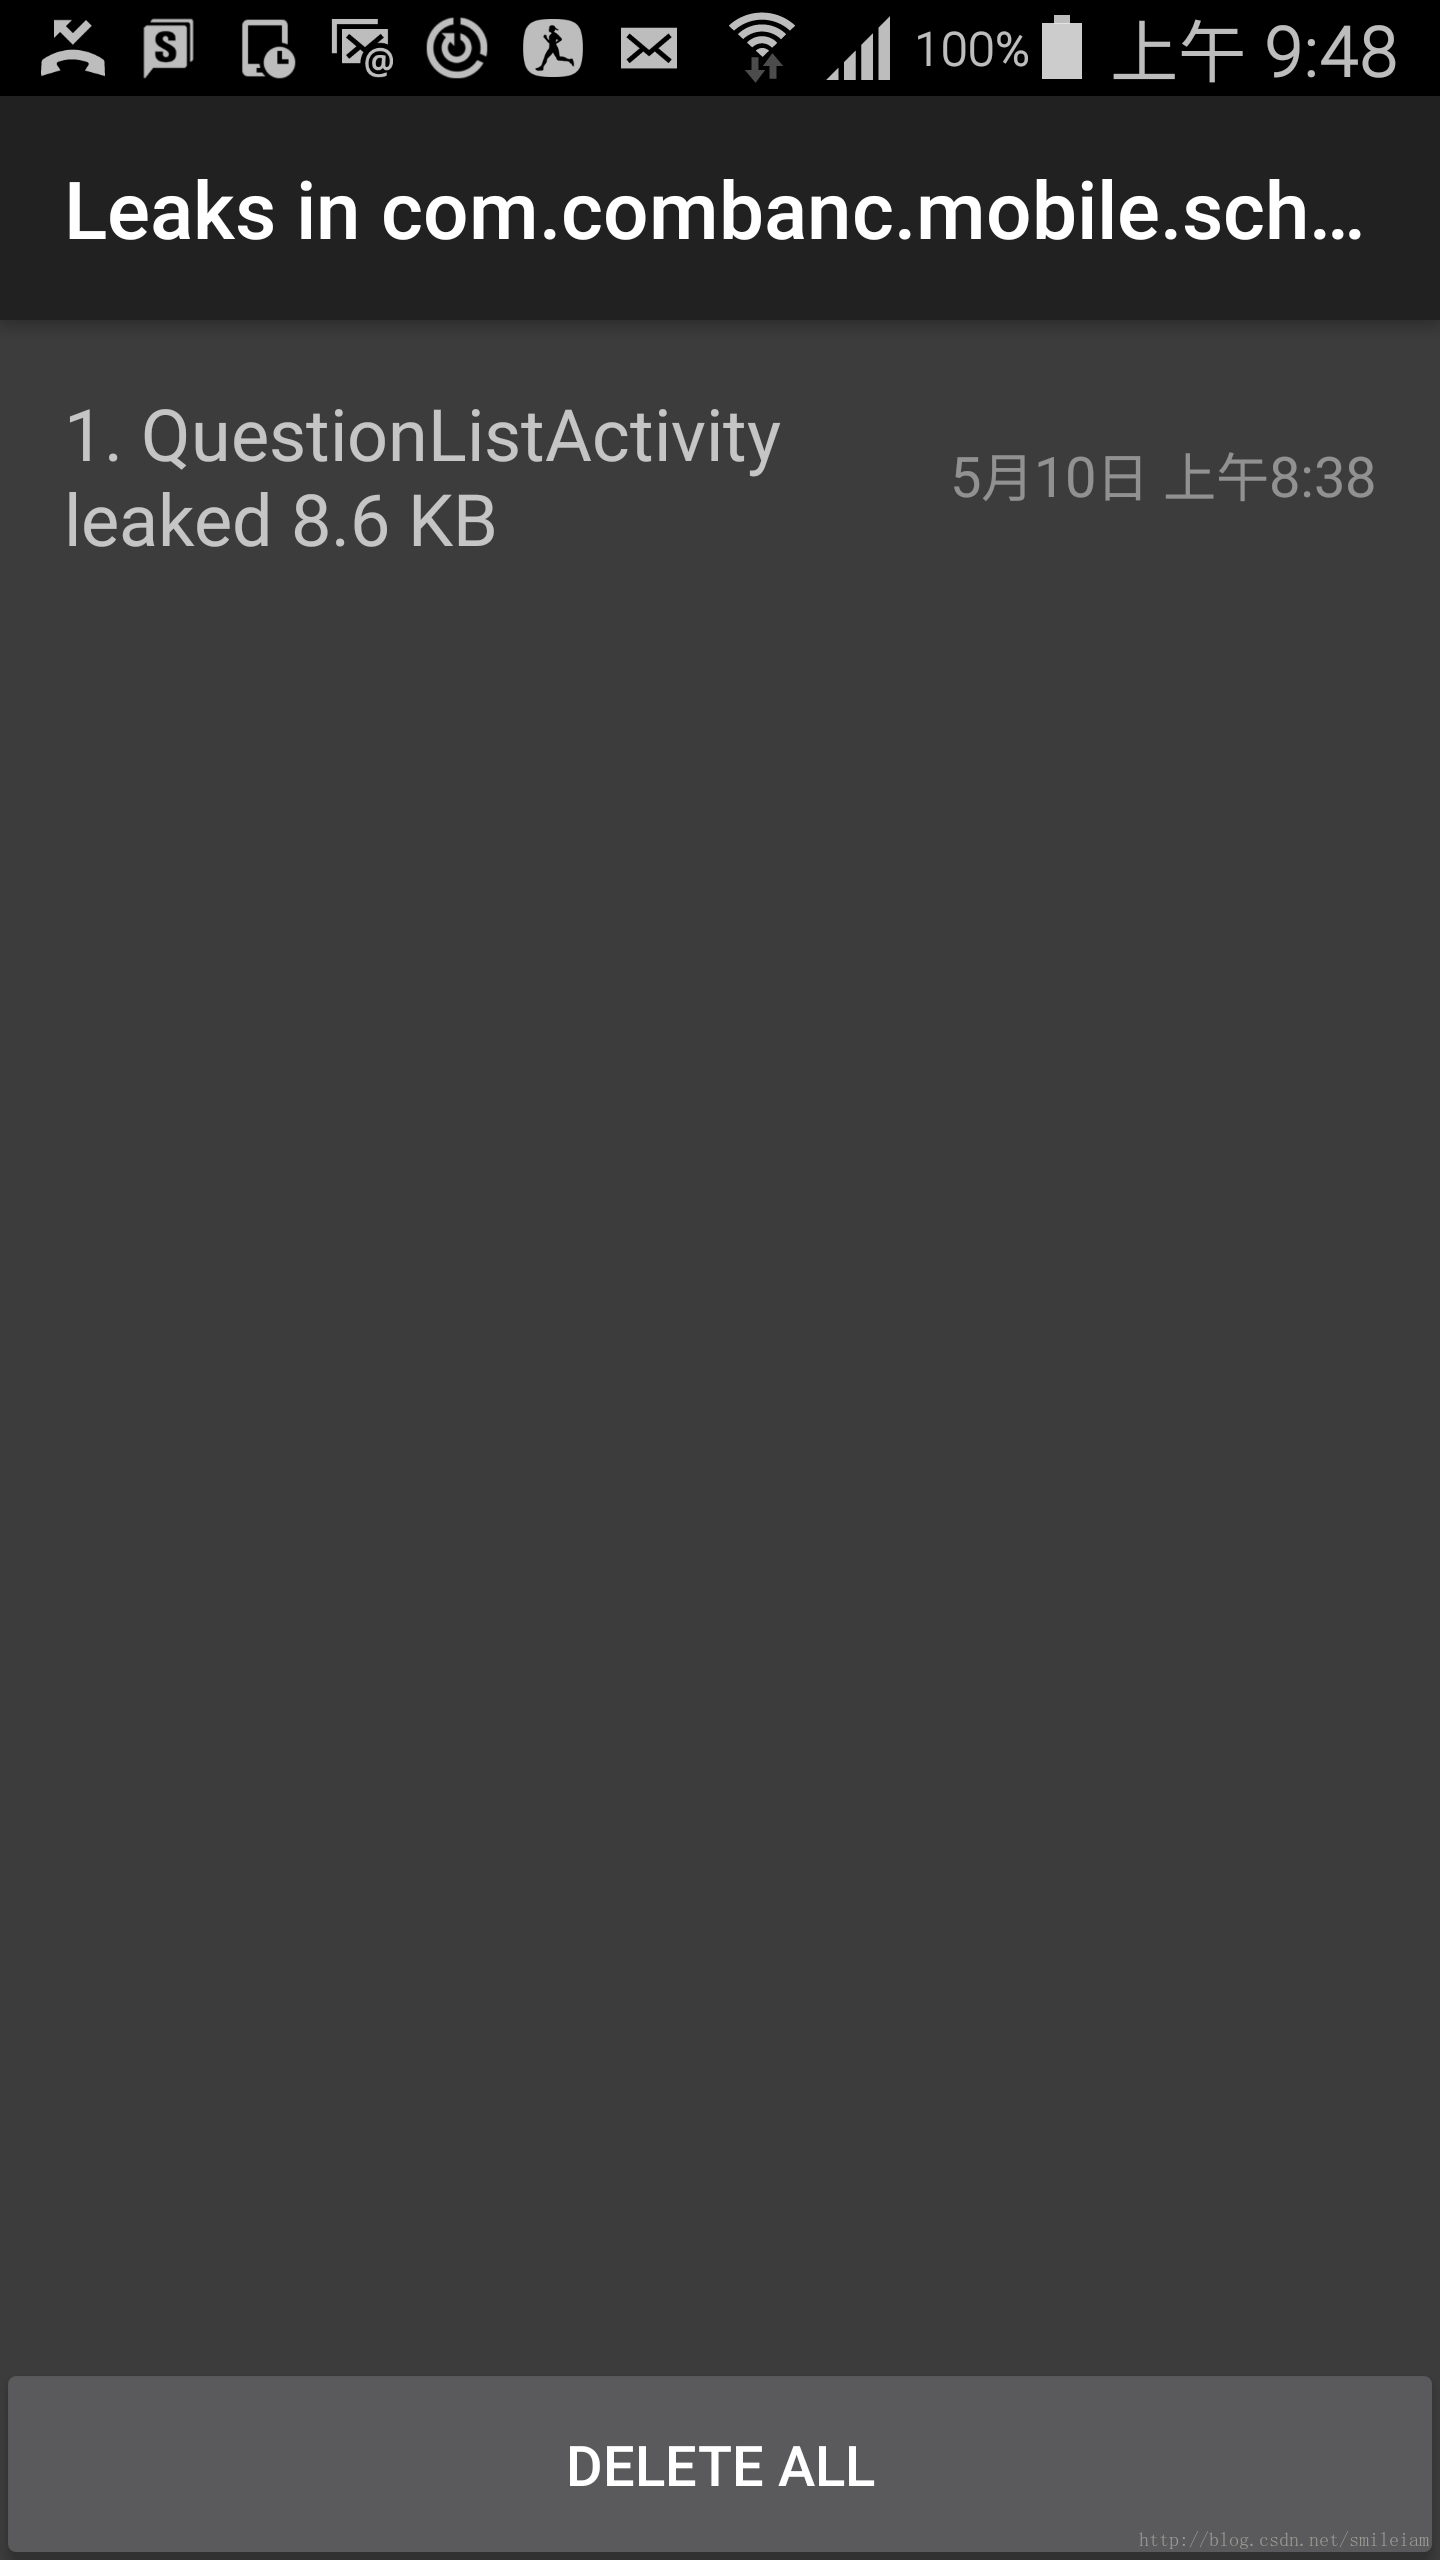
我们可以进入桌面launcher点击上面leakcanary的应用图标,查看内存泄漏发生的类及引用路径,如下图是内存泄漏的列表
点击查看详情
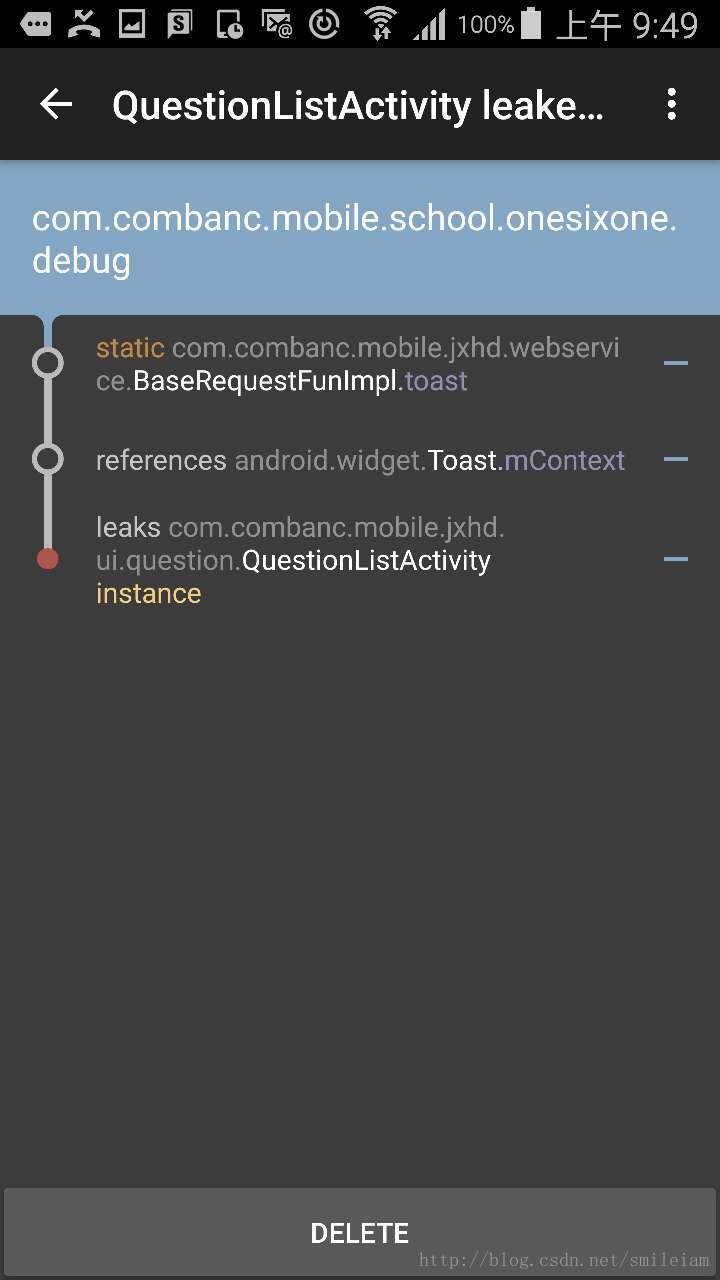
可以看到我这个内存泄漏发生在QuestionListActivity这个类里,它的实例被BaseRequestFunImpl类中的静态变量toast持有,toast的生命周期比QuestionListActivity长,导到QuestionListActivity生命周期结束时,也不能被回收。我们进入BaseRequestFunImpl类查看具体的代码。
public class BaseRequestFunImpl {
    private static Toast toast;//静态变量
    private static View toastview;

    public static void getToast(Context context) {
        if (toast == null) {
        //toast持有了context实例
            toast = new Toast(context);
        }
        if (toastview == null) {
            toastview = Toast.makeText(context, "", Toast.LENGTH_SHORT).getView();
        }
        toast.setView(toastview);
    }

    public static void showToast(String message, Context mContext) {
        try {
            getToast(mContext);
            toast.setText(message);
            toast.setDuration(Toast.LENGTH_SHORT);
            toast.show();
        } catch (Exception e) {
            e.printStackTrace();
        }
    }

    public static void fetchServiceData(RequestEnvelope requestEnvelope, RxAppCompatActivity activity, JxhdServiceCallback callback) {
        JXHDRetrofitGenerator.getJxhdInterfaceFun().queryJXHDService(requestEnvelope)
                .subscribeOn(Schedulers.io())
                .observeOn(AndroidSchedulers.mainThread())
                .compose(activity.bindUntilEvent(ActivityEvent.DESTROY))
                .doAfterTerminate(()->LoadingDialog.cancelDialogForLoading())
                .subscribe(responseEnvelope -> callback.response(responseEnvelope), throwable -> {
                    LoadingDialog.cancelDialogForLoading();
 //将activity实例传给了静态变量toast                   showToast(activity.getString(R.string.failure), activity);
                });
    }
}
代码中确实是静态变量持了类的实例,导到类生命周期结束时也无法被GC回收,导致内存泄漏,找到问题出处,接下来就是撸起袖子解决问题了。
toast的实例化可以使用Application的实例,这里只要把getToast方法改成如下即可:
public static void getToast(Context context) {
        if (toast == null) {
            toast = new Toast(context.getApplicationContext());
        }
        if (toastview == null) {
            toastview = Toast.makeText(context.getApplicationContext(), "", Toast.LENGTH_SHORT).getView();
        }
        toast.setView(toastview);
    }
这样就解决了内存泄漏问题。
总结:
本文主要讲述了leakcanary检测内存泄漏的使用方法,实现原理,使用注意事项,文末用一个实例对leakcanary的使用方法进行了实践。leakcanary确实是个好东西,但我们不能依赖它,应该根据平时检测出来的内存泄漏点,对自己平时编程习惯进行改进,争取写出不引发内存泄漏的代码。


 98
98

 被折叠的 条评论
为什么被折叠?
被折叠的 条评论
为什么被折叠?
 到【灌水乐园】发言


