


 文章分析了Udemy平台上3678条课程数据,涉及商业金融、平面设计、乐器和网页设计四大科目。大部分课程是付费的,且主要针对所有水平和初学者。课程价格与订阅人数、评论数量及内容时长的关系并不明显,但时长可能影响价格。
数据集介绍
- Udemy是一个大规模在线开放课程(MOOC)平台,提供免费和付费课程。任何人都可以创建课程,这种商业模式使Udemy拥有数十万门课程。
- Udemy Courses数据集包含3.682条来自4个科目(商业金融、平面设计、乐器和网页设计)Udemy的课程记录。
数据分析
原始数据展示
import pandas as pd
import numpy as np
import seaborn as sns
import matplotlib.pyplot as plt

data = pd.read_csv('/kaggle/input/udemy-courses/udemy_courses.csv')
data.head(10)
| course_id | course_title | url | is_paid | price | num_subscribers | num_reviews | num_lectures | level | content_duration | published_timestamp | subject | |
|---|---|---|---|---|---|---|---|---|---|---|---|---|
| 0 | 1070968 | Ultimate Investment Banking Course | https://www.udemy.com/ultimate-investment-bank… | True | 200 | 2147 | 23 | 51 | All Levels | 1.5 | 2017-01-18T20:58:58Z | Business Finance |
| 1 | 1113822 | Complete GST Course & Certification - Grow You… | https://www.udemy.com/goods-and-services-tax/ | True | 75 | 2792 | 923 | 274 | All Levels | 39.0 | 2017-03-09T16:34:20Z | Business Finance |
| 2 | 1006314 | Financial Modeling for Business Analysts and C… | https://www.udemy.com/financial-modeling-for-b… | True | 45 | 2174 | 74 | 51 | Intermediate Level | 2.5 | 2016-12-19T19:26:30Z | Business Finance |
| 3 | 1210588 | Beginner to Pro - Financial Analysis in Excel … | https://www.udemy.com/complete-excel-finance-c… | True | 95 | 2451 | 11 | 36 | All Levels | 3.0 | 2017-05-30T20:07:24Z | Business Finance |
| 4 | 1011058 | How To Maximize Your Profits Trading Options | https://www.udemy.com/how-to-maximize-your-pro… | True | 200 | 1276 | 45 | 26 | Intermediate Level | 2.0 | 2016-12-13T14:57:18Z | Business Finance |
| 5 | 192870 | Trading Penny Stocks: A Guide for All Levels I… | https://www.udemy.com/trading-penny-stocks-a-g… | True | 150 | 9221 | 138 | 25 | All Levels | 3.0 | 2014-05-02T15:13:30Z | Business Finance |
| 6 | 739964 | Investing And Trading For Beginners: Mastering… | https://www.udemy.com/investing-and-trading-fo… | True | 65 | 1540 | 178 | 26 | Beginner Level | 1.0 | 2016-02-21T18:23:12Z | Business Finance |
| 7 | 403100 | Trading Stock Chart Patterns For Immediate, Ex… | https://www.udemy.com/trading-chart-patterns-f… | True | 95 | 2917 | 148 | 23 | All Levels | 2.5 | 2015-01-30T22:13:03Z | Business Finance |
| 8 | 476268 | Options Trading 3 : Advanced Stock Profit and … | https://www.udemy.com/day-trading-stock-option… | True | 195 | 5172 | 34 | 38 | Expert Level | 2.5 | 2015-05-28T00:14:03Z | Business Finance |
| 9 | 1167710 | The Only Investment Strategy You Need For Your… | https://www.udemy.com/the-only-investment-stra… | True | 200 | 827 | 14 | 15 | All Levels | 1.0 | 2017-04-18T18:13:32Z | Business Finance |
data.shape
(3678, 12)
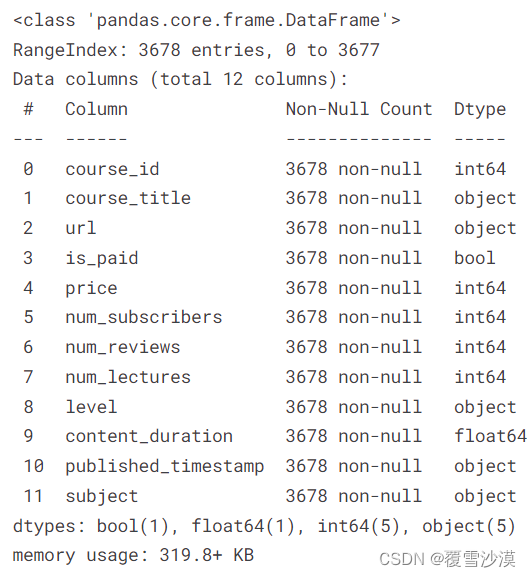
df.info()
df.describe()
| course_id | price | num_subscribers | num_reviews | num_lectures | content_duration | |
|---|---|---|---|---|---|---|
| count | 3.678000e+03 | 3678.000000 | 3678.000000 | 3678.000000 | 3678.000000 | 3678.000000 |
| mean | 6.759720e+05 | 66.049483 | 3197.150625 | 156.259108 | 40.108755 | 4.094517 |
| std | 3.432732e+05 | 61.005755 | 9504.117010 | 935.452044 | 50.383346 | 6.053840 |
| min | 8.324000e+03 | 0.000000 | 0.000000 | 0.000000 | 0.000000 | 0.000000 |
| 25% | 4.076925e+05 | 20.000000 | 111.000000 | 4.000000 | 15.000000 | 1.000000 |
| 50% | 6.879170e+05 | 45.000000 | 911.500000 | 18.000000 | 25.000000 | 2.000000 |
| 75% | 9.613555e+05 | 95.000000 | 2546.000000 | 67.000000 | 45.750000 | 4.500000 |
| max | 1.282064e+06 | 200.000000 | 268923.000000 | 27445.000000 | 779.000000 | 78.500000 |
数据预处理
- 检查空值
- 去除无用列属性
- 去除重复行
- 更改列属性类型
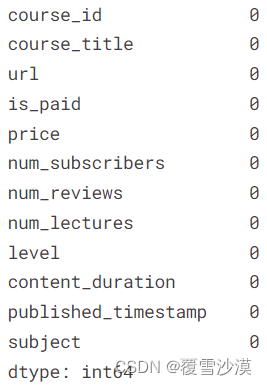
df.isnull().sum() #检查空值
df.drop('url',axis=1,inplace=True) #去除无用的“url”属性
df['published_timestamp']=pd.to_datetime(df['published_timestamp']) # 将“published_timestamp”属性规范化为日期格式
df[df.duplicated()] #展示重复行
| course_id | course_title | is_paid | price | num_subscribers | num_reviews | num_lectures | level | content_duration | published_timestamp | subject | |
|---|---|---|---|---|---|---|---|---|---|---|---|
| 787 | 837322 | Essentials of money value: Get a financial Life ! | True | 20 | 0 | 0 | 20 | All Levels | 0.616667 | 2016-05-16 18:28:30+00:00 | Business Finance |
| 788 | 1157298 | Introduction to Forex Trading Business For Beg… | True | 20 | 0 | 0 | 27 | Beginner Level | 1.500000 | 2017-04-23 16:19:01+00:00 | Business Finance |
| 894 | 1035638 | Understanding Financial Statements | True | 25 | 0 | 0 | 10 | All Levels | 1.000000 | 2016-12-15 14:56:17+00:00 | Business Finance |
| 1100 | 1084454 | CFA Level 2- Quantitative Methods | True | 40 | 0 | 0 | 35 | All Levels | 5.500000 | 2017-07-02 14:29:35+00:00 | Business Finance |
| 1473 | 185526 | MicroStation - Células | True | 20 | 0 | 0 | 9 | Beginner Level | 0.616667 | 2014-04-15 21:48:55+00:00 | Graphic Design |
| 2561 | 28295 | Learn Web Designing & HTML5/CSS3 Essentials in… | True | 75 | 43285 | 525 | 24 | All Levels | 4.000000 | 2013-01-03 00:55:31+00:00 | Web Development |
df.drop_duplicates(inplace=True)
可视化分析
# 词云展示
from wordcloud import WordCloud
text = " ".join(subject_titles for subject_titles in df["course_title"])
word_cloud = WordCloud(collocations = False,background_color='white', colormap = 'YlGnBu', min_font_size = 8).generate(text)
plt.figure(figsize = (20, 8))
plt.imshow(word_cloud, interpolation = 'bilinear')
plt.axis("off")
plt.show()

sns.countplot('is_paid',data=df, palette = [ 'darkblue', 'lightseagreen'])
plt.title('Paid vs Free courses')
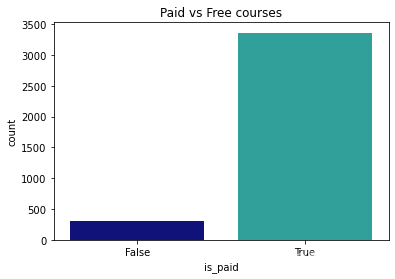
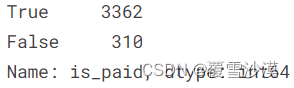
大部分课程为付费课程
df['is_paid'].value_counts()
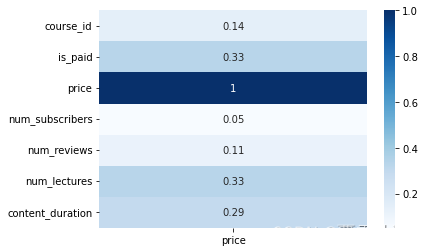
sns.heatmap(df.corr()[["price"]], cmap="Blues", annot=True);
plt.figure(figsize=(16,8))
sns.heatmap(df.corr(),annot=True,cmap="Blues")
plt.show()
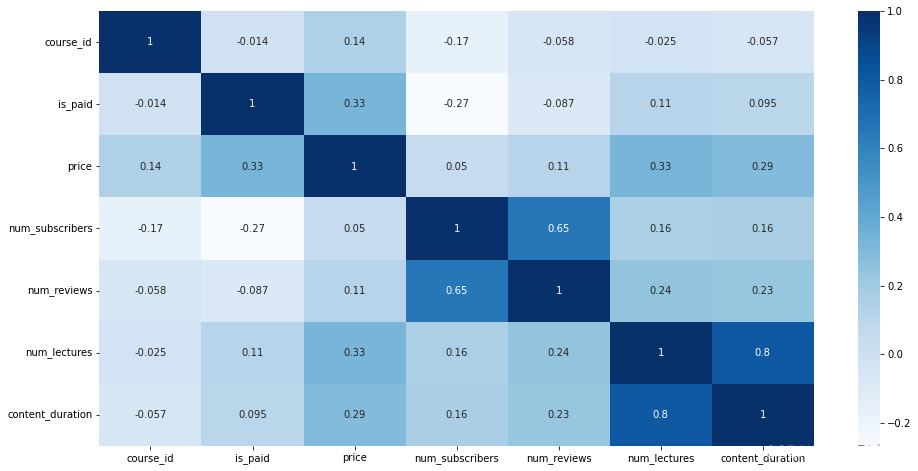
大部分属性与“价格”属性相关
import plotly.express as px
%matplotlib inline
df['tmp'] = 1
fig = px.pie(df, names='level',values='tmp',hole = 0.8,title='relation tips',color_discrete_sequence=px.colors.diverging.Portland)
fig.update_traces(textposition='outside', textinfo='percent+label')
fig.update_layout(
    title_text="level percentage",
    annotations=[dict(text='Course Levels', x=0.5, y=0.5, font_size=20, showarrow=False)])
plt.figure(figsize=(8,6))
sns.countplot('level',data=df, palette = [ 'darkblue', 'lightseagreen', 'teal', 'cadetblue'] )
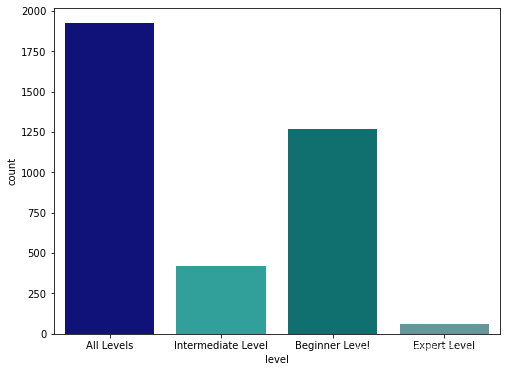
大部分课程面向各经验段或初学者
df['subject'].value_counts()
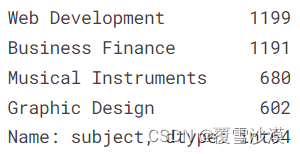
大部分课程为为网页开发或商业金融方向
levels = ['All Levels','Beginner Level','Intermediate Level','Expert Level']
numbers = []
for i in df['subject'].unique():
    tempDF = df[df['subject']==i]
    for j in levels:
        numbers.append([i,j,len(tempDF[tempDF['level']==j])])
data = {
    'Subject':[i[0] for i in numbers],
    'Level':[i[1] for i in numbers],
    'Count':[i[2] for i in numbers]
}
splitDF = pd.DataFrame(numbers,columns=['Subject','Level','Count'])
plt.figure(figsize=(16,8))
sns.barplot(data=splitDF,x='Subject',y='Count',hue='Level',palette = [ 'darkblue', 'lightseagreen', 'teal', 'cadetblue'])
plt.title(label='Level distribution matched to each subject.')
plt.show()
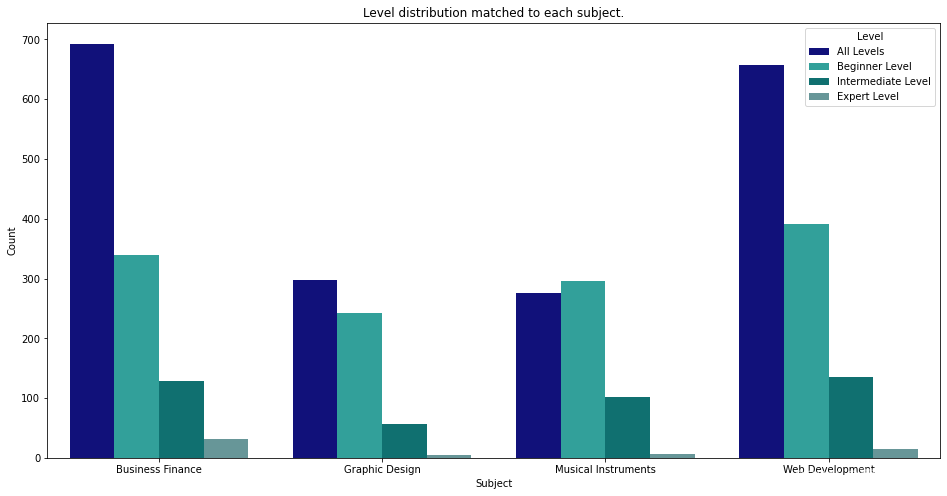
不同学习方向的课程难度分布
plt.figure(figsize=(12,8))
sns.regplot(x='price',y='num_subscribers',data=df)

课程订阅人数 VS 课程价格
plt.figure(figsize=(12,8))
sns.scatterplot(x='price',y='num_subscribers',data=df)
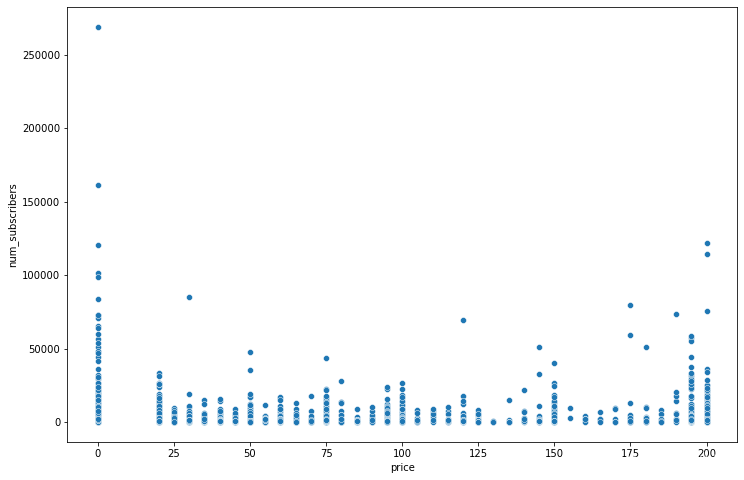
课程价格与订阅人数无关
plt.figure(figsize=(12,8))
sns.regplot(x='price',y='num_reviews',data=df)
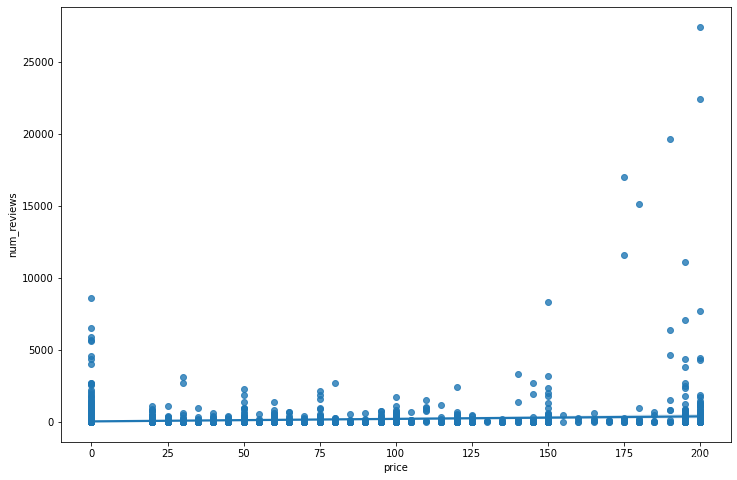
课程价格与评论人数无关
plt.figure(figsize=(12,8))
sns.regplot(x='price',y='content_duration',data=df)
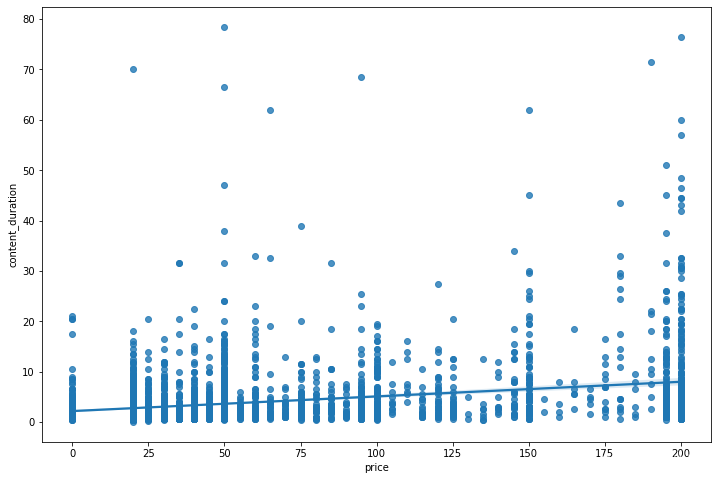
课程时长可能影响课程价格
plt.figure(figsize=(12,8))
sns.regplot(x='num_subscribers',y='content_duration',data=df)
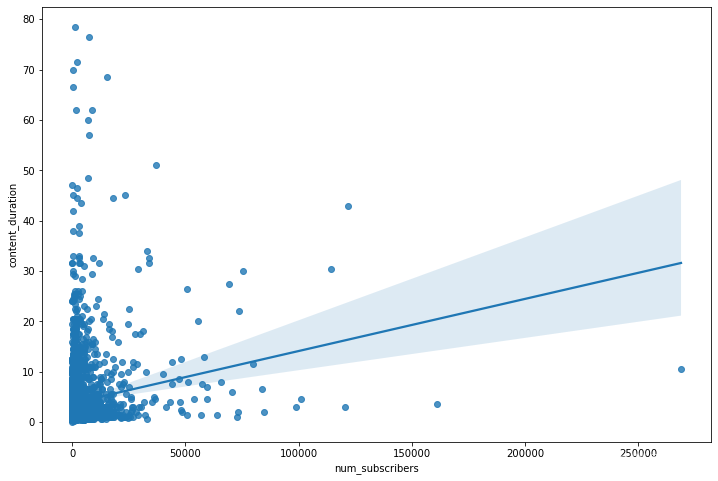
课程时长越长,订阅人数越多


 被折叠的 条评论
为什么被折叠?
被折叠的 条评论
为什么被折叠?
 到【灌水乐园】发言


