


 文章对Coursera平台的课程数据进行了深入分析,包括课程评分分布、难度级别与学生注册情况。数据显示,课程平均评分较高,中级课程评分可能因学习者期望严格而稍低。此外,还探讨了课程难度、评分和证书类型之间的关系,以及课程提供者的评价排名。
介绍
Coursera
Coursera是全球最大的在线教育平台,拥有超过4000万注册用户,Coursera由美国斯坦福大学两名计算机科学教授达芙妮科勒 (Daphne Koller) 和吴恩达 (Andrew Ng) 于2012年在美国加利福尼亚州创办,其愿景是为世界各地的学习者提供变革性的学习体验。
Coursera上的所有课程都是由知名大学和顶尖公司或者其他学术机构提供的,认可度高。提供了世界上一些呗级大学的学位,例如耶鲁大学,伦敦帝国理工学院和 日内瓦大学。用户可以像完成普通大学一样,修卖完整的学士或硕士学位并获得认证。Coursera通过领先机构的高度合作关系,实现了在线教育领域变革性改变。迄今 为止,Cousera已经吸引了7.6亿亿多名学习者,100多家世界500强公司,包括以及6,400多家学校,企业和政府加入到Coursera。
数据集
Course dataset scrapped from Coursera website. This dataset contains mainly 6 columns and 890 course data. The detailed description:
course_title : Contains the course title.
course_organization : It tells which organization is conducting the courses.
courseCertificatetype : It has details about what are the different certifications available in courses.
course_rating : It has the ratings associated with each course.
course_difficulty : It tells about how difficult or what is the level of the course.
course_students_enrolled : It has the number of students that are enrolled in the course.
课程属性分析
import pandas as pd
import numpy as np
import matplotlib.pyplot as plt
import scipy.stats as sps
import os
import seaborn as sns
from scipy import stats
import warnings

import os
warnings.filterwarnings('ignore')
df=pd.read_csv("/kaggle/input/coursera-course-dataset/coursea_data.csv")
df=df.drop("Unnamed: 0",axis=1)
df.describe(include=['object']).T
| count | unique | top | freq | |
|---|---|---|---|---|
| course_title | 891 | 888 | Developing Your Musicianship | 2 |
| course_organization | 891 | 154 | University of Pennsylvania | 59 |
| course_Certificate_type | 891 | 3 | COURSE | 582 |
| course_difficulty | 891 | 4 | Beginner | 487 |
| course_students_enrolled | 891 | 205 | 120k | 22 |
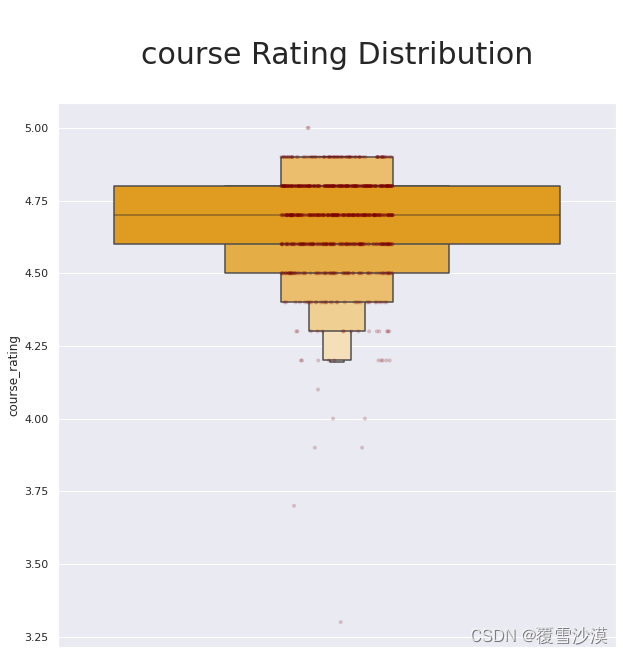
课程平均分为4.68,课程质量较高,最小值3.3,最大值5.
————————————————–——————————
评分分布
sns.set(rc={'figure.figsize':(10,10)})
ax = sns.boxenplot( y="course_rating", data=df,
                   showfliers=False,color='orange')
ax = sns.stripplot( y="course_rating", data=df,
                   size=4, color="maroon",alpha=0.2)
ax.axes.set_title("\ncourse Rating Distribution\n",fontsize=30)
sns.set(rc={'figure.figsize':(10,5)})
p=sns.distplot(df['course_rating'],color='darkcyan',fit_kws={"color":"red"},fit=stats.gamma, label="label 1")
p.axes.set_title("\ncourse Rating Distribution\n",fontsize=30)

难度-评分 联合分布
sns.set(rc={'figure.figsize':(20,10)})
ax = sns.countplot(hue="course_rating", x="course_difficulty", data=df,palette="mako")
ax.axes.set_title("\nFrequency Distribution based on difficulty\n",fontsize=20)
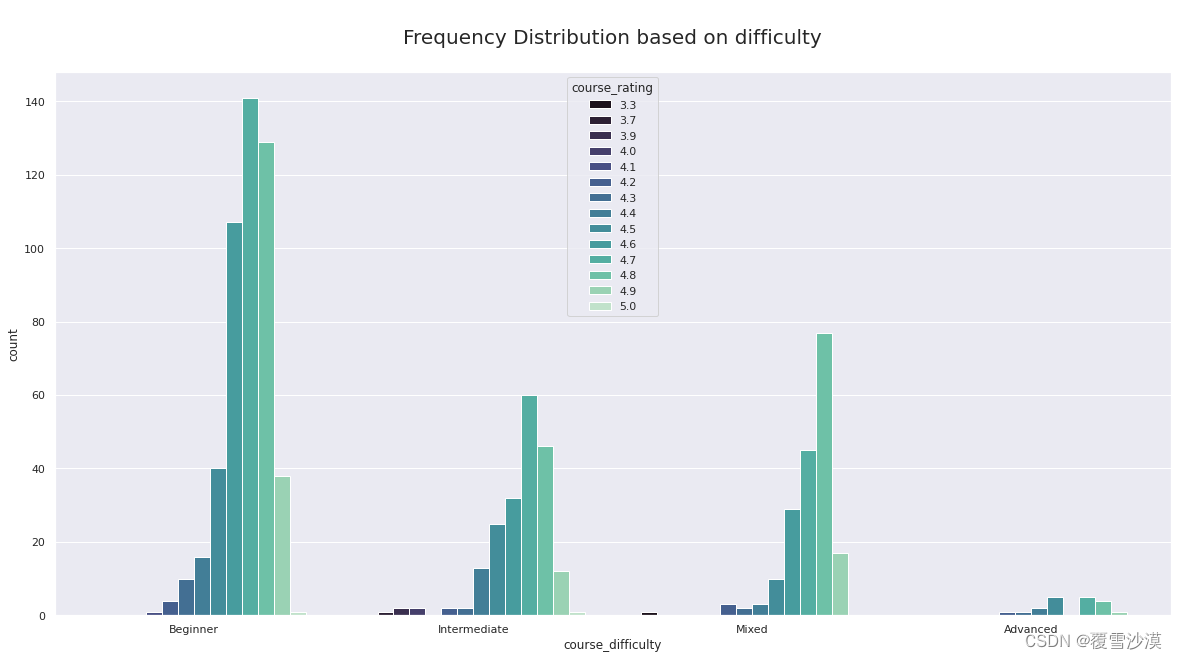
高级课程由于数量较少评分起伏不大;初级课程的评分分布与总的评分分布相接近;中级课程的评分峰值不是很高,可能由于学习者积累了一定知识,评分时更加严格。
评分-类型 联合分布
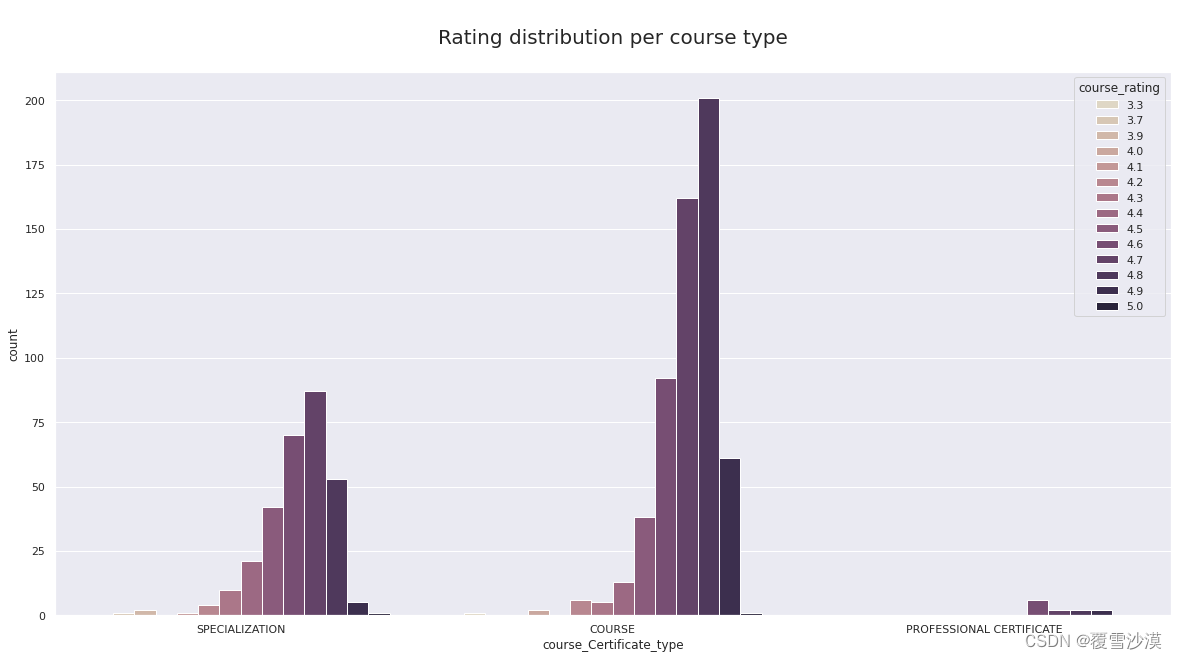
sns.set(rc={'figure.figsize':(20,10)})
ax = sns.countplot(hue="course_rating", x="course_Certificate_type", data=df,palette="ch:s=-.2,r=.6")
ax.axes.set_title("\nRating distribution per course type\n",fontsize=20)
评分-类型-难度 联合分布
sns.set(rc={'figure.figsize':(10,5)})
ax = sns.countplot(hue="course_difficulty", x="course_Certificate_type", data=df,palette="rocket_r")
ax.axes.set_title("\nRating distribution per course type : Combined\n",fontsize=20)
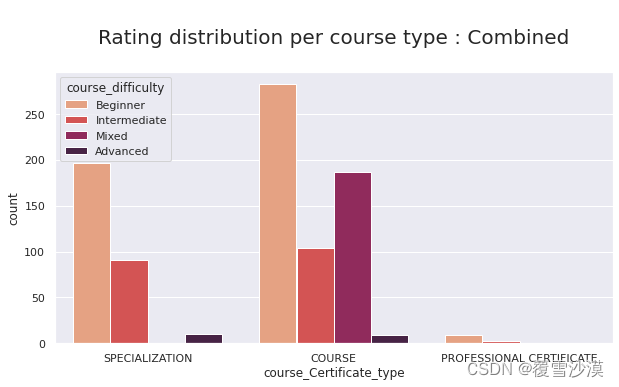
混合难度的课程分布不稳定,其余分布均比较稳定
证书分布
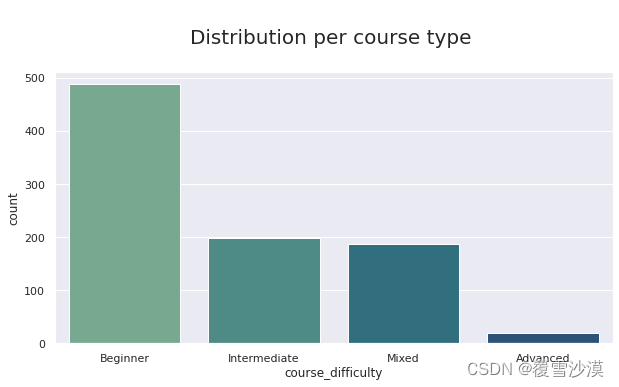
sns.set(rc={'figure.figsize':(10,5)})
ax = sns.countplot( x="course_difficulty", data=df,palette="crest")
ax.axes.set_title("\nDistribution per course type \n",fontsize=20)
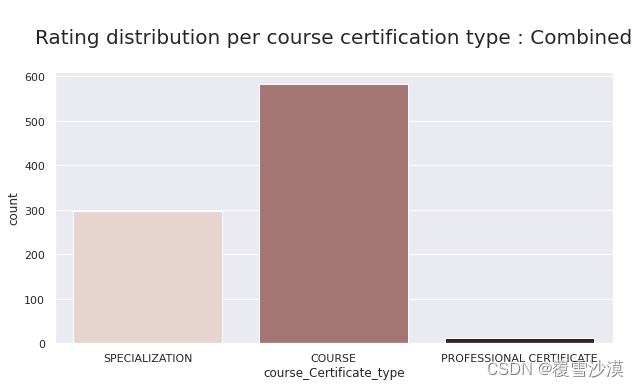
sns.set(rc={'figure.figsize':(10,5)})
ax = sns.countplot( x="course_Certificate_type", data=df,palette="ch:s=.8,r=.1")
ax.axes.set_title("\nRating distribution per course certification type : Combined\n",fontsize=20)
数据清洗
- 去除第一列
- 删除课程名属性(课程名不唯一,可以用id替代)
- 其它
修改注册人数数值表示
df_fe1=df.copy()
def course_students_enrolled_modifier(x):
    return x[:-2]
df_fe1['course_students_enrolled_modified']=df_fe1['course_students_enrolled'].apply(course_students_enrolled_modifier)
df_fe1['course_students_enrolled_modified']=df_fe1['course_students_enrolled_modified'].apply(pd.to_numeric)
df_fe1 =df_fe1.drop(['course_students_enrolled'],axis=1)
df_fe1
| course_title | course_organization | course_Certificate_type | course_rating | course_difficulty | course_students_enrolled_modified | |
|---|---|---|---|---|---|---|
| 0 | (ISC)² Systems Security Certified Practitioner… | (ISC)² | SPECIALIZATION | 4.7 | Beginner | 5.0 |
| 1 | A Crash Course in Causality: Inferring Causal… | University of Pennsylvania | COURSE | 4.7 | Intermediate | 1.0 |
| 2 | A Crash Course in Data Science | Johns Hopkins University | COURSE | 4.5 | Mixed | 13.0 |
| 3 | A Law Student’s Toolkit | Yale University | COURSE | 4.7 | Mixed | 9.0 |
| 4 | A Life of Happiness and Fulfillment | Indian School of Business | COURSE | 4.8 | Mixed | 32.0 |
| … | … | … | … | … | … | … |
将课程难度属性修改为数值类型
def course_difficulty_modifier(x):
    if x=="Beginner":
        return "0"
    elif x=="Intermediate":
        return "1"
    elif x=="Mixed":
        return "0.5"
    elif x=="Advanced":
        return "2"
    else:
        return "0"
"""as most courses are beginner level, we are assuming undefined will be beginner too."""
df_fe1['course_difficulty_modified']=df_fe1['course_difficulty'].apply(course_difficulty_modifier)
df_fe1['course_difficulty_modified']=df_fe1['course_difficulty_modified'].apply(pd.to_numeric)
df_fe1 =df_fe1.drop(['course_difficulty'],axis=1)
df_fe1
| course_title | course_organization | course_Certificate_type | course_rating | course_difficulty | course_students_enrolled_modified | |
|---|---|---|---|---|---|---|
| 0 | (ISC)² Systems Security Certified Practitioner… | (ISC)² | SPECIALIZATION | 4.7 | 0.0 | 5.0 |
| 1 | A Crash Course in Causality: Inferring Causal… | University of Pennsylvania | COURSE | 4.7 | 1.0 | 1.0 |
| 2 | A Crash Course in Data Science | Johns Hopkins University | COURSE | 4.5 | 0.5 | 13.0 |
| 3 | A Law Student’s Toolkit | Yale University | COURSE | 4.7 | 0.5 | 9.0 |
| 4 | A Life of Happiness and Fulfillment | Indian School of Business | COURSE | 4.8 | 0.5 | 32.0 |
| … | … | … | … | … | … | … |
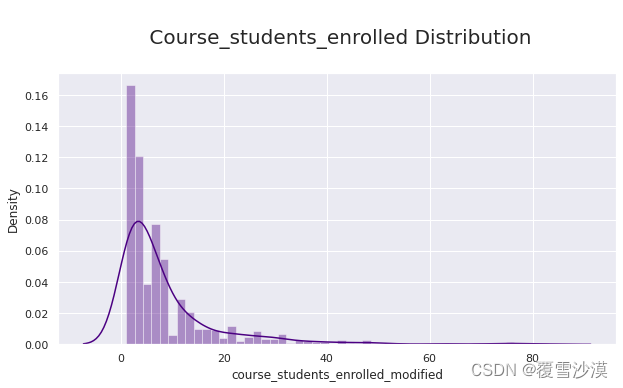
注册人数分布
df_fe1[['course_difficulty_modified','course_students_enrolled_modified']].describe()
| course_difficulty_modified | course_students_enrolled_modified | |
|---|---|---|
| count | 891.000000 | 881.000000 |
| mean | 0.369809 | 8.511918 |
| std | 0.472738 | 10.731756 |
| min | 0.000000 | 1.000000 |
| 25% | 0.000000 | 2.000000 |
| 50% | 0.000000 | 5.000000 |
| 75% | 0.500000 | 9.000000 |
| max | 2.000000 | 83.000000 |
sns.set(rc={'figure.figsize':(10,5)})
p=sns.distplot(df_fe1['course_students_enrolled_modified'],color='indigo')
p.axes.set_title("\n Course_students_enrolled Distribution\n",fontsize=20)
相关性分析
corrM = df_numaric.corr()
corrM
| course_rating | course_students_enrolled_modified | course_difficulty_modified | |
|---|---|---|---|
| course_rating | 1.000000 | 0.015939 | -0.089810 |
| course_students_enrolled_modified | 0.015939 | 1.000000 | -0.011343 |
| course_difficulty_modified | -0.089810 | -0.011343 | 1.000000 |
sns.set(rc={'figure.figsize':(10,5)})
ax = sns.scatterplot( x='course_rating', y='course_difficulty_modified', data=df_numaric,palette="crest")
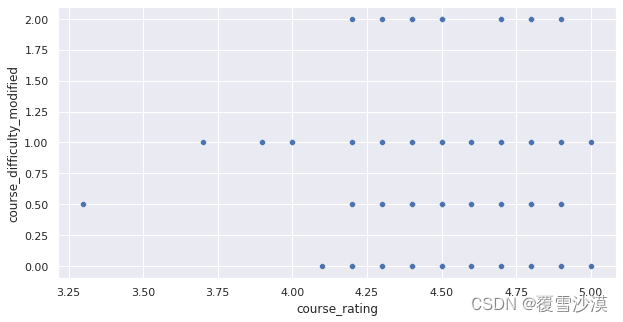
课程难度与评分无显著相关性
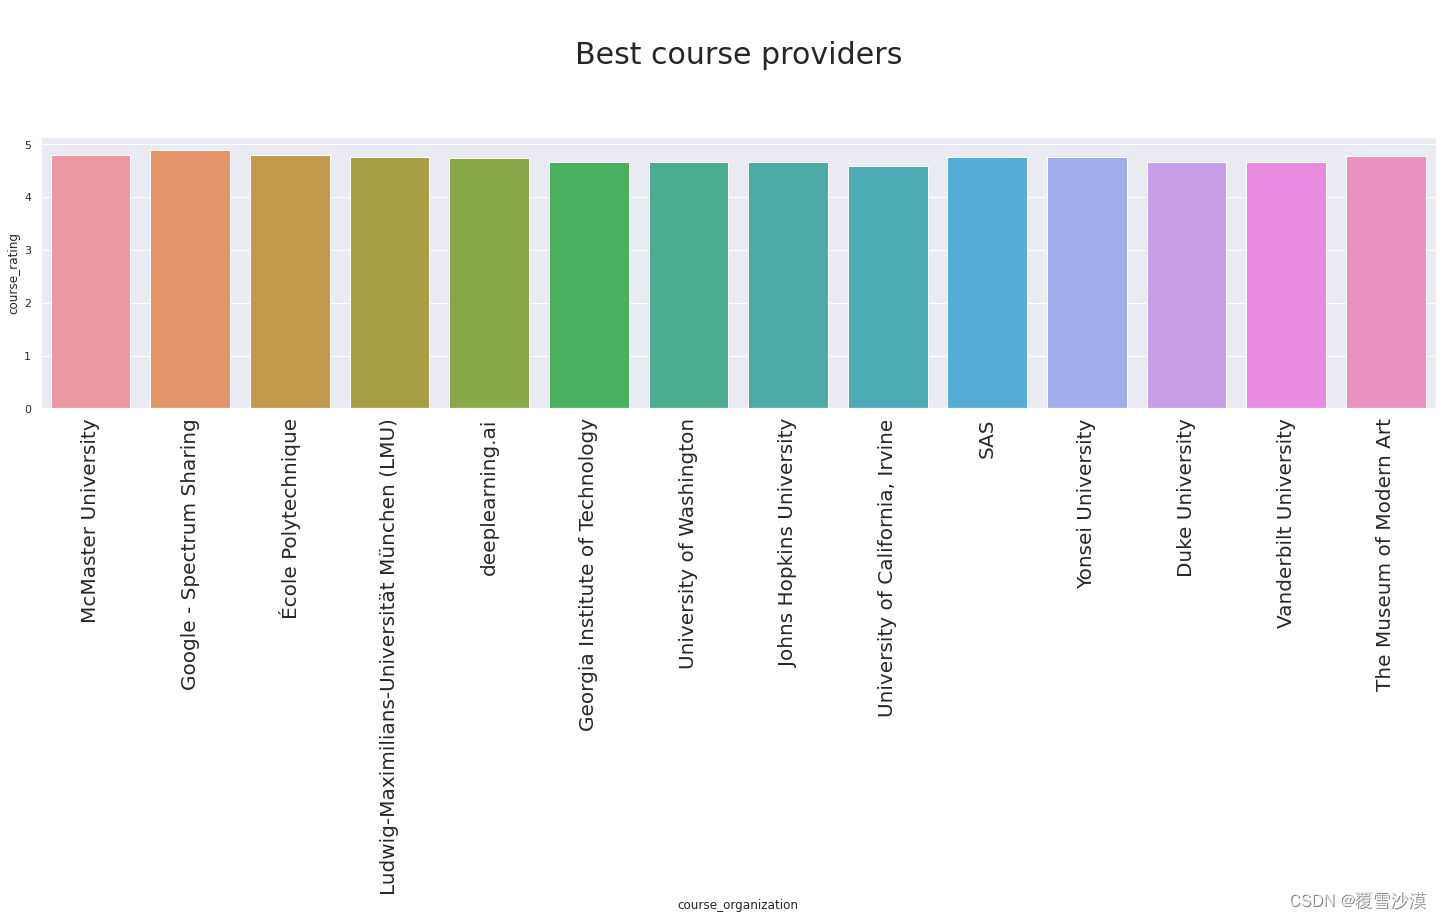
Top Rated Course Provider
df['course_title']=df['course_title']

g_uni['overall_rating']=(g_uni['course_students_enrolled_modified']/g_uni['course_students_enrolled_modified'].max())*3+(g_uni['course_rating']/g_uni['course_rating'].max())*7
g_uni=g_uni.sort_values(by='overall_rating',ascending=False)

g_uni.overall_rating.describe().T
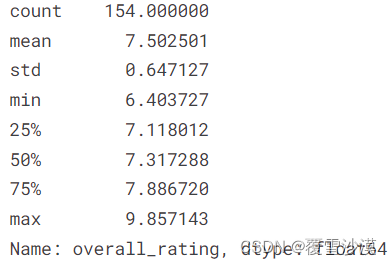
g_unix=g_uni[g_uni['overall_rating']>=8.5]
g_unix
| course_organization | course_students_enrolled_modified | course_rating | size | overall_rating | |
|---|---|---|---|---|---|
| 58 | McMaster University | 23.000000 | 4.800000 | 1 | 9.857143 |
| 33 | Google - Spectrum Sharing | 21.000000 | 4.900000 | 1 | 9.739130 |
| 151 | École Polytechnique | 19.000000 | 4.800000 | 1 | 9.335404 |
| 52 | Ludwig-Maximilians-Universität München (LMU) | 19.000000 | 4.750000 | 2 | 9.263975 |
| 150 | deeplearning.ai | 18.344495 | 4.743750 | 16 | 9.169546 |
| 30 | Georgia Institute of Technology | 17.700000 | 4.660000 | 10 | 8.965839 |
| 142 | University of Washington | 16.600000 | 4.660000 | 5 | 8.822360 |
| 48 | Johns Hopkins University | 15.678571 | 4.660714 | 28 | 8.703194 |
| 123 | University of California, Irvine | 16.148148 | 4.596296 | 27 | 8.672418 |
| 79 | SAS | 13.666667 | 4.766667 | 3 | 8.592133 |
| 149 | Yonsei University | 13.750000 | 4.750000 | 4 | 8.579193 |
| 20 | Duke University | 14.500000 | 4.664286 | 28 | 8.554570 |
| 145 | Vanderbilt University | 14.333333 | 4.666667 | 3 | 8.536232 |
| 92 | The Museum of Modern Art | 13.000000 | 4.783333 | 6 | 8.528986 |
sns.set(rc={'figure.figsize':(25,5)})
plt.xticks(fontsize=20,rotation='vertical')
p=sns.barplot(x='course_organization',y="course_rating",data=g_unix,hue_order=g_uni['overall_rating'])
p.axes.set_title("\nBest course providers\n\n",fontsize=30)
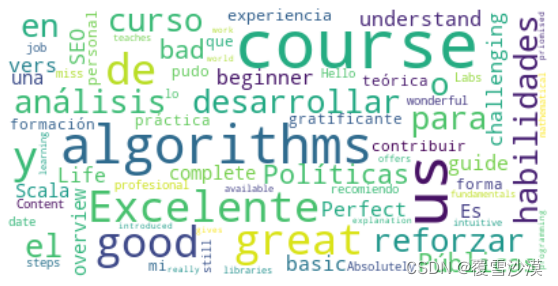
课程评论分析
r=pd.read_csv('/kaggle/input/course-reviews-on-coursera/Coursera_reviews.csv')
r.head()
| reviews | reviewers | date_reviews | rating | course_id | |
|---|---|---|---|---|---|
| 0 | Pretty dry, but I was able to pass with just t… | By Robert S | Feb 12, 2020 | 4 | google-cbrs-cpi-training |
| 1 | would be a better experience if the video and … | By Gabriel E R | Sep 28, 2020 | 4 | google-cbrs-cpi-training |
| 2 | Information was perfect! The program itself wa… | By Jacob D | Apr 08, 2020 | 4 | google-cbrs-cpi-training |
| 3 | A few grammatical mistakes on test made me do … | By Dale B | Feb 24, 2020 | 4 | google-cbrs-cpi-training |
| 4 | Excellent course and the training provided was… | By Sean G | Jun 18, 2020 | 4 | google-cbrs-cpi-training |
from wordcloud import WordCloud, STOPWORDS, ImageColorGenerator
from PIL import Image
import nltk
nltk.download('stopwords')
from nltk.corpus import stopwords
from nltk.stem.porter import PorterStemmer
from collections import Counter
import cufflinks as cf
from vaderSentiment.vaderSentiment import SentimentIntensityAnalyzer
analyser = SentimentIntensityAnalyzer()
wordcloud = WordCloud(max_font_size=50, max_words=100, background_color="white").generate(' '.join(r.sample(10).reviews))
plt.imshow(wordcloud, interpolation='bilinear')
plt.axis("off")
plt.show()
利用 Vader Sentiment 实现评论情感分析
def sentiment_analyzer_scores(sentence):
    score = analyser.polarity_scores(sentence)
    return score
neg=[]
neu=[]
pos=[]
comp=[]
for review in r.reviews:
    scores=sentiment_analyzer_scores(str(review))
    neg.append(scores['neg'])
    pos.append(scores['pos'])
    neu.append(scores['neu'])
    comp.append(scores['compound'])
r['s_pos']=pos
r['s_neu']=neu
r['s_neg']=neg
r['s_comp']=comp

r.head()
| reviews | reviewers | date_reviews | rating | course_id | s_pos | s_neu | s_neg | s_comp | |
|---|---|---|---|---|---|---|---|---|---|
| 0 | Pretty dry, but I was able to pass with just t… | By Robert S | Feb 12, 2020 | 4 | google-cbrs-cpi-training | 0.198 | 0.707 | 0.094 | 0.8504 |
| 1 | would be a better experience if the video and … | By Gabriel E R | Sep 28, 2020 | 4 | google-cbrs-cpi-training | 0.056 | 0.944 | 0.000 | 0.4404 |
| 2 | Information was perfect! The program itself wa… | By Jacob D | Apr 08, 2020 | 4 | google-cbrs-cpi-training | 0.161 | 0.746 | 0.093 | 0.6572 |
| 3 | A few grammatical mistakes on test made me do … | By Dale B | Feb 24, 2020 | 4 | google-cbrs-cpi-training | 0.175 | 0.743 | 0.081 | 0.4633 |
| 4 | Excellent course and the training provided was… | By Sean G | Jun 18, 2020 | 4 | google-cbrs-cpi-training | 0.384 | 0.616 | 0.000 | 0.7823 |
for i in range(6,11):
    print ("----------------------------------------")
    print("Review : ",r['reviews'][i])
    print("Positivity:",r['s_pos'][i])
    print("Negativity:",r['s_neg'][i])
    print ("----------------------------------------")
----------------------------------------
Review :  Solid presentation all the way through. I really appreciated the intermittent questions that popped up to check on learning as well the regular (but not needless) quizzing. There was visuals such as charts / .ppt for those of us more visually inclined as well as a transcript below the video that followed along with the presentation!
Positivity: 0.135
Negativity: 0.0
----------------------------------------
----------------------------------------
Review :  Probably the best certification course I've taken in this respect. The course is planned out carefully, and I believe gave me everything I needed to ace my exam the first time around. The trainer for the majority of the course was awesome. She delivered the material in a great, professional mannor, but was never boring or monotoned.
Positivity: 0.212
Negativity: 0.0
----------------------------------------
----------------------------------------
Review :  The ProctorU.com system took 2 times the amount of time spent on this course over 3 days to complete.  It is the worse production user system I have used in 20+ years of my IT career.    You should switch to another vendor.
Positivity: 0.0
Negativity: 0.07
----------------------------------------
----------------------------------------
Review :  Covered all of the required information in an easy to understand way and WITH VIDEO! Great, easy way to learn. The exam process was a bit drawn out and more extensive then it needed to be, but over all a great experience
Positivity: 0.246
Negativity: 0.0
----------------------------------------
----------------------------------------
Review :  Great course, lectures were straight forward and easy to follow along.  The course provided all the information necessary to pass the CPI examination for certification.
Positivity: 0.288
Negativity: 0.0
----------------------------------------
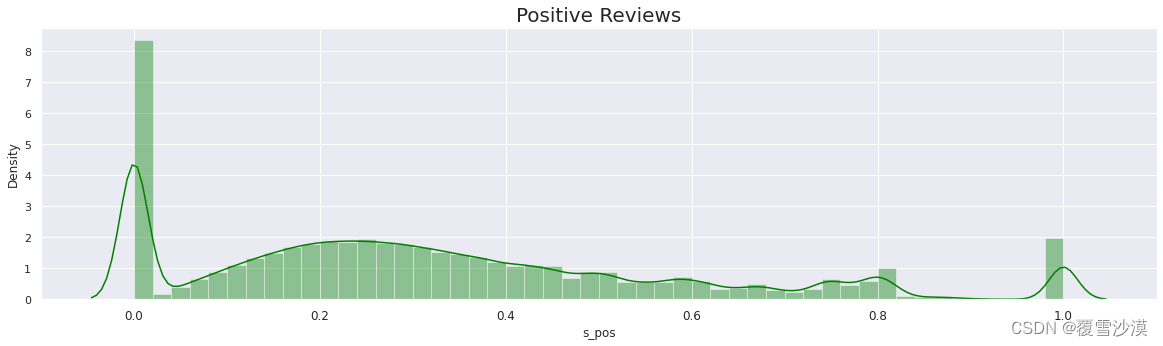
情感分布
sns.set(rc={'figure.figsize':(20,5)})
plt.xticks(fontsize=12)
p=sns.distplot(r['s_pos'],color='green')
p.axes.set_title("Positive Reviews",fontsize=20)
sns.set(rc={'figure.figsize':(20,5)})
plt.xticks(fontsize=12)
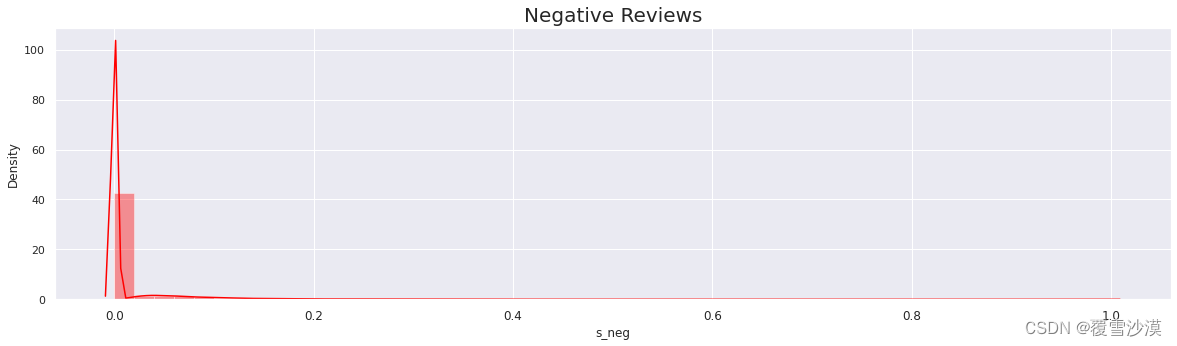
p=sns.distplot(r['s_neg'],color='red')
p.axes.set_title("Negative Reviews",fontsize=20)
sns.set(rc={'figure.figsize':(20,5)})
plt.xticks(fontsize=12)
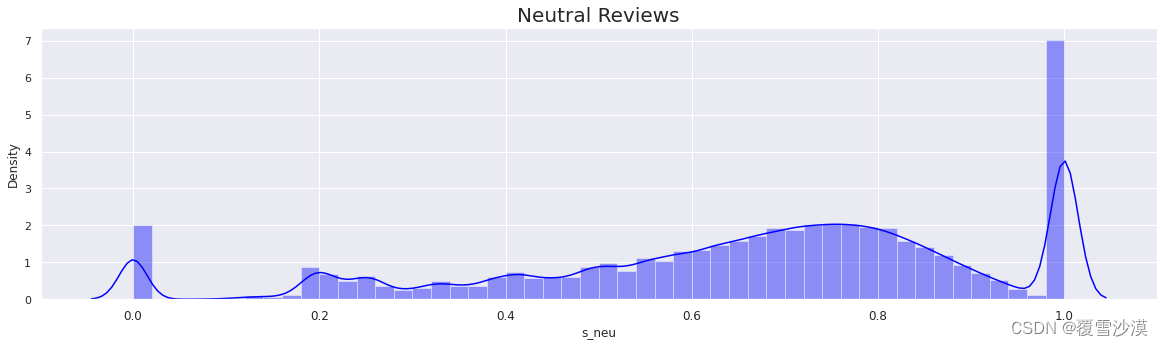
p=sns.distplot(r['s_neu'],color='blue')
p.axes.set_title("Neutral Reviews",fontsize=20)


 4466
4466

 被折叠的 条评论
为什么被折叠?
被折叠的 条评论
为什么被折叠?
 到【灌水乐园】发言


