初始化
import pandas as pd
import numpy as np
import matplotlib.pyplot as plt
import folium
INPUT_PATH = 'G:\DCIC\Data\\'
MAX_ROWS = 100000
地图数据统计:
taxigps2019 = pd.read_csv(INPUT_PATH + 'taxiGps20190531.csv',
                         dtype = {
                             'DRIVING_DIRECTION': np.uint16,
                             'OPERATING_STATUS': np.uint8,
                             'LONGITUDE': np.float32,
                             'LATITUDE': np.float32,
                             'GPS_SPEED': np.float32
                         })

taxigps2019 = taxigps2019[taxigps2019.columns[::-1]]
taxigps2019['GPS_TIME'] = pd.to_datetime(taxigps2019['GPS_TIME'])
taxigps2019.sort_values(by=['CARNO','GPS_TIME'], inplace=True)
taxigps2019.reset_index(inplace=True, drop=True)
taxigps2019.head()
| CARNO | LATITUDE | LONGITUDE | GPS_TIME | DRIVING_DIRECTION | GPS_SPEED | OPERATING_STATUS |
|---|
| 0 | 0006d282be70d06881a7513b69fcaa60 | 24.479755 | 118.146935 | 2019-05-31 01:31:20 | 292 | 0.0 | 1 |
|---|
| 1 | 0006d282be70d06881a7513b69fcaa60 | 24.479755 | 118.146935 | 2019-05-31 01:31:35 | 292 | 0.0 | 1 |
|---|
| 2 | 0006d282be70d06881a7513b69fcaa60 | 24.479755 | 118.146935 | 2019-05-31 01:31:50 | 292 | 0.0 | 1 |
|---|
| 3 | 0006d282be70d06881a7513b69fcaa60 | 24.479755 | 118.146935 | 2019-05-31 01:32:05 | 292 | 0.0 | 1 |
|---|
| 4 | 0006d282be70d06881a7513b69fcaa60 | 24.479755 | 118.146935 | 2019-05-31 01:32:20 | 292 | 0.0 | 1 |
|---|
统计每辆巡游车最早、最晚出现的记录:
df_first = taxigps2019.groupby(['CARNO']).first()
print('最早出现的记录:')
df_first.head()
最早出现的记录:
| LATITUDE | LONGITUDE | GPS_TIME | DRIVING_DIRECTION | GPS_SPEED | OPERATING_STATUS |
|---|
| CARNO | | | | | | |
|---|
| 0006d282be70d06881a7513b69fcaa60 | 24.479755 | 118.146935 | 2019-05-31 01:31:20 | 292 | 0.000000 | 1 |
|---|
| 000e8886a7b27ca761e34d59b1dee35c | 24.550379 | 118.103012 | 2019-05-31 01:31:38 | 148 | 72.199997 | 6 |
|---|
| 001df76bfa67259259f596c6dd353e6a | 24.499088 | 118.141182 | 2019-05-31 01:31:09 | 278 | 37.000000 | 6 |
|---|
| 001e3756542dc796b402dfd1b56fd4ec | 24.471125 | 118.105560 | 2019-05-31 01:31:14 | 346 | 35.099998 | 6 |
|---|
| 002b23a3762ea245f18cc896a55579d2 | 24.544592 | 118.102463 | 2019-05-31 01:31:21 | 199 | 0.300000 | 1 |
|---|
df_last = taxigps2019.groupby(['CARNO']).last()
print('最晚出现的记录:')
df_last.head()
最晚出现的记录:
| LATITUDE | LONGITUDE | GPS_TIME | DRIVING_DIRECTION | GPS_SPEED | OPERATING_STATUS |
|---|
| CARNO | | | | | | |
|---|
| 0006d282be70d06881a7513b69fcaa60 | 24.498701 | 118.030182 | 2019-05-31 23:59:58 | 54 | 44.400002 | 1 |
|---|
| 000e8886a7b27ca761e34d59b1dee35c | 24.538876 | 118.129890 | 2019-05-31 23:59:49 | 232 | 0.000000 | 1 |
|---|
| 001df76bfa67259259f596c6dd353e6a | 24.488588 | 118.157196 | 2019-05-31 23:59:47 | 252 | 30.100000 | 6 |
|---|
| 001e3756542dc796b402dfd1b56fd4ec | 24.524464 | 118.147095 | 2019-05-31 23:59:49 | 80 | 12.900000 | 6 |
|---|
| 002b23a3762ea245f18cc896a55579d2 | 24.497768 | 118.180374 | 2019-05-31 23:59:45 | 0 | 0.000000 | 1 |
|---|
统计每辆巡游车最早最晚的时间间隔:
df_first = taxigps2019.groupby(['CARNO']).first()
df_last = taxigps2019.groupby(['CARNO']).last()
df = df_last['GPS_TIME'] - df_first['GPS_TIME']
df = df.reset_index()
df['GPS_HOUR'] = df['GPS_TIME'].dt.seconds / 3600
df['GPS_HOUR'] = df['GPS_HOUR'].astype(int)
df.set_index('CARNO', inplace=True)
df.head()
| GPS_TIME | GPS_HOUR |
|---|
| CARNO | | |
|---|
| 0006d282be70d06881a7513b69fcaa60 | 0 days 22:28:38 | 22 |
|---|
| 000e8886a7b27ca761e34d59b1dee35c | 0 days 22:28:11 | 22 |
|---|
| 001df76bfa67259259f596c6dd353e6a | 0 days 22:28:38 | 22 |
|---|
| 001e3756542dc796b402dfd1b56fd4ec | 0 days 22:28:35 | 22 |
|---|
| 002b23a3762ea245f18cc896a55579d2 | 0 days 22:28:24 | 22 |
|---|
统计每辆巡游车的经纬度和速度极差:
taxigps2019 = taxigps2019[taxigps2019['LATITUDE'] != 0]
taxigps2019 = taxigps2019[taxigps2019['LONGITUDE'] != 0]

df['LATITUDE_PTP'] = taxigps2019.groupby(['CARNO'])['LATITUDE'].apply(np.ptp)
df['LONGITUDE_PTP'] = taxigps2019.groupby(['CARNO'])['LONGITUDE'].apply(np.ptp)
df['GPS_SPEED_PTP'] = taxigps2019.groupby(['CARNO'])['GPS_SPEED'].apply(np.ptp)

df.head()
| GPS_TIME | GPS_HOUR | LATITUDE_PTP | LONGITUDE_PTP | GPS_SPEED_PTP |
|---|
| CARNO | | | | | |
|---|
| 0006d282be70d06881a7513b69fcaa60 | 0 days 22:28:38 | 22 | 0.082424 | 0.167244 | 79.599998 |
|---|
| 000e8886a7b27ca761e34d59b1dee35c | 0 days 22:28:11 | 22 | 0.218086 | 0.228439 | 90.699997 |
|---|
| 001df76bfa67259259f596c6dd353e6a | 0 days 22:28:38 | 22 | 0.089241 | 0.111763 | 74.099998 |
|---|
| 001e3756542dc796b402dfd1b56fd4ec | 0 days 22:28:35 | 22 | 0.208961 | 0.176155 | 98.099998 |
|---|
| 002b23a3762ea245f18cc896a55579d2 | 0 days 22:28:24 | 22 | 0.113722 | 0.113892 | 78.099998 |
|---|
df[(df['LATITUDE_PTP'] == 0)&(df['LONGITUDE_PTP'] == 0)&(df['GPS_SPEED_PTP'] == 0)].count()
GPS_TIME         39
GPS_HOUR         39
LATITUDE_PTP     39
LONGITUDE_PTP    39
GPS_SPEED_PTP    39
dtype: int64
通过统计经纬度以及GPS速度的极差是否为0,可以剔除全天GPS异常的车辆。
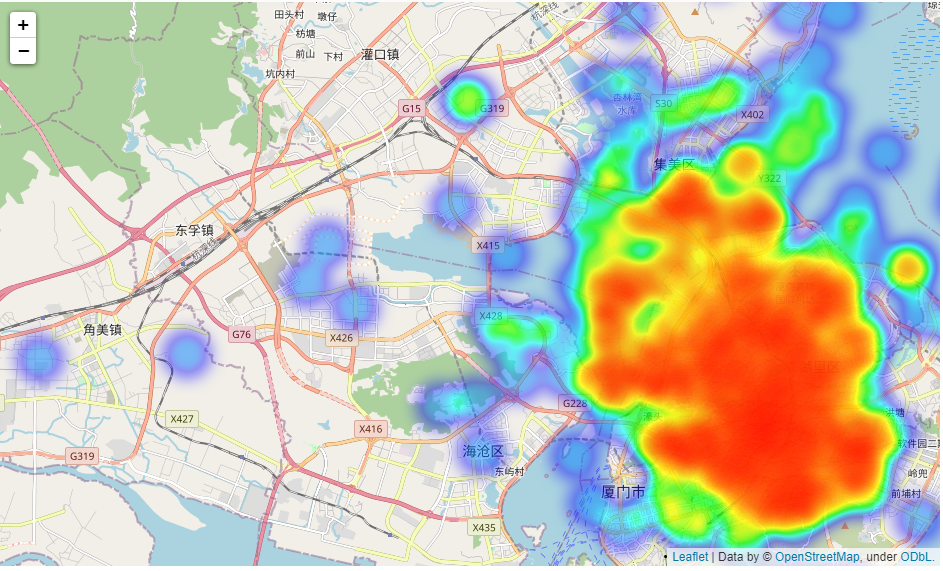
计算每辆巡游车的平均经纬度,并绘制热力图:
df['LONGITUDE_MEAN'] = taxigps2019.groupby(['CARNO'])['LONGITUDE'].mean()
df['LATITUDE_MEAN'] = taxigps2019.groupby(['CARNO'])['LATITUDE'].mean()
df = df.dropna()
from folium import plugins
from folium.plugins import HeatMap

map_hooray = folium.Map(location=[24.482426, 118.157606], zoom_start=14)
HeatMap(df[['LATITUDE_MEAN', 'LONGITUDE_MEAN']].iloc[:1000].values).add_to(map_hooray)
map_hooray
对比分析2019,2020年端午节前一天巡游车平均速度的变化:
taxigps2019 = pd.read_csv(INPUT_PATH + 'taxiGps20190606.csv',
dtype = {
'DRIVING_DIRECTION': np.uint16,
'OPERATING_STATUS': np.uint8,
'LONGITUDE': np.float16,
'LATITUDE': np.float16,
'GPS_SPEED': np.float32
})
dwq2019 = taxigps2019['GPS_SPEED'].mean()
del taxigps2019
taxigps2020 = pd.read_csv(INPUT_PATH + 'taxiGps20200624.csv',
dtype = {
'DRIVING_DIRECTION': np.uint16,
'OPERATING_STATUS': np.uint8,
'LONGITUDE': np.float16,
'LATITUDE': np.float16,
'GPS_SPEED': np.float32
})
dwq2020 = taxigps2020['GPS_SPEED'].mean()
del taxigps2020
print(dw2019)
print(dw2020)
243.19984
218.5537
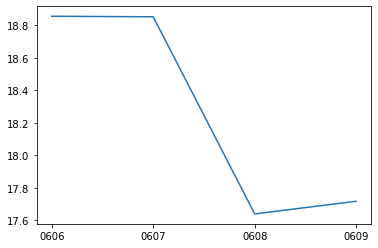
对比分析2019年端午假期前、端午假期中和假期后,巡游车日平均速度变化:
l_name = ['0606','0607','0608','0609']
speed2019 = []
for i in l_name:
    taxigps2019 = pd.read_csv(INPUT_PATH + 'taxiGps2019'+i+'.csv',
                         dtype = {
                             'DRIVING_DIRECTION': np.uint16,
                             'OPERATING_STATUS': np.uint8,
                             'LONGITUDE': np.float16,
                             'LATITUDE': np.float16,
                             'GPS_SPEED': np.float32
                         })
    speed2019.append(taxigps2019['GPS_SPEED'].mean())
plt.plot(l_name,speed2019)
订单数据统计
del taxigps2019
taxiorder2019 = pd.read_csv(INPUT_PATH + 'taxiOrder20190531.csv',
dtype = {
'GETON_LONGITUDE': np.float32,
'GETON_LATITUDE': np.float32,
'GETOFF_LONGITUDE': np.float32,
'GETOFF_LATITUDE': np.float32,
'PASS_MILE': np.float16,
'NOPASS_MILE': np.float16,
'WAITING_TIME': np.float32
})
taxiorder2019 = taxiorder2019.rename(columns={'CAR_NO':'CARNO'})
taxiorder2019.sort_values(by=['CARNO','GETON_DATE'], inplace=True)
taxiorder2019.reset_index(inplace=True, drop=True)
taxiorder2019.head()
| CARNO | GETON_DATE | GETON_LONGITUDE | GETON_LATITUDE | GETOFF_DATE | GETOFF_LONGITUDE | GETOFF_LATITUDE | PASS_MILE | NOPASS_MILE | WAITING_TIME |
|---|
| 0 | 0006d282be70d06881a7513b69fcaa60 | 2019-05-31 00:08:00 | 118.155060 | 24.506035 | 2019-05-31 00:13:00 | 118.176666 | 24.509895 | 3.099609 | 1.299805 | 62.0 |
|---|
| 1 | 0006d282be70d06881a7513b69fcaa60 | 2019-05-31 00:27:00 | 118.154709 | 24.488773 | 2019-05-31 00:32:00 | 118.163002 | 24.504761 | 2.900391 | 4.101562 | 34.0 |
|---|
| 2 | 0006d282be70d06881a7513b69fcaa60 | 2019-05-31 00:44:00 | 118.155083 | 24.506090 | 2019-05-31 00:55:00 | 118.156609 | 24.450809 | 7.601562 | 2.900391 | 71.0 |
|---|
| 3 | 0006d282be70d06881a7513b69fcaa60 | 2019-05-31 01:57:00 | 118.117744 | 24.479275 | 2019-05-31 02:01:00 | 118.124352 | 24.472086 | 1.799805 | 8.703125 | 17.0 |
|---|
| 4 | 0006d282be70d06881a7513b69fcaa60 | 2019-05-31 02:14:00 | 118.117691 | 24.482437 | 2019-05-31 02:29:00 | 118.154976 | 24.488611 | 4.699219 | 5.101562 | 425.0 |
|---|
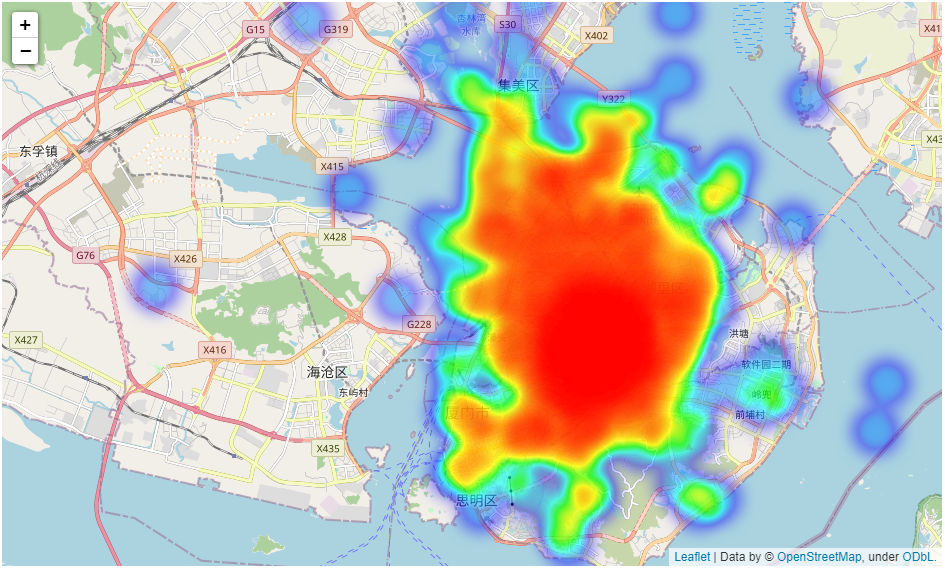
上下客点分布密度:
df = taxiorder2019.groupby(['CARNO'])['GETON_LONGITUDE'].mean()
df = df.reset_index()
df.set_index('CARNO', inplace=True)
df['GETON_LATITUDE'] = taxiorder2019.groupby(['CARNO'])['GETON_LATITUDE'].mean()
df.head()
| GETON_LONGITUDE | GETON_LATITUDE |
|---|
| CARNO | | |
|---|
| 0006d282be70d06881a7513b69fcaa60 | 118.116310 | 24.496180 |
|---|
| 000e8886a7b27ca761e34d59b1dee35c | 118.068756 | 24.568338 |
|---|
| 001df76bfa67259259f596c6dd353e6a | 102.009560 | 21.137037 |
|---|
| 001e3756542dc796b402dfd1b56fd4ec | 118.125366 | 24.499846 |
|---|
| 002b23a3762ea245f18cc896a55579d2 | 100.296051 | 20.792345 |
|---|
map_hooray = folium.Map(location=[24.482426, 118.157606], zoom_start=14)
HeatMap(df[['GETON_LATITUDE', 'GETON_LONGITUDE']].values).add_to(map_hooray)
map_hooray

df['GETOFF_LONGITUDE'] = taxiorder2019.groupby(['CARNO'])['GETOFF_LONGITUDE'].mean()
df['GETOFF_LATITUDE'] = taxiorder2019.groupby(['CARNO'])['GETOFF_LATITUDE'].mean()
df.head()
| GETON_LONGITUDE | GETON_LATITUDE | GETOFF_LONGITUDE | GETOFF_LATITUDE |
|---|
| CARNO | | | | |
|---|
| 0006d282be70d06881a7513b69fcaa60 | 118.116310 | 24.496180 | 118.118141 | 24.496452 |
|---|
| 000e8886a7b27ca761e34d59b1dee35c | 118.068756 | 24.568338 | 113.538834 | 23.626139 |
|---|
| 001df76bfa67259259f596c6dd353e6a | 102.009560 | 21.137037 | 118.118271 | 24.478399 |
|---|
| 001e3756542dc796b402dfd1b56fd4ec | 118.125366 | 24.499846 | 118.121391 | 24.505577 |
|---|
| 002b23a3762ea245f18cc896a55579d2 | 100.296051 | 20.792345 | 100.293442 | 20.792120 |
|---|
map_hooray = folium.Map(location=[24.482426, 118.157606], zoom_start=14)
HeatMap(df[['GETOFF_LATITUDE', 'GETOFF_LONGITUDE']].values).add_to(map_hooray)
map_hooray
巡游车在(118.155060±0.01)、(24.506035±0.01)方位内打车的平均等待时间:
taxiorder2019[(118.155060-0.01<taxiorder2019['GETON_LONGITUDE'])&(taxiorder2019['GETON_LONGITUDE']<118.155060+0.01)&
              (24.506035-0.01<taxiorder2019['GETON_LATITUDE'])&(taxiorder2019['GETON_LATITUDE']<24.506035+0.01)]['WAITING_TIME'].mean()
276.4932
统计出租订单平均等待时间超过600秒的经纬度:
f = lambda x:str(round(x,3))
taxiorder2019['GETON_POSITION'] = taxiorder2019['GETON_LONGITUDE'].apply(f)+','+taxiorder2019['GETON_LATITUDE'].apply(f)
df = taxiorder2019.groupby(['GETON_POSITION'])['WAITING_TIME'].mean()
df = df.reset_index()
df.set_index('GETON_POSITION', inplace=True)
df = df[ taxiorder2019.groupby(['GETON_POSITION'])['WAITING_TIME'].mean() > 600]
df = df.reset_index()
df['GETON_POSITION'].value_counts()
118.147,24.456    1
118.158,24.492    1
117.997,24.615    1
118.158,24.488    1
118.122,24.621    1
                 ..
118.091,24.523    1
118.149,24.489    1
118.186,24.505    1
118.074,24.612    1
118.156,24.452    1
Name: GETON_POSITION, Length: 631, dtype: int64
统计20190531 - 20190609 期间出租订单经纬度上平均等待时间长的位置(且位置出现频率大于5):
l_name = ['0531','0601','0602','0603','0604','0605','0606','0607','0608','0609']
from collections import Counter
counter = Counter()
for i in l_name:
taxiorder2019 = pd.read_csv(INPUT_PATH + 'taxiOrder2019'+i+'.csv',
dtype = {
'GETON_LONGITUDE': np.float32,
'GETON_LATITUDE': np.float32,
'GETOFF_LONGITUDE': np.float32,
'GETOFF_LATITUDE': np.float32,
'PASS_MILE': np.float16,
'NOPASS_MILE': np.float16,
'WAITING_TIME': np.float32
})
taxiorder2019 = taxiorder2019.rename(columns={'CAR_NO':'CARNO'})
taxiorder2019.sort_values(by=['CARNO','GETON_DATE'], inplace=True)
taxiorder2019.reset_index(inplace=True, drop=True)
taxiorder2019['GETON_POSITION'] = taxiorder2019['GETON_LONGITUDE'].apply(f)+','+taxiorder2019['GETON_LATITUDE'].apply(f)
df = taxiorder2019.groupby(['GETON_POSITION'])['WAITING_TIME'].mean()
df = df.reset_index()
df.set_index('GETON_POSITION', inplace=True)
df = df[ taxiorder2019.groupby(['GETON_POSITION'])['WAITING_TIME'].mean() > 600]
df = df.reset_index()
counter.update(df['GETON_POSITION'].values)
sorted(counter.items(),key=lambda x:x[1], reverse = True)
[('0.0,0.0', 10),
 ('117.939,24.492', 8),
 ('118.13,24.486', 7),
 ('118.023,24.48', 6),
 ('118.109,24.431', 6),
 ('118.226,24.569', 6),
 ('118.019,24.482', 5),
 ('118.052,24.5', 5),
 ('118.166,24.481', 5),
 ('118.167,24.48', 5),
 ('118.228,24.568', 5),
 ('118.11,24.489', 5),
 ('118.036,24.491', 5),
 ('118.068,24.464', 5),
 ...]
对比2019年和2020年出租车端午节订单的平均等待时间,是如何变化的:
taxiorder2019 = pd.read_csv(INPUT_PATH + 'taxiOrder2019'+'0607'+'.csv',
dtype = {
'GETON_LONGITUDE': np.float32,
'GETON_LATITUDE': np.float32,
'GETOFF_LONGITUDE': np.float32,
'GETOFF_LATITUDE': np.float32,
'PASS_MILE': np.float16,
'NOPASS_MILE': np.float16,
'WAITING_TIME': np.float32
})
taxiorder2019 = taxiorder2019.rename(columns={'CAR_NO':'CARNO'})
taxiorder2020 = pd.read_csv(INPUT_PATH + 'taxiOrder2020'+'0625'+'.csv',
dtype = {
'GETON_LONGITUDE': np.float32,
'GETON_LATITUDE': np.float32,
'GETOFF_LONGITUDE': np.float32,
'GETOFF_LATITUDE': np.float32,
'PASS_MILE': np.float16,
'NOPASS_MILE': np.float16,
'WAITING_TIME': np.float32
})
taxiorder2020 = taxiorder2020.rename(columns={'CAR_NO':'CARNO'})
dw2019 = taxiorder2019['WAITING_TIME'].mean()
dw2020 = taxiorder2020['WAITING_TIME'].mean()
print(dw2019)
print(dw2020)
243.19984
218.5537
巡游车订单距离与时间的对比:
import matplotlib.animation as animation
import glob, gc
def barlist(n):
taxiorder2019 = pd.read_csv(paths[n], nrows=None,
dtype = {
'GETON_LONGITUDE': np.float32,
'GETON_LATITUDE': np.float32,
'GETOFF_LONGITUDE': np.float32,
'GETOFF_LATITUDE': np.float32,
'PASS_MILE': np.float16,
'NOPASS_MILE': np.float16,
'WAITING_TIME': np.float16
})
taxiorder2019['GETON_DATE'] = pd.to_datetime(taxiorder2019['GETON_DATE'])
taxiorder2019['GETON_Hour'] = taxiorder2019['GETON_DATE'].dt.hour
return taxiorder2019.groupby(['GETON_Hour'])['PASS_MILE'].mean().values
fig=plt.figure()
paths = glob.glob(INPUT_PATH +'taxiOrder20190*.csv')
paths.sort()
n = len(paths)
x = range(24)
barcollection = plt.bar(x,barlist(0))
plt.ylim(0,8)
def animate(i):
y=barlist(i+1)
for idx, b in enumerate(barcollection):
b.set_height(y[idx])
plt.ylim(0,8)
plt.title(paths[i+1].split('/')[-1])
plt.ylabel('PASS_MILE / KM')
plt.xlabel('Hour')
anim=animation.FuncAnimation(fig,animate,repeat=False,blit=False,frames=n-1,
interval=500)
anim.save('order.gif', dpi=150)
巡游车空驶率对比:
for path in paths:
    taxiorder2019 = pd.read_csv(path, nrows=None,
                               dtype = {
                                   'GETON_LONGITUDE': np.float32,
                                   'GETON_LATITUDE': np.float32,
                                   'GETOFF_LONGITUDE': np.float32,
                                   'GETOFF_LATITUDE': np.float32,
                                   'PASS_MILE': np.float16,
                                   'NOPASS_MILE': np.float16,
                                   'WAITING_TIME': np.float16
                               })

    taxiorder2019 = taxiorder2019[['NOPASS_MILE', 'PASS_MILE']].dropna()
    taxiorder2019['NOPASS_Ratio'] = taxiorder2019['NOPASS_MILE'] / (taxiorder2019['NOPASS_MILE'] + taxiorder2019['PASS_MILE'])
    print(path, taxiorder2019['NOPASS_Ratio'].astype(np.float32).mean())
G:\DCIC\Data\taxiOrder20190531.csv 0.27126783
G:\DCIC\Data\taxiOrder20190601.csv 0.27297953
G:\DCIC\Data\taxiOrder20190602.csv 0.30302802
G:\DCIC\Data\taxiOrder20190603.csv 0.31049386
G:\DCIC\Data\taxiOrder20190604.csv 0.3039471
G:\DCIC\Data\taxiOrder20190605.csv 0.2933384
G:\DCIC\Data\taxiOrder20190606.csv 0.2547359
G:\DCIC\Data\taxiOrder20190607.csv 0.28453994
G:\DCIC\Data\taxiOrder20190608.csv 0.304996
G:\DCIC\Data\taxiOrder20190609.csv 0.3115026


 498
498


 被折叠的 条评论
为什么被折叠?
被折叠的 条评论
为什么被折叠?
 到【灌水乐园】发言


