


 本文主要讨论了在RISC-V架构下,如何通过gdb进行系统调用跟踪,涉及trapframe、syscall调用、进程上下文、kernelpanic原因分析以及sys_trace函数的作用。文章详细解释了用户模式到内核模式的切换、陷阱帧中的变量含义,以及系统调用表的结构和操作过程。
Using gdb
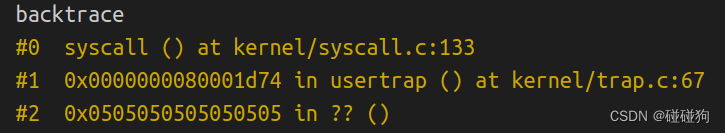
Looking at the backtrace output, which function called syscall?
可以看到是trap.c中usertrap函数调用了syscall函数
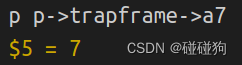
What is the value of p->trapframe->a7 and what does that value represent?
p->trapframe->a7的值为7,代表了函数sys_exec在数组syscalls中的索引值
What was the previous mode that the CPU was in?
sstatus值为0x22,翻译成二进制是100010,第8位SPP为0
说明进入supervisor mode之前是user mode
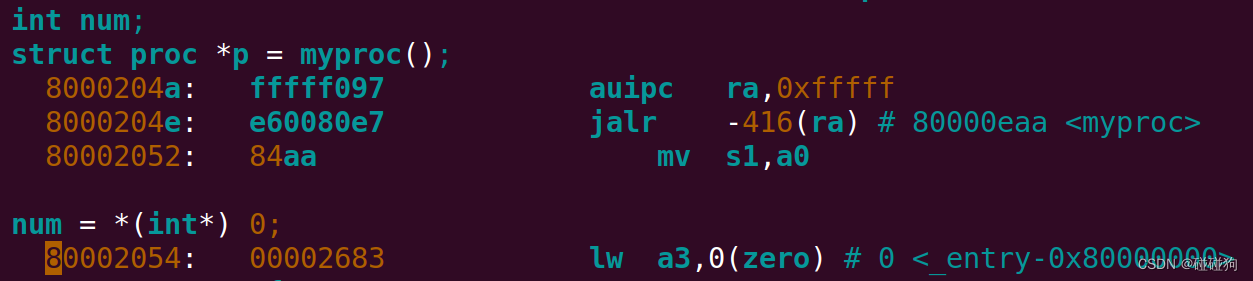
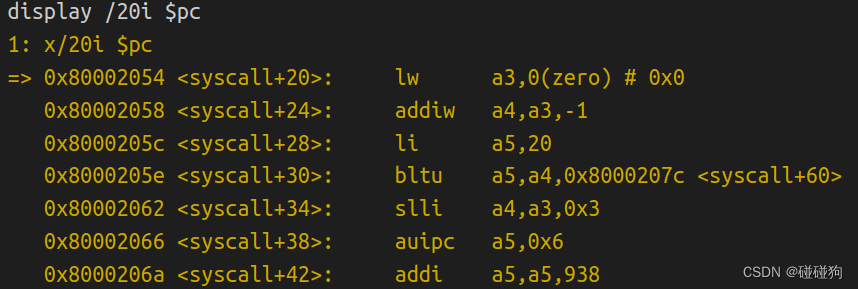
Write down the assembly instruction the kernel is panicing at. Which register corresponds to the variable num?
可以看到num对应于a3寄存器
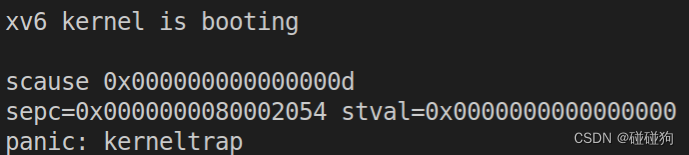
 Why does the kernel crash? Hint: look at figure 3-3 in the text; is address 0 mapped in the kernel address space? Is that confirmed by the value in scause above?
scause的值为0x0d,也就是十进制13,表示Load page fault
在RISC-V中有效地址从0x80000000开始,地址0x0是无效的
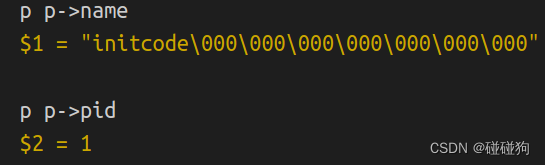
 What is the name of the binary that was running when the kernel paniced? What is its process id (pid)?
System call tracing
proc.h
//proc.h
struct proc
{
	......

	uint32 tracemask;			 //mask for syscall trace
};
proc.c
static struct proc * allocproc(void)
{
	......

found:
	p->pid = allocpid();
	p->state = USED;
	p->tracemask = 0U;

    ......
}

int fork(void)
{
	......

	// Copy user memory from parent to child.
	if (uvmcopy(p->pagetable, np->pagetable, p->sz) < 0)
	{
		freeproc(np);
		release(&np->lock);
		return -1;
	}
	np->sz = p->sz;
	np->tracemask = p->tracemask;

    ......


}
syscall.h
......

#define SYS_trace  22
syscall.c
static uint64 (*syscalls[])(void) = {

	......

	[SYS_trace] sys_trace
};

static char *sysnames[] = {
	[SYS_fork] "fork",
	[SYS_exit] "exit",
	[SYS_wait] "wait",
	[SYS_pipe] "pipe",
	[SYS_read] "read",
	[SYS_kill] "kill",
	[SYS_exec] "exec",
	[SYS_fstat] "fstat",
	[SYS_chdir] "chdir",
	[SYS_dup] "dup",
	[SYS_getpid] "getpid",
	[SYS_sbrk] "sbrk",
	[SYS_sleep] "sleep",
	[SYS_uptime] "uptime",
	[SYS_open] "open",
	[SYS_write] "write",
	[SYS_mknod] "mknod",
	[SYS_unlink] "unlink",
	[SYS_link] "link",
	[SYS_mkdir] "mkdir",
	[SYS_close] "close",
	[SYS_trace] "trace"
};

void syscall(void)
{
	int num;
	struct proc *p = myproc();

	num = p->trapframe->a7;
	if (num > 0 && num < NELEM(syscalls) && syscalls[num])
	{
		p->trapframe->a0 = syscalls[num]();

		if ((p->tracemask >> num) & 1U)
		{
			printf("%d: syscall %s -> %d\n", p->pid, sysnames[num], p->trapframe->a0);
		}
	}
	else
	{
		printf("%d %s: unknown sys call %d\n",
			   p->pid, p->name, num);
		p->trapframe->a0 = -1;
	}
}
sysproc.c
uint64 sys_trace(void)
{
	int n;
	struct proc *p;

	argint(0, &n);
	p = myproc();
	p->tracemask = (uint32)n;

	return 0;
}
user.h
// system calls

......

int trace(int);
usys.pl
......

entry("trace");
Makefile
UPROGS=\
	$U/_cat\
	$U/_echo\
	$U/_forktest\
	$U/_grep\
	$U/_init\
	$U/_kill\
	$U/_ln\
	$U/_ls\
	$U/_mkdir\
	$U/_rm\
	$U/_sh\
	$U/_stressfs\
	$U/_usertests\
	$U/_grind\
	$U/_wc\
	$U/_zombie\
	$U/_trace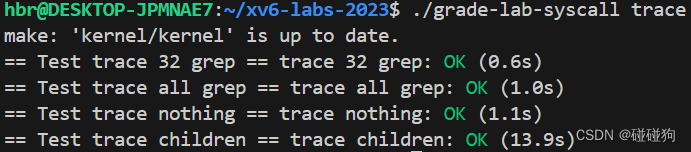
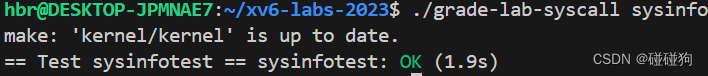
Sysinfo
其他文件的修改同System call tracing
kalloc.c
int cntfreemem(void)
{
	int cnt = 0;

	for (struct run * p = kmem.freelist; p != 0; p = p->next)
	{
		cnt += PGSIZE;
	}

	return cnt;
}
proc.c
int cntproc(void)
{
	int cnt = 0;

	for (int i = 0; i < NPROC; i++)
	{
		if (proc[i].state != UNUSED)
		{
			cnt++;
		}
	}

	return cnt;
}
sysproc.c
uint64 sys_sysinfo(void)
{
	uint64 addr;
	struct proc *p;
	struct sysinfo info;

	argaddr(0, &addr);

	p = myproc();

	info.freemem = cntfreemem();
	info.nproc = cntproc();

	if (copyout(p->pagetable, addr, (char*)&info, sizeof(info)) < 0)
	{
		return -1;
	}

	return 0;
}


 410
410

 被折叠的 条评论
为什么被折叠?
被折叠的 条评论
为什么被折叠?
 到【灌水乐园】发言


