


0.准备工作
参考文章
参考文章1、2配置好python和mapnik的环境
- 设定好系统的PATH、PYTHONPATH
- 在C:\mapnik-v2.2.0\demo\新建一个map文件夹,并参考文章3下载一个shp地图包到这个文件夹
1.VS工程及配置
- 新建win32控制台工程
- 切换到release模式(因为没有debug的mapnik.dll)
- .cpp下写入下面的代码
#include "stdafx.h"
#include <iostream>
#include "python.h"

using namespace std;

int _tmain(int argc, char* argv[])
{

    Py_SetProgramName(argv[0]);  /* optional but recommended */

    Py_Initialize();

    PyRun_SimpleString("execfile('C:\\mapnik-v2.2.0\\demo\\python\\pytest.py')");      //使用execfile来运行python文件

    Py_Finalize();

    system("pause");


    return 0;
}
这里有几个注意:
- Py_SetProgramName(argv[0]);这句是python官方给的pdf上列出的,推荐使用
- PyRun_SimpleString这句原本可以用PyRun_SimpleFile,但发现用这个函数会产生崩溃,具体原因有说法是文件编码方式和c不兼容,这里用execfile来迂回实现
2.python代码
- C:\mapnik-v2.2.0\demo\python\文件夹下新建一个pytest.py文件
- 写入下面代码
import mapnik
m = mapnik.Map(800,600)# create a map with a given width and height in pixels
# note: m.srs will default to '+proj=longlat +ellps=WGS84 +datum=WGS84 +no_defs'
# the 'map.srs' is the target projection of the map and can be whatever you wish
m.background = mapnik.Color('steelblue') # set background colour to 'steelblue'.
s = mapnik.Style() # style object to hold rules
r = mapnik.Rule() # rule object to hold symbolizers
# to fill a polygon we create a PolygonSymbolizer
polygon_symbolizer = mapnik.PolygonSymbolizer(mapnik.Color('#f2eff9'))
r.symbols.append(polygon_symbolizer) # add the symbolizer to the rule object
# to add outlines to a polygon we create a LineSymbolizer
line_symbolizer = mapnik.LineSymbolizer(mapnik.Color('rgb(50%,50%,50%)'),0.1)
r.symbols.append(line_symbolizer) # add the symbolizer to the rule object
s.rules.append(r) # now add the rule to the style and we're done
m.append_style('My Style',s) # Styles are given names only as they are applied to the map
ds = mapnik.Shapefile(file='C:\mapnik-v2.2.0\demo\map\map.shp')
layer = mapnik.Layer('world') # new layer called 'world' (we could name it anything)
# note: layer.srs will default to '+proj=longlat +ellps=WGS84 +datum=WGS84 +no_defs'
layer.datasource = ds
layer.styles.append('My Style')
m.layers.append(layer)
m.zoom_all()
# Write the data to a png image called world.png the current directory
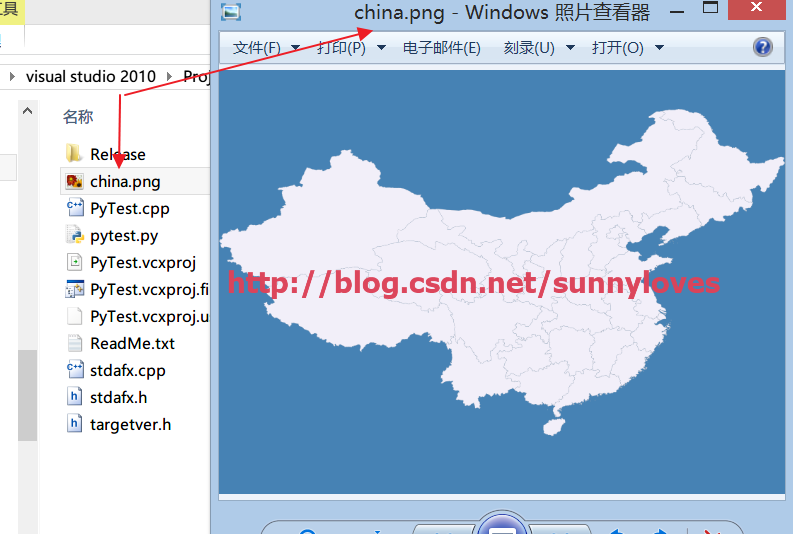
mapnik.render_to_file(m,'china.png', 'png')3.结果
编译连接运行后,在vs工程目录下得到结果PNG图片


 1999
1999

 被折叠的 条评论
为什么被折叠?
被折叠的 条评论
为什么被折叠?
 到【灌水乐园】发言


