


 本文探讨了浙江省技术高考中数据可视化的重点内容,包括如何运用数学建模、Python编程和pandas库进行数据处理与分析,旨在帮助考生备考。
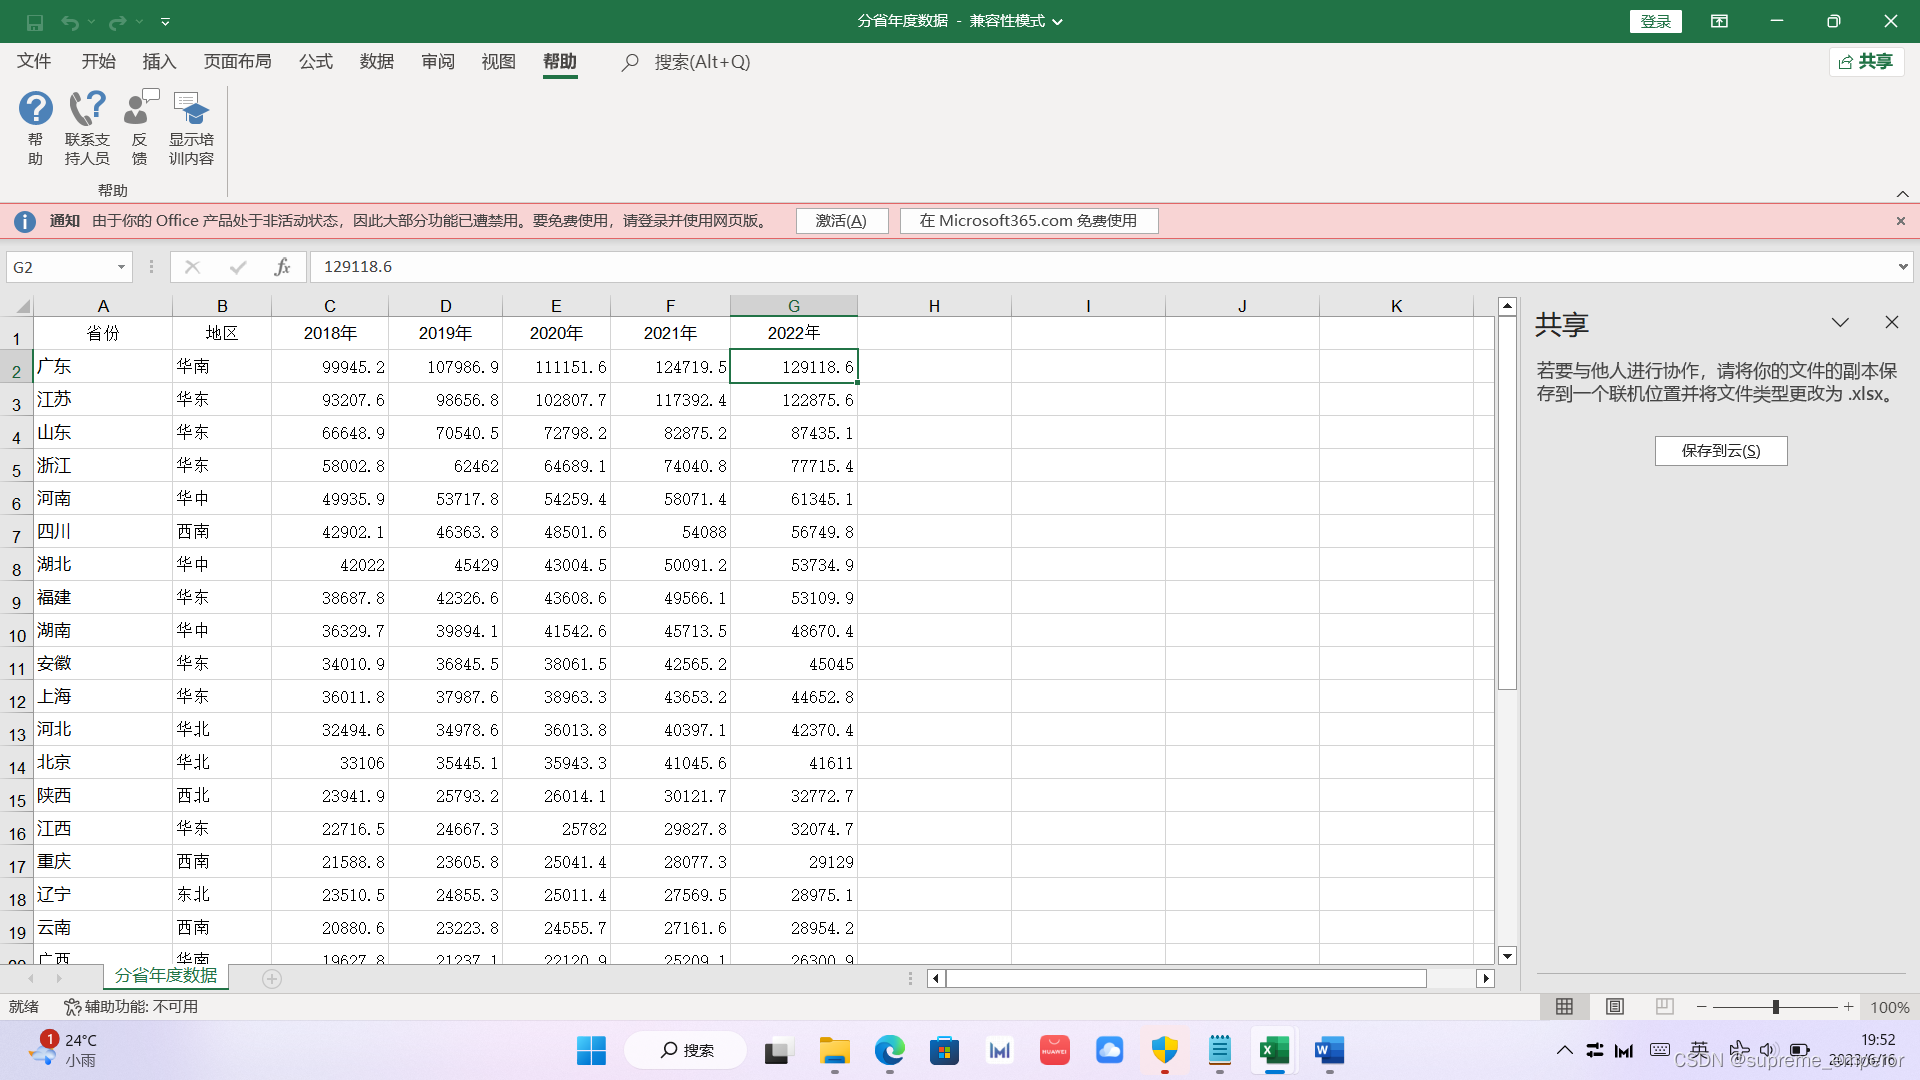
import pandas as pd
df=pd.read_excel("分省年度数据.xls")
print(df) #输出全部数据,类型为DataFrame
print("--"*20)
#以上代码为公共部分,把下列各数字对应代码复制到下方,运行体验
import matplotlib.pyplot as plt
df_top10=df.sort_values('2022年',ascending=False) #按2022年数据降序排序
df_top10=df_top10.head(10) #前10名
sf=df_top10.省份
nf=df_top10['2022年']
plt.barh(sf,nf,label="121212") #也可这样:plt.barh(y=sf,width=nf)
plt.title("2022年GDP前十省份对比图")
plt.xlabel("省份")
plt.ylabel("GDP(单位:亿元)")
plt.rcParams['font.sans-serif']=['SimHei']
plt.legend()
plt.show()
'''
1.多列,利用plot绘制柱形图
import matplotlib.pyplot as plt
df_top10=df.sort_values('2022年',ascending=False) #按2022年数据降序排序
df_top10=df_top10.head(10) #前10名
df_top10=df_top10.set_index(["省份"])
df_top10.plot(kind='bar',rot=0)
plt.title("2022年GDP前十省份对比图")
plt.xlabel("省份")
plt.ylabel("GDP(单位:亿元)")
plt.rcParams['fo数据可视化 浙江省技术高考必考

于 2023-06-16 19:50:50 首次发布
 最低0.47元/天 解锁文章


 被折叠的 条评论
为什么被折叠?
被折叠的 条评论
为什么被折叠?
 到【灌水乐园】发言


