


来源:数据STUDIO
本文约1800字,建议阅读5分钟
本文我们将利用 hampel 库,探讨如何应用这种离群点检测技术。在时间序列数据分析领域,识别和处理异常点是至关重要的任务。异常点或离群点是明显偏离预期模式的数据点,可能表明存在错误、欺诈或有价值的见解。
应对这一挑战的一种有效技术是汉普尔过滤器(Hampel Filter)。
解密汉普尔滤波法
汉普尔滤波法(Hampel filter)是检测和处理时间序列数据中离群值的一种稳健的方法。它依赖于中位数绝对偏差(MAD)[2] 并采用滚动窗口来识别离群值。MAD 是一种稳健的数据离散度量,以偏离中值的绝对偏差的中值计算。
配置汉普尔滤波器涉及两个参数:
窗口大小:该参数决定用于评估每个数据点的移动窗口的大小。它基本上定义了我们查找异常值的范围。
阈值:仔细选择阈值对于避免触发有价值数据的异常值检测至关重要。
Hampel与 Python 的结合
要在 Python 项目中使用 Hampel 过滤器,首先要通过 pip 安装软件包:
pip install hampel然后在 Python 脚本中导入它:
from hampel import hampelhampel函数有三个可用参数:
data 要过滤的输入一维数据(pandas.Series 或 numpy.ndarray)。
window_size(可选):用于离群点检测的移动窗口大小(默认为 5)。
n_sigma(可选):异常值检测的标准差个数(默认值为 3.0)。它与上一节讨论的阈值概念有关,即通过调整该参数,我们可以对可能的异常值有或多或少的容忍度。
现在,生成合成数据,在其中的 20、40、60、80 位置引入四个离群值(当然,在实际情况中问题不会这么简单,但这是一个很好的例子,可以了解 hampel 如何工作 )。
import matplotlib.pyplot as pltimport numpy as npfrom hampel import hampeloriginal_data = np.sin(np.linspace(0, 10, 100)) + np.random.normal(0, 0.1, 100)# Add outliers to the original datafor index, value in zip([20, 40, 60, 80], [2.0, -1.9, 2.1, -0.5]): original_data[index] = valu绘制 original_data 时,会看到如下内容:
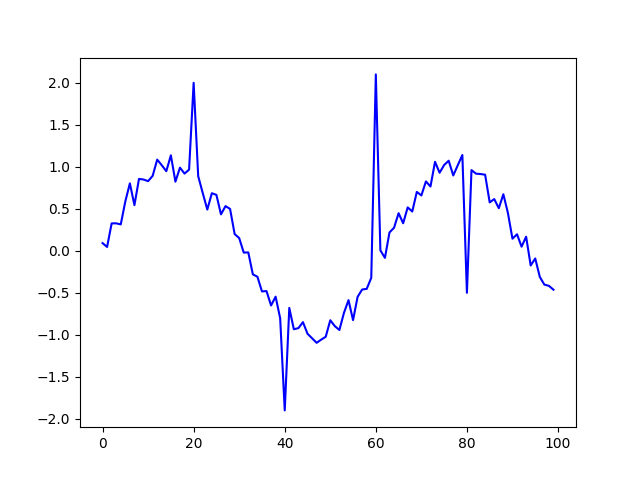
要直观地检测出我们引入的四个离群值非常容易,看看Hampel 是否也可以。
result = hampel(original_data, window_size=10)函数 hampel 返回一个 Result 数据类型,它包含以下属性:
filtered_data:已替换异常值的数据。
outlier_indices: 检测到的异常值的指数。
medians:滑动窗口内的中值。
median_absolute_deviations:滑动窗口内的绝对偏差中值 (MAD)。
thresholds:异常值检测的阈值。
可以像这样简单地访问这些属性:
filtered_data = result.filtered_dataoutlier_indices = result.outlier_indicesmedians = result.mediansmad_values = result.median_absolute_deviationsthresholds = result.thresholds例如,如果我们现在打印 filtered_data ,我们就会得到一个经过清理的 original_data 版本,即没有异常值的版本。
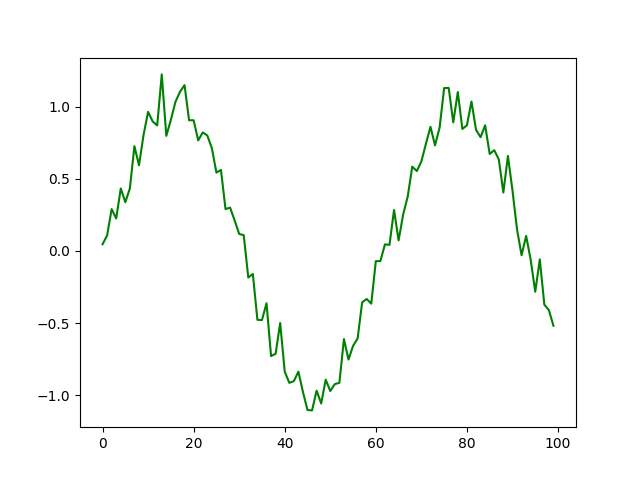
Hampel 设法删除了之前添加的异常值!
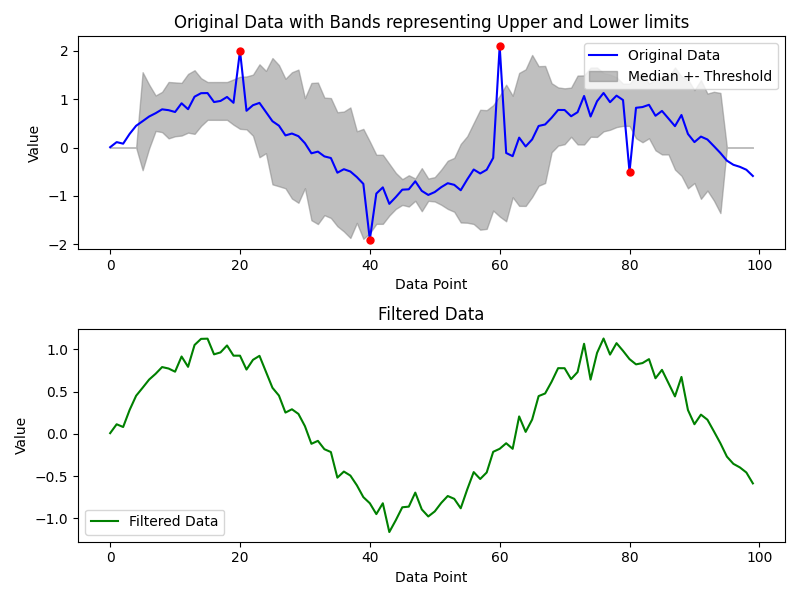
不过,可以利用 hampel提供的信息,设计出个更有趣的图表。在我的例子中,我会把个异常值画成红点,还会个灰色带,代表算法在每个点使用的阈值。此外,我还会在第一个图的下方创建另一个图,显示过滤后的数据。
使用 matplotlib 可以非常轻松地完成这项工作:
fig, axes = plt.subplots(2, 1, figsize=(8, 6))# Plot the original data with estimated standard deviations in the first subplotaxes[0].plot(original_data, label='Original Data', color='b')axes[0].fill_between(range(len(original_data)), medians + thresholds, medians - thresholds, color='gray', alpha=0.5, label='Median +- Threshold')axes[0].set_xlabel('Data Point')axes[0].set_ylabel('Value')axes[0].set_title('Original Data with Bands representing Upper and Lower limits')for i in outlier_indices: axes[0].plot(i, original_data[i], 'ro', markersize=5) # Mark as redaxes[0].legend()# Plot the filtered data in the second subplotaxes[1].plot(filtered_data, label='Filtered Data', color='g')axes[1].set_xlabel('Data Point')axes[1].set_ylabel('Value')axes[1].set_title('Filtered Data')axes[1].legend()# Adjust spacing between subplotsplt.tight_layout()# Show the plotsplt.show()运行该代码段后,应该会看到这样一幅美丽的图画
万一你想复制粘贴完整的 Python 脚本 …👇👇 👇
import matplotlib.pyplot as pltimport numpy as npfrom hampel import hampel# 推荐关注@公众号:数据STUDIO 更多优质推文定期推送original_data = np.sin(np.linspace(0, 10, 100)) + np.random.normal(0, 0.1, 100)# Add outliers to the original datafor index, value in zip([20, 40, 60, 80], [2.0, -1.9, 2.1, -0.5]): original_data[index] = valueresult = hampel(original_data, window_size=10)filtered_data = result.filtered_dataoutlier_indices = result.outlier_indicesmedians = result.mediansthresholds = result.thresholdsfig, axes = plt.subplots(2, 1, figsize=(8, 6))# Plot the original data with estimated standard deviations in the first subplotaxes[0].plot(original_data, label='Original Data', color='b')axes[0].fill_between(range(len(original_data)), medians + thresholds, medians - thresholds, color='gray', alpha=0.5, label='Median +- Threshold')axes[0].set_xlabel('Data Point')axes[0].set_ylabel('Value')axes[0].set_title('Original Data with Bands representing Upper and Lower limits')for i in outlier_indices: axes[0].plot(i, original_data[i], 'ro', markersize=5) # Mark as redaxes[0].legend()# Plot the filtered data in the second subplotaxes[1].plot(filtered_data, label='Filtered Data', color='g')axes[1].set_xlabel('Data Point')axes[1].set_ylabel('Value')axes[1].set_title('Filtered Data')axes[1].legend()# Adjust spacing between subplotsplt.tight_layout()# Show the plotsplt.show()参考资料:
[1]hampel 库: https://github.com/MichaelisTrofficus/hampel_filter
[2]中位数绝对偏差
(MAD): https://en.wikipedia.org/wiki/Median_absolute_deviation
编辑:王菁
校对:林亦霖


 6157
6157

 被折叠的 条评论
为什么被折叠?
被折叠的 条评论
为什么被折叠?
 到【灌水乐园】发言


