


近周学习进度以及学习心得
最近主要学习了链表的一些基本操作,增删改查以及链表的创建,学习了如何将单链表反转,然后还学习了二叉树的前序遍历。
c++课程跟着老师的步伐走,练了几个习题。
单链表的反转:
代码:
#include<stdio.h>
#include<malloc.h>
typedef struct node {
int data;
struct node* next;
}LNode;
LNode* L;
LNode* createList(LNode* L, int arr[], int n) {
L = (LNode*)malloc(sizeof(LNode));
LNode* p = L;
for (int i = 0; i < n; i++) {
LNode* newNode = (LNode*)malloc(sizeof(LNode));
newNode->data = arr[i];
newNode->next = NULL;
p->next = newNode;
p = p->next;
}
return L;
}
LNode* reverse(LNode* L) {
LNode* p = L;
LNode* q = p->next;
p->next = NULL;
LNode* temp;
while (q != NULL) {
temp = q->next;
q->next = p->next;
p->next = q;
q = temp;
}
return p;
}
int main() {
int arr[5], i;
for (i = 0; i < 5; i++)
scanf_s("%d", &arr[i]);
LNode* originlist = createList(L, arr, 5);
LNode* p = reverse(originlist);
while (p->next != NULL) {
printf("%d ", p->next->data);
p = p->next;
}
return 0;
}
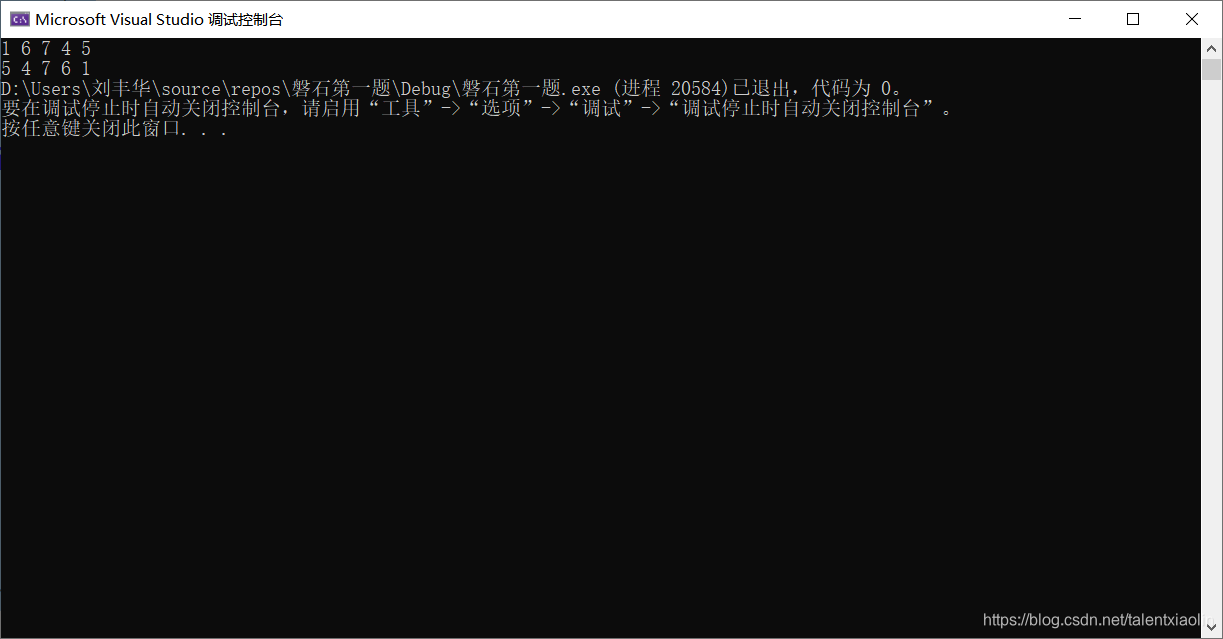
运行结果:
```
最近其他科目作业较多以及一些零零散散的小事很多,留给自己的时间很少,所以根本没学什么,数据结构入门太吃力了,接下来我要加把劲,学好数据结构,多刷点数据结构的题目,加深对其印象。


 1479
1479

 被折叠的 条评论
为什么被折叠?
被折叠的 条评论
为什么被折叠?
 到【灌水乐园】发言


