


3. OutOfMemory
3-1. Phenomenon
You got an OutOfMemory Error be outputted to log file, and the JVM fallen down.
It could be caused by either running out of Java Heap or Native Heap.
(OutOfMemory Errors can also be caused by a fragmented Java heap, due to the inability of the Java garbage collection process to free up any contiguous chunk of free memory for new objects during compaction, which will be discussed in next section.)
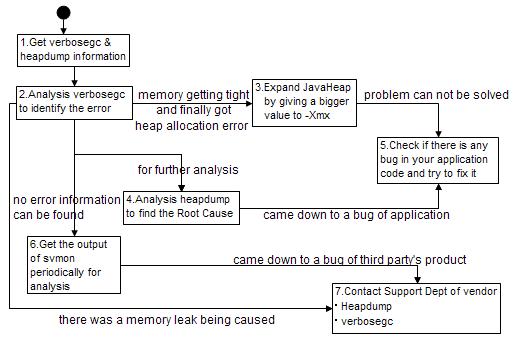
As to the former case, you get detailed error information from verbose output of your java application. Just remember to set the JVM variable –Xverbose:gc before running the application.
About the latter case, as there is not any useful information in verbose output of JVM, what you can do is to analysis the output of svmon command.
3-2. Handling
Now we have known what does OutOfMemory means to your java application, next we are going to see how we can do to the problem.
1. In the output of verbosegc give you a trace level information on how the GC processing is being done while your java application running.
To get verbosegc information, make sure you have set the JVM argument
–Xverbose:gc before start to run your java application. By default, A File with name of native_stderr.log will be generated, if you do not specify explicitly with command -Xverbosegclog:<path><filename> (from JDK1.4.0).
You can refer to「IBM JVM Garbage Collection and Storage Allocation techniques」for a detailed description of format of GC output.
As to heapdump, it is a text file which contains all the object information in the heap. Such as object’s address in the heap, size, type, even the address of objects to which it is referring.
By default, it will be generated when an OutOfMemory being cause, which means all the space of Java Heap has been used.
With the following setting, you can have it generated when a crash cause or a command request for heapdump was issued by user.
l IBM_HEAPDUMP=TRUE
l JAVA_DUMP_OPTS="ONANYSIGNAL(JAVADUMP,HEAPDUMP)"
*With IBM_HEAPDUMP_OUTOFMEMORY=FALSE, you can specify the JVM not to generate a heapdump even OutOfMemory was cause.
2. After getting the output of verbosegc, pay attention to the following points.
1) Period betweens two Allocation Failures
<AF[5]: Allocation Failure. need 32 bytes, 286 ms since last AF>
2) Amount of memory being freed by GC, and the percentage.
<GC(2): freed 1165360 bytes, 31% free (1325536/4192768), in 63 ms>
In a case of memory leak, you will found that as GC’s frequency is getting higher, amount of memory space being freed getting fewer. To solve this problem, you may have to do an inspection to your source code to identify where the root cause is and fix it.
3. If you have not found such a problem in the output, it may just means you are facing a new peak of requirement to java heap, which went over the value you have been estimated. So, simply expand the java heap with a bigger size, then verify it with performance test, then maybe you can close the problem smoothly.
4. It could be helpful for you to investigate the heapdump in a case of memory leak. As it could save your time when you inspect the java source to identify the root cause.
6. You found there is nothing wrong with Java Heap by analyzing output of verbosegc and heapdump. So you are getting to suspect the Native Heap. OutOfMemory that caused by Native Heap commonly will be associated with a bug in JVM or JIT. See the following example:
<AF[592]: Allocation Failure. need 9352 bytes, 34642 ms since last AF>
<AF[592]: managing allocation failure, action=1 (6848/1066159064) (7075808/7515688)>
<GC(592): GC cycle started Wed Jun 21 15:29:41 2006
<GC(592): freed 832138504 bytes, 78% free (839221160/1073674752), in 292 ms>
<GC(592): mark: 256 ms, sweep: 36 ms, compact: 0 ms>
<GC(592): refs: soft 0 (age >= 32), weak 0, final 11044, phantom 0>
<AF[592]: completed in 293 ms>
JVMDG217: Dump Handler is Processing a Signal - Please Wait.
JVMDG303: JVM Requesting Java core file
JVMDG304: Java core file written to /work/dump/javacore577680.1150871381.txt
JVMDG215: Dump Handler has Processed Exception Signal 11.
Though the last GC free 78% the memory space, still the JVM got down with an Exception Signal 11, which shows you there is something wrong to Native Heap, but not Java Heap.
Before we can make the conclusion, check it with the following step:
1) In order to perform debug on Native Heap, you had better separate Native Heap & Java Heap from using different segments. As I have mentioned in previous sections, memory space for Native Heap will always be allocated by using malloc(), so what you should do is to allocate memory space for Java Heap with mmap(). The following two ways can help you achieve this:
① Set a environment variable: IBM_JAVA_MMAP_JAVA_HEAP=true
② Firstly set the MAXDATA with an appropriate value, and then specify size of Java Heap with –Xmx parameter of JVM. Before performing the setting you should know that it is depending on version of your Java release.
Take JDK 1.4.2 on AIX as an example, by default, malloc() will be used to allocate space for Java Heap if –Xmx is equal or less than 1GB.
Case of Not Separate:
If your JVM start with –Xmx = 1024MB, MAXDATA=0xA@DSA will be set automatically, with the following snapshot of svmon command, you would found Java Heap and Native Heap are using the same segment.
root@wwas01[/home/root]#svmon -P 631002 -m
-------------------------------------------------------------------------------
Pid Command Inuse Pin Pgsp Virtual 64-bit Mthrd LPage
631002 java 439402 3950 15 379031 N Y N
PID TTY STAT TIME PGIN SIZE RSS LIM TSIZ TRS %CPU %MEM COMMAND
631002 - A 116:01 2033 1446760 1446020 32768 39 44 5.1 35.0 /usr
/Web
Vsid Esid Type Description LPage Inuse Pin Pgsp Virtual
926b3 4 work working storage - 65536 0 0 65536
33287 5 work working storage - 65536 0 0 65536
6a76c 6 work working storage - 65536 0 0 65536
d2d1a 3 work working storage - 65506 0 0 65506
fb3be 7 work working storage - 57086 0 0 57282
ab554 8 work working storage - 41922 0 0 41922
22f05 - pers /dev/logslv:12292 - 19529 0 - -
35e1 - pers /dev/logslv:2193 - 16038 0 - -
508aa d work loader segment - 10644 0 0 10654
0 0 work kernel segment - 6404 3868 15 6416
435c9 - pers /dev/logslv:2195 - 2546 0 - -
e99fd - pers /dev/hd2:303107 - 1467 0 - -
Firstly you should note virtual memory space of both Java Heap and Native Heap is of type work (work segment), but not pers(persistence segment), refer to previous section for meaning of both the two words.
Secondly, allocation for Native Heap will always prior to Java Heap.
Pay attention to segments with Esid 3, 4, 5,6,7,8, as in this case, Very Large Address-Space Model is being used, segments from 3 to C are available to malloc(). Space for Native Heap will start from segment 3, and clearly, it takes up full of segment 3, and part of segment 4. While space for is Java Heap starting from segment 4, as its size is 1024MB, so we can only know that it is end at segment 7 or segment 8, but have no way to make it more clearly (As you do not know how many space of segment 4 has been taken up by Native Heap).
As an addition, here I will give some description on pers segments.
435c9 - pers /dev/logslv:2195 - 2546 0 - -
e99fd - pers /dev/hd2:303107 - 1467 0 - -
Both the two are mapping from a physical file on your OS, to identify what file they are, you can try the two ways.
l Specify an –j option when use svmon command.
Ex. svmon -P 393362 -m -j
But notices that your server would get more load to process svmon command with -j option.
l With command lslv -L logslv, you can find out the mount point of logslv (ex. /logs), and then with ls -ali /logs | grep 2195, you would get the following result:
49184 -rw-r--r-- 1 root system 0 Jul 12 08:42 aa_debug.log
The same method can be used to hd2:303107, here we can find command as follows:
find /usr -inum 303107, and got the following result:
/usr/WebSphere/AppServer/java/jre/lib/graphics.jar
Case of Separate:
This time, we start the JVM with –Xmx = 1280MB, value of MAXDATA will have no change. See a snapshot of svmon to find what changed have happened:
root@wwas01[/home/root]#svmon -P 528626 -m
-------------------------------------------------------------------------------
Pid Command Inuse Pin Pgsp Virtual 64-bit Mthrd LPage
528626 java 519612 3954 4452 451178 N Y N
Vsid Esid Type Description LPage Inuse Pin Pgsp Virtual
95453 - work - 65536 0 0 65536
4d108 - work - 65536 0 0 65536
35527 - work - 65536 0 4 65536
5401 - work - 65536 0 0 65536
1a723 - work - 65528 0 6 65532
854f1 3 work working storage - 53358 0 4244 57791
155a3 4 work working storage - 47816 0 79 47872
ed5fc - pers /dev/logslv:49237 - 20738 0 - -
3af06 - pers /dev/logslv:12292 - 17093 0 - -
508aa d work loader segment - 10707 0 0 10768
0 0 work kernel segment - 6382 3868 39 6416
7ae8e c mmap mapped to sid 1a723 - 0 0 - -
3d466 8 mmap mapped to sid 5401 - 0 0 - -
6b00c 9 mmap mapped to sid 35527 - 0 0 - -
754ef a mmap mapped to sid 95453 - 0 0 - -
a2595 b mmap mapped to sid 4d108 - 0 0 - -
It seems the output of svmon became a little more complicated than previous one. We can see there are segments with mmap type and 0 pages Inuse at the bottom of the output, by their mapped sid you can find that they were mapped to segments with Visd equal to the value of sid, and the total size 256*5=1280MB is exactly what we have specified to –Xmx parameter. Here you can come out with a conclusion that:
l Space for Java Heap is being allocated from segment c to 8 using mmap(), as I have mentioned in previous sections that in Very Large Address-Space Model , segments of process’s share memory are allocated in order, starting from segment 0xC towards lower number segments.
l Space allocation for Native Heap is being started from segment 3, and has expanded to segment 4, where 47816 pages out of 65536 Inuse now.
2) Get the output of svmon periodically, for example, 3 times one day, 5 days one month. Especially for those time/day that a peak of transaction amount would come round.
Basically, usage of Native Heap becomes saturated with increasing to a certain level. But as native code that compiled by JIT also will be housed into the space, it gets increase slowly every time method be compiled due to the number of times called to the method has exceeded the threshold.
Pay attention to Inuse Page of the segments allocated to Native Heap. Chase the variation of amount of pages, especially at peak period or day.
3) If you want to chase the activity of JIT Compiler, Set
JITC_COMPILEOPT=COMPILING before starting the JVM.
You can find the information being outputted into stderr log file.
4) Until now, you can see that what we can do to solve the problem caused by Native Heap is so limited. As in most of the case, problems that related to Native Heap are caused by third party native module, JVM, or JIT Compiler, but not your application code. Size Adjustment of Native Heap could be useful sometimes, you can do it by either change the value of MAXDATA, or cut down the size of Java Heap.
A Setting of IBM_MIXED_MODE_THRESHOLD=0 while enable JIT will get you know if the space of Native Heap is big enough for housing all of the native code compiled by JIT at starting time of JVM.


 2412
2412


 被折叠的 条评论
为什么被折叠?
被折叠的 条评论
为什么被折叠?
 到【灌水乐园】发言


