


python -m pip install pip--upgrade pip
pip install --user PyQt5 -i https://pypi.tuna.tsinghua.edu.cn/simple
pip install --user pyqtgraph -i https://pypi.tuna.tsinghua.edu.cn/simple
pip install --user pymysql -i https://pypi.tuna.tsinghua.edu.cn/simple
pip install --user matplotlib -i https://pypi.tuna.tsinghua.edu.cn/simple
pip install --user opencv-python -i https://pypi.tuna.tsinghua.edu.cn/simple
pip install --user playsound -i https://pypi.tuna.tsinghua.edu.cn/simple
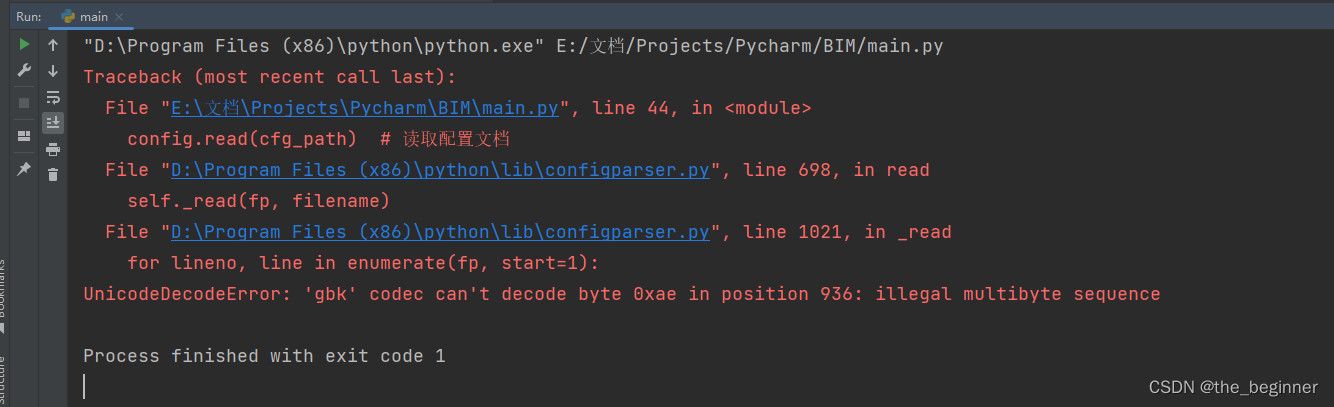
import configparser
cf = configparser.ConfigParser()
cf.read("./conf/config.ini", encoding="utf-8")  # 读取配置文件
pip install --user PySide2 -i https://pypi.tuna.tsinghua.edu.cn/simple
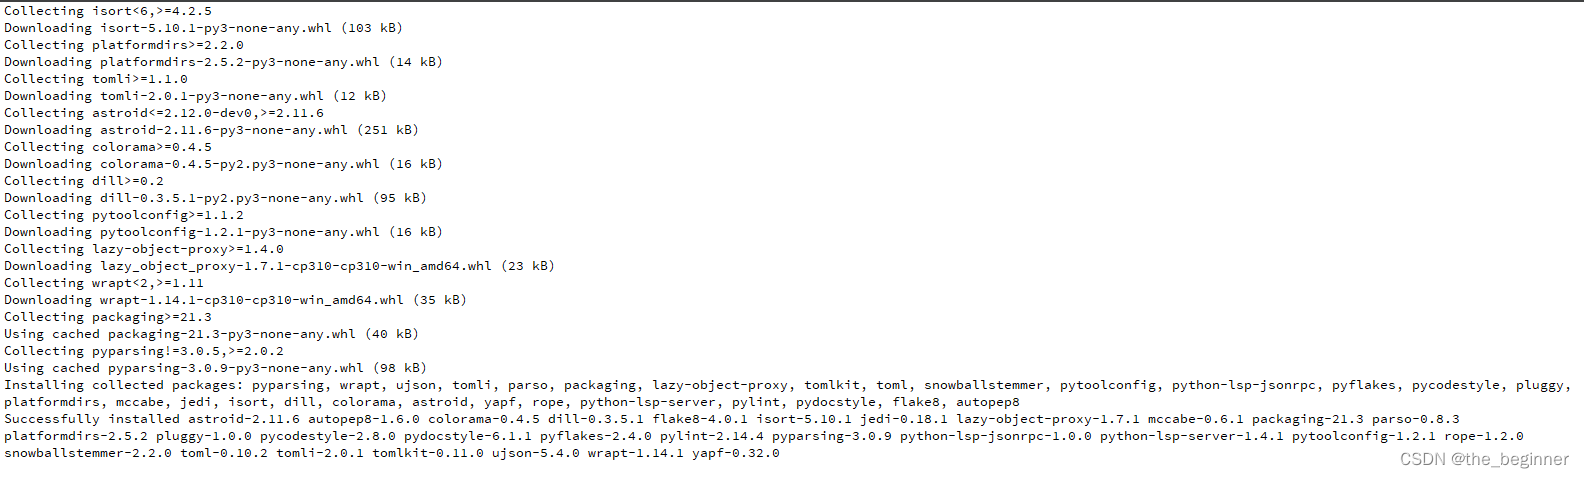
python -m pip install python-lsp-server[all] -i https://pypi.tuna.tsinghua.edu.cn/simple

pip install --user PySide2 -i https://pypi.tuna.tsinghua.edu.cn/simple
python -m pip install python-lsp-server[all] -i https://pypi.tuna.tsinghua.edu.cn/simple
python -m PyQt5.uic.pyuic form.ui -o demo.py
python -m PyQt5.uic.pyuic form.ui -o para.py
python -m PyQt5.uic.pyuic form.ui -o para1.py
python -m PyQt5.uic.pyuic form.ui -o hum.py
python -m PyQt5.uic.pyuic mainwindow.ui -o para.py
python -m PyQt5.uic.pyuic mainwindow.ui -o demo.py
pyqt设置背景图片格式
self.log1.setStyleSheet("background-image: url(bg.png)")
self.centralwidget.setStyleSheet("border-image: url(bg.png)")
self.task_widget.setStyleSheet("background:transparent")
background-color:transparent;
#objectname{border-image: url(:/resource/2850Demo_background.jpg);}
QWidget #background_centralwidget{border-image: url(:/001/bg.png);}\\n\n
QWidget #centralwidget {border-image: url(:/sources/images/54_bg.png);}
QWidget #centralwidget {border-image: url(:/sources/images/54_bg.png);}
ser = serial.Serial("com11", 115200) # 选择串口,并设置波特率
#错误整理
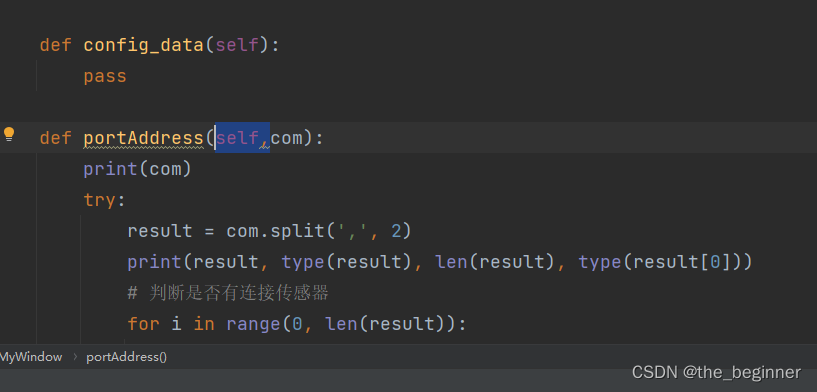
def portAddress(self,com):
#error:
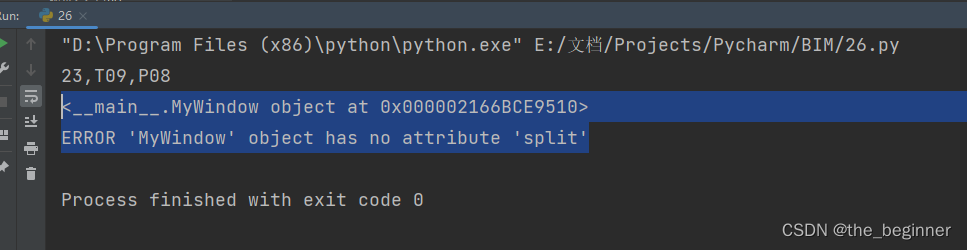
def portAddress(com,self):
#error
<__main__.MyWindow object at 0x000002166BCE9510>
ERROR 'MyWindow' object has no attribute 'split'
QWidget #background_centralwidget{border-image: url(:/001/sources/bg.png);
}
#widTop{border: 5px solid red}
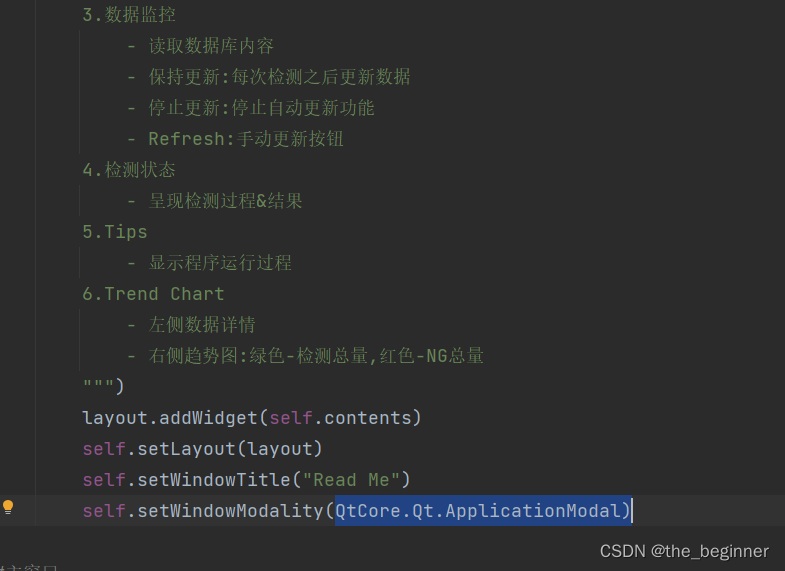
#报错,‘QT’not defined
self.setWindowModality(Qt.ApplicationModal)
#正确
self.setWindowModality(QtCore.Qt.ApplicationModal)
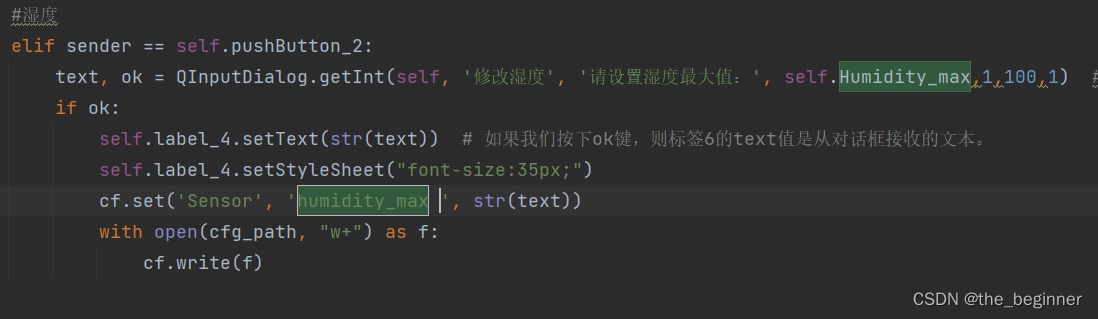
#字符串空格格外注意
#湿度
        elif sender == self.pushButton_2:
            text, ok = QInputDialog.getInt(self, '修改湿度', '请设置湿度最大值:', self.Humidity_max,1,100,1)  # 可以输入整数,最小值、最大值可以自己设定。
            if ok:
                self.label_4.setText(str(text))  # 如果我们按下ok键,则标签6的text值是从对话框接收的文本。
                self.label_4.setStyleSheet("font-size:35px;")
                cf.set('Sensor', 'humidity_max ', str(text))
                with open(cfg_path, "w+") as f:
                    cf.write(f)
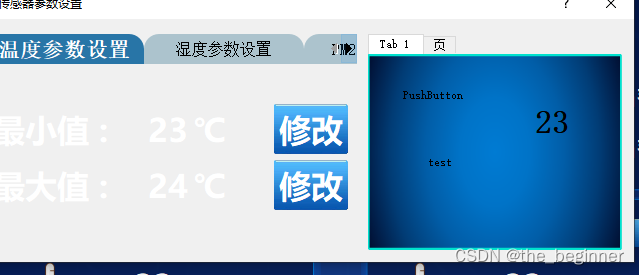
QTabWidget:pane {border-top:0px solid #e8f3f9;background:  transparent; }


/*标签样式*/
QTabBar::tab{
	background-color: rgb(172, 195, 205);
	width:150px;/*宽度根据实际需要进行调整*/
	height:20px;
	border-top-left-radius: 15px;
	border-top-right-radius: 15px;
	padding: 5px;
	font-size:12pt;

}
QTabBar::tab:selected{
	/*选中样式*/
	background-color: rgb(40, 117, 167);
	font-weight:bold;
	color: rgb(0, 79, 115);
	font-size:16pt;
	color:#ffffff;
}
QTabBar::tab:hover{
	/*鼠标悬停*/
	background-color: rgb(2, 64, 115);
}


QTabWidget{background-color: rgb(168, 193, 221);} # 配置以下代码使用
ui.tabWidget.setAttribute(Qt.WA_StyledBackground)  # 背景色应用到tab标题右侧
##QTabWidget设置背景图片
QTabWidget:pane {border-top:0px solid #e8f3f9;
border-image: url(:/sources/images/bord09.png); }
#代码结构如下
#错误示范
QTabWidget #test {border-top:0px solid #e8f3f9;
border-image: url(:/sources/images/bord09.png); }
打脸来的太快,实验证明,这种方式在QT里面无法显示背景图片,但是在程序(pycharm)里面可以显示。
而上一种方法能够在QT和程序(pycharm)里面同时显示。
而且确实需要一个容器才能正常显示这张图片。否则程序(pycharm)里面也无法正常显示。
而第一种方法则不需要这个容器。

#补充QtabBar设置标题栏位置
/*标签样式*/
QTabBar::tab{
	background-color: rgb(73, 167, 236);
	width:150px;/*宽度根据实际需要进行调整*/
	height:20px;
	border-top-left-radius: 10px;
	border-top-right-radius: 10px;
	padding: 5px;
	font-size:12pt;
	left:3px;
}
#QmenuBar
QMenuBar{
    background-color: #4F4F4F;
	color: rgb(255, 255, 255);
    margin: 0px;
    padding: 3px 10px;
    min-height: 20px;
    min-width: 20px;
}
QMenuBar::item{
    background-color: transparent;
    color: rgb(255, 255, 255);
    margin: 0px;
    padding: 3px 10px;
}
QMenuBar::item:selected{
    background-color: #262829;
    border: 1px solid #00BB9E;
}
QMenuBar::item:pressed{
    background-color: #969696;
    border: 1px solid #00BB9E;
}
QMenuBar,QMenuBar:disabled{
    color: #DCE1E6;
    background-color: #4F4F4F;
    border: 1px solid #4F4F4F;
    margin: 0px;
}
/* QMenu ------------------------------------------------------------
菜单
--------------------------------------------------------------------------- */
QMenu::item{
    padding: 3px 20px;
}
QMenu::indicator{
    width: 13px;
    height: 13px;
}
QMenu,QMenu:disabled{
    color: #DCE1E6;
    background-color: #4F4F4F;
    border: 1px solid #4F4F4F;
    margin: 0px;
}
QMenu::item:selected{
    background-color: #262829;
    border: 1px solid #00BB9E;
}
QMenu::item:pressed{
    background-color: #969696;
    border: 1px solid #00BB9E;
}
QMenu::separator{ /*分隔符*/
    height: 1px;
    background-color: #969696;}
##值得研究的代码(来自QT官方)
QPushButton
QPushButton#evilButton::menu-indicator {
    image: url(myindicator.png);
}
#自己用的代码
QPushButton{
border-image: url(:/sources/images/bord03.png);
color:white;font-family:微软雅黑;font-size:20pt;font-weight:300;
border-radius:25px;
}
setEnabled(false)
setClickable(false)
#比较列表元素
a=[3,4,5,10,11,14]
b=3
if 14in a:
    print("yes",(b in a))
# 设置图例并且设置图例的字体及大小
        font1 = {'family': 'Microsoft YaHei',
                 'weight': 'normal',
                 'size': 10,
                 }
        # 通过画子图的方式,使legend显示完全,如果不用这种方法,legend放在图像外面时,legend显示不全
        # 定义legend在图像外
        lgnd = self.axes.legend(
            ["upper_limit", "lower_limit", "temperature", ], bbox_to_anchor=(1, 1), loc='best', facecolor='None',
            prop=font1,labelcolor='w')
自定义画图基类
#!D:/workplace/python
# -*- coding: utf-8 -*-
# @File  : MyCanvas.py
# @Author:Romulushe
# @Time    : 2022/8/22 13:43
# @Software: PyCharm
# @Use: 画图类
import time

import matplotlib
matplotlib.use("Qt5Agg")  # 声明使用pyqt5
from matplotlib.backends.backend_qt5agg import FigureCanvasQTAgg  # pyqt5的画布
import matplotlib.pyplot as plt
# matplotlib.figure 模块提供了顶层的Artist(图中的所有可见元素都是Artist的子类),它包含了所有的plot元素
from matplotlib.figure import Figure


from PyQt5 import QtCore, QtWidgets, QtGui #图形库
import sys,os,random
import numpy as np

class MyMatplotlibFigure(FigureCanvasQTAgg):
    """
    创建一个画布类,并把画布放到FigureCanvasQTAgg
    """
    def __init__(self, width=10, heigh=10, dpi=100):
        plt.rcParams['figure.facecolor'] = 'None'
        plt.rcParams['axes.facecolor'] = 'None'  # 设置绘图区颜色
        # 创建一个Figure,该Figure为matplotlib下的Figure,不是matplotlib.pyplot下面的Figure
        self.figs = Figure(figsize=(2.60, 1.50), dpi=dpi)
        super(MyMatplotlibFigure, self).__init__(self.figs)  # 在父类种激活self.fig,
        self.axes = self.figs.add_subplot(111)  # 添加绘图区


        # self.axes_xlabel('times', fontsize=10)
        # self.axes_ylabel('℃',fontsize = 10)

        self.axes.spines['top'].set_visible(False)
        self.axes.spines['right'].set_visible(False)

        # self.axes.spines['top'].set_color('White')
        # self.axes.spines['right'].set_color('White')
        self.axes.spines['left'].set_color('White')
        self.axes.spines['bottom'].set_color('White')
        self.axes.tick_params(axis='y', colors='w',labelsize=8)
        self.axes.tick_params(axis='x', colors='w',labelsize=6.5)


    def set_fig_position(self):
        pass

    def set_fig_title(self,text):
        self.axes.set_title(str(text), color='white', fontproperties='Microsoft YaHei', fontsize=8)

    def set_legend(self):
        # 设置图例并且设置图例的字体及大小
        font1 = {'family': 'Microsoft YaHei',
                 'weight': 'normal',
                 'size': 5,
                 }
        # 通过画子图的方式,使legend显示完全,如果不用这种方法,legend放在图像外面时,legend显示不全
        # 定义legend在图像外
        lgnd = self.axes.legend(
            ["upper_limit", "lower_limit", "temperature", ], bbox_to_anchor=(1, 1), loc='best', facecolor='None',
            prop=font1, labelcolor='w', frameon=False, title='tips')


    def upper_limit(self,text):#直线
        self.axes.cla()  # 清除绘图区
        self.set_fig_title(text)
        self.axes.axhline(y=26.5, color='red', linestyle='-', label='温度上限')
        self.draw()

    def lower_limit(self):#直线
        self.axes.axhline(y=20.5, color='white', linestyle='--', label='温度下限')
        self.draw()

    def total_plot(self, tem,a):
        x = range(0,len(tem))
        self.axes.plot(tem, color='y',label='temperature', marker='', linewidth=2, markerfacecolor='None', markersize=10)
        for a, b in zip(x, tem):
            self.axes.text(a, b + 0.5, b, color='None', ha='center', va='bottom', fontsize=6,rotation=0)
        if a=='1':
            self.set_legend()
        self.figs.subplots_adjust(right=0.8)
        self.figs.canvas.draw()  # 这里注意是画布重绘,self.figs.canvas
        self.figs.canvas.flush_events()  # 画布刷新self.figs.canvas
        # self.draw()
查看matplolib版本
import matplotlib
print(matplotlib.__version__)


 1000
1000


 被折叠的 条评论
为什么被折叠?
被折叠的 条评论
为什么被折叠?
 到【灌水乐园】发言


