


set term post
set output "fig1.eps"
set size 1, 1
set multiplot layout 2, 2
set size 0.5, 0.5
set origin 0, 0.5
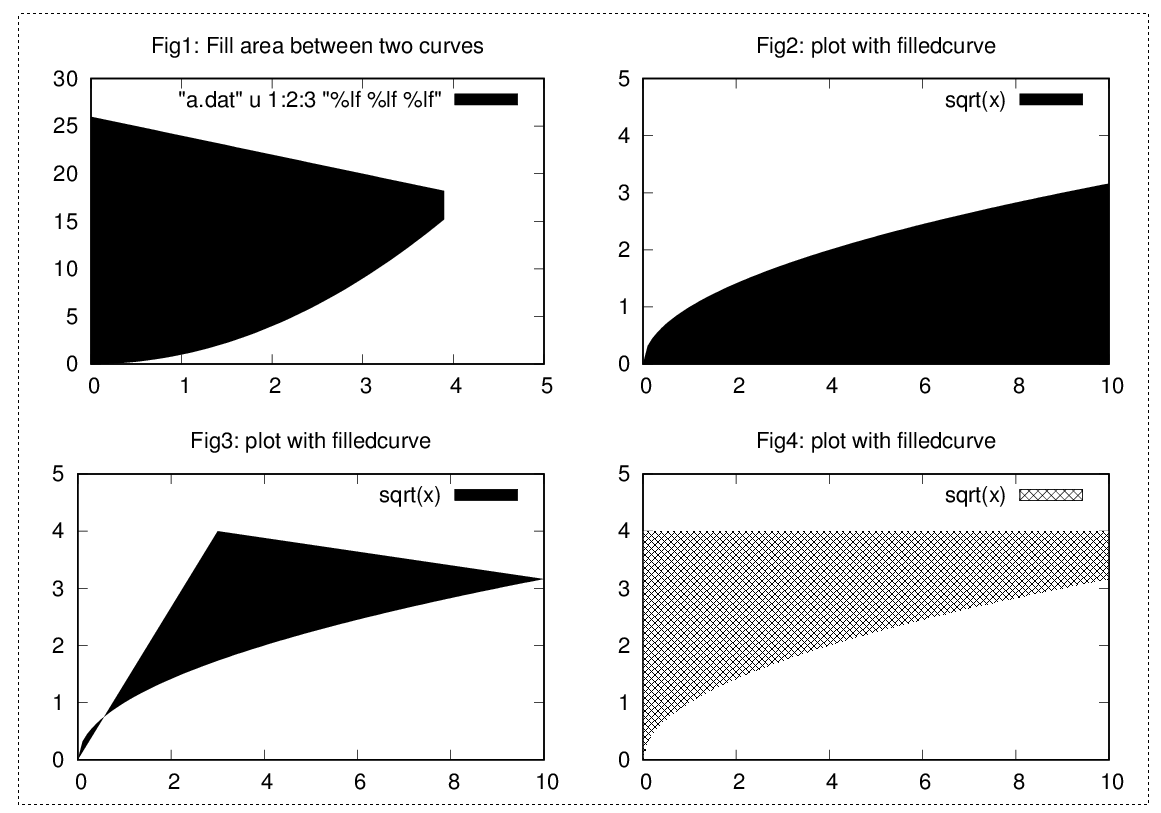
set title "Fig1: Fill area between two curves"
set style data lines
set xrange [0:5]
plot "a.dat" u 1:2:3 "%lf %lf %lf" w filledcu
set origin 0.5, 0.5
set title "Fig2: plot with filledcurve"
plot [0:10] [0:5] sqrt(x) with filledcurve x1
set origin 0,0
set title "Fig3: plot with filledcurve"
plot [0:10] [0:5] sqrt(x) with filledcurve xy=3,4
set origin 0.5,0
set title "Fig4: plot with filledcurve"
set style fill pattern 2
plot [0:10] [0:5] sqrt(x) with filledcurve y=4
unset multiplot
set output
reset效果如图:


 880
880

 被折叠的 条评论
为什么被折叠?
被折叠的 条评论
为什么被折叠?
 到【灌水乐园】发言


