


写在前面:
- 本文作为本人学习总结之用,同时分享给大家~
- 个人前端博客网站:zhangqiang.hk.cn
- 欢迎加入博主的前端学习qq交流群::706947563,专注前端开发,共同学习进步!
本文将使用的技术栈为:
- React Hooks
- Echars
react 官网:https://zh-hans.reactjs.org/docs/hooks-state.html#gatsby-focus-wrapper
EChars官网:https://echarts.apache.org/zh/tutorial.html#5 分钟上手 ECharts
1 安装react框架
npx create-react-app my-app
cd my-app
npm start
2 安装Echars包
npm install echarts --save
3 开始使用
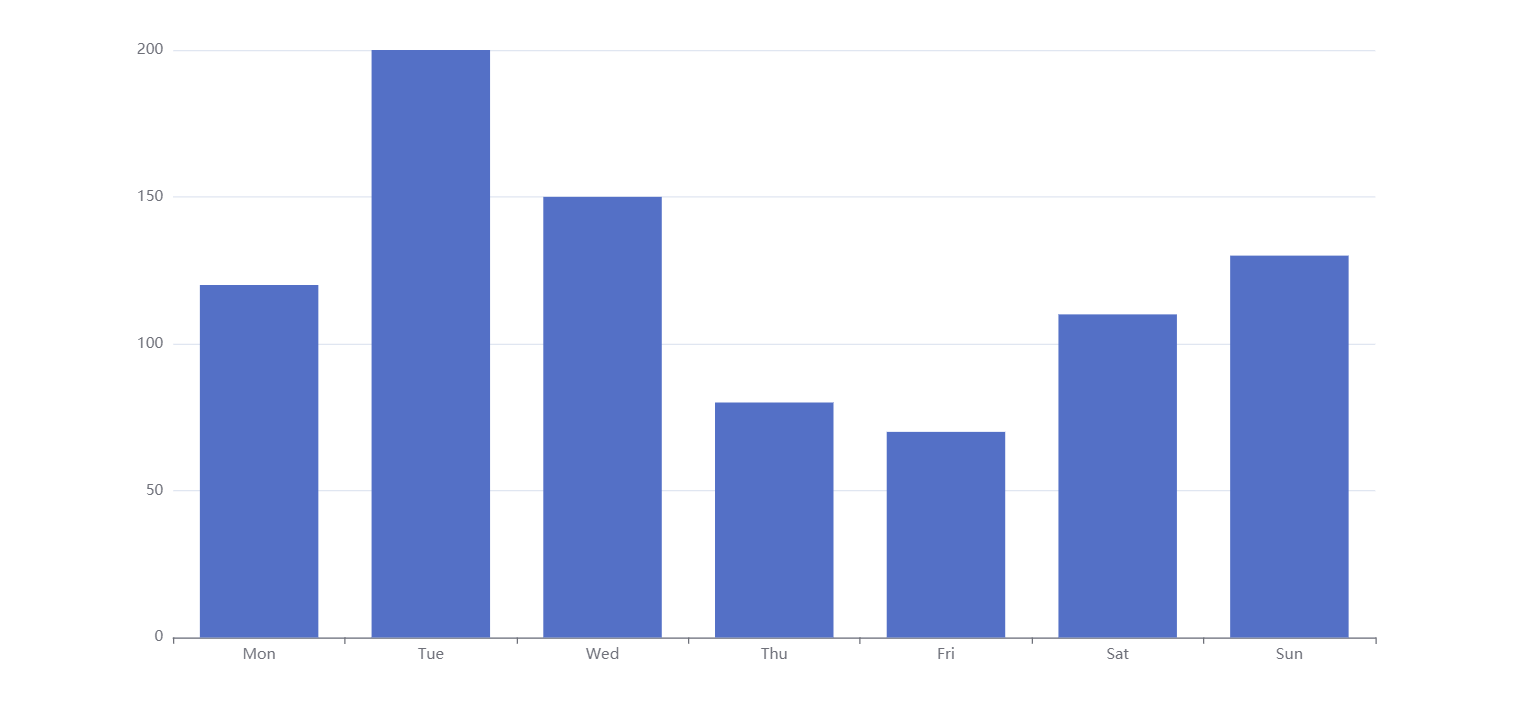
3.1 基础柱状图
import React, { useEffect } from "react";
import * as echarts from 'echarts';
const Child1Item = props => {
const initChart = () => {
let element = document.getElementById('chart1');
let myChart = echarts.init(element);
myChart.clear()
let option;
option = {
xAxis: {
type: 'category',
data: ['Mon', 'Tue', 'Wed', 'Thu', 'Fri', 'Sat', 'Sun']
},
yAxis: {
type: 'value'
},
series: [{
data: [120, 200, 150, 80, 70, 110, 130],
type: 'bar'
}]
};
option && myChart.setOption(option);
}
useEffect(() => {
initChart()
}, [])
return (
<div id='chart1' style={{ width: '80%', margin: '0 auto', height: '600px' }}></div>
)
}
export default Child1Item;
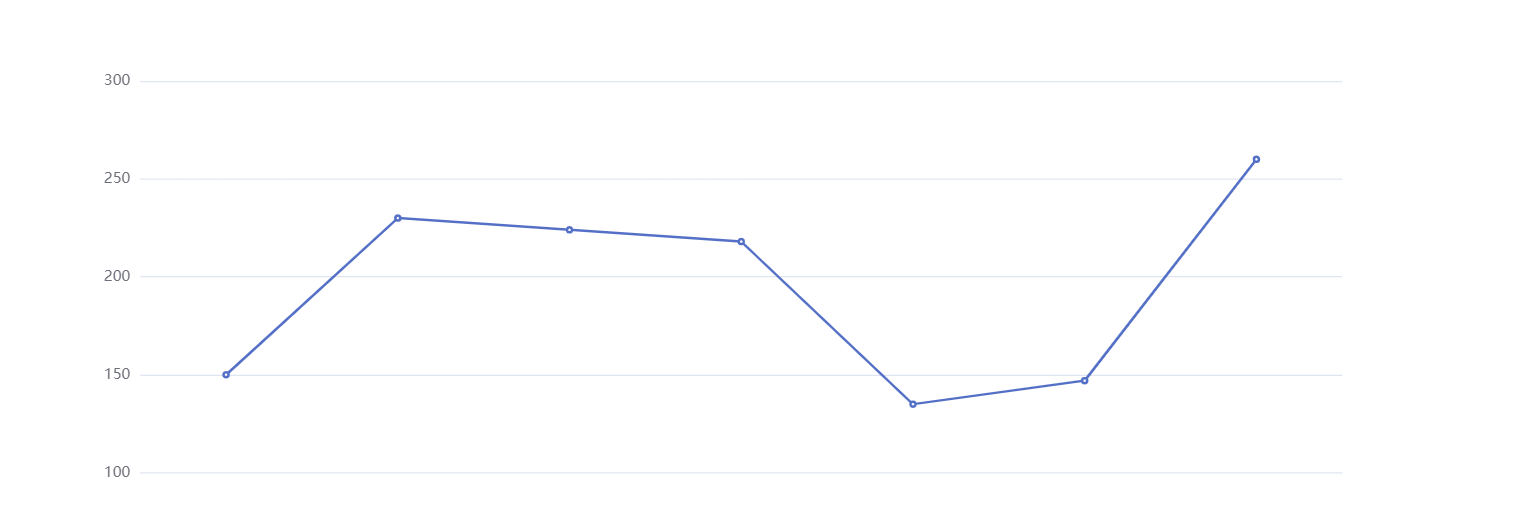
3.2 基础折线图
import React, { useEffect } from "react";
import * as echarts from 'echarts';
const Child2Item = props => {
const initChart = () => {
let element = document.getElementById('chart2');
let myChart = echarts.init(element);
myChart.clear()
let option;
option = {
xAxis: {
type: 'category',
data: ['Mon', 'Tue', 'Wed', 'Thu', 'Fri', 'Sat', 'Sun']
},
yAxis: {
type: 'value'
},
series: [{
data: [150, 230, 224, 218, 135, 147, 260],
type: 'line'
}]
};
option && myChart.setOption(option);
}
useEffect(() => {
initChart()
}, [])
return (
<div id='chart2' style={{ width: '80%', margin: '50px auto', height: '600px' }}></div>
)
}
export default Child2Item;
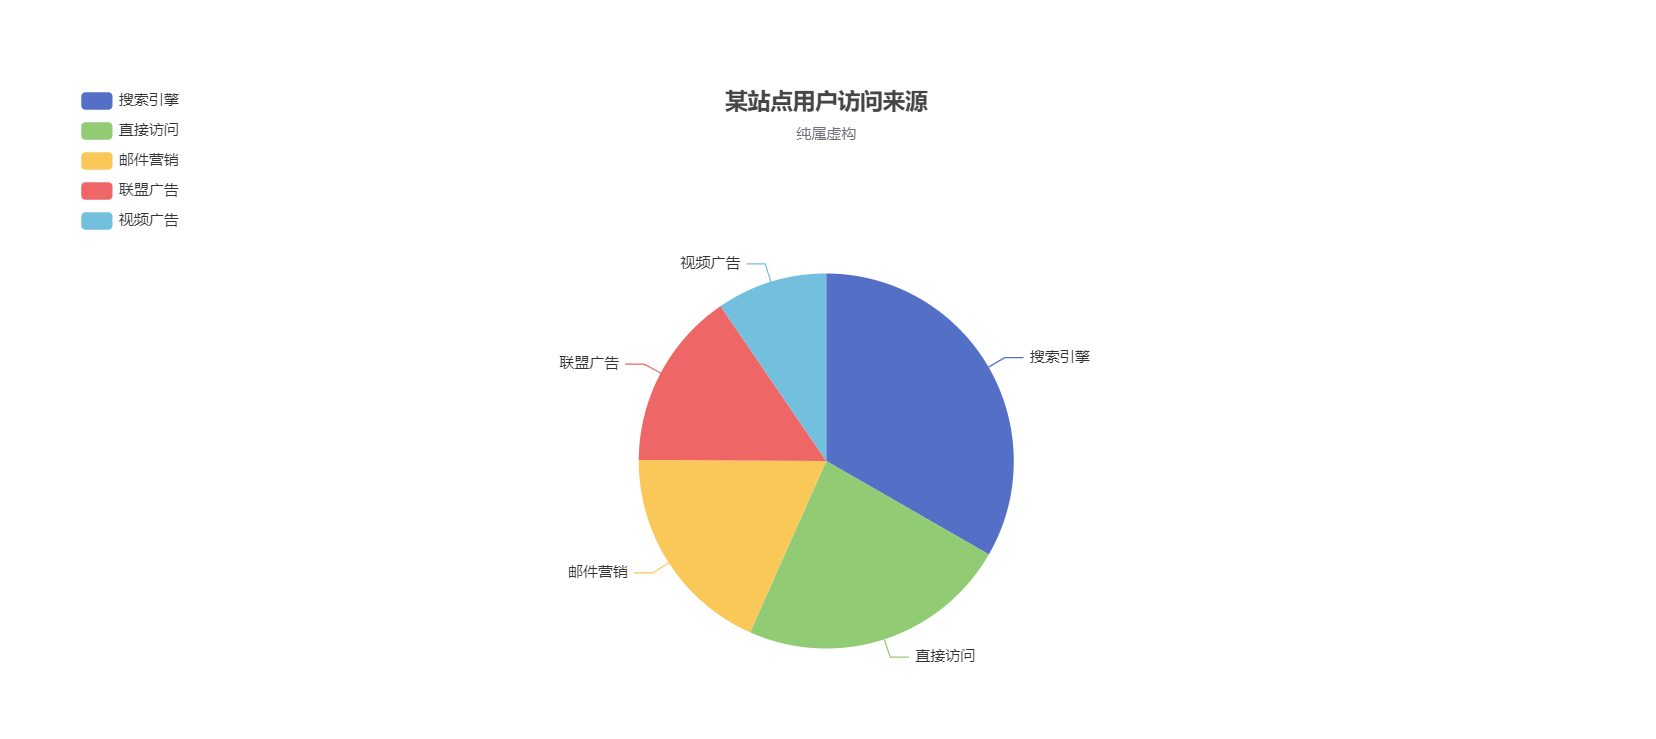
3.3 基础扇形图
import React, { useEffect } from "react";
import * as echarts from 'echarts';
const Child3Item = props => {
const initChart = () => {
let element = document.getElementById('chart3');
let myChart = echarts.init(element);
myChart.clear()
let option;
option = {
title: {
text: '某站点用户访问来源',
subtext: '纯属虚构',
left: 'center'
},
tooltip: {
trigger: 'item'
},
legend: {
orient: 'vertical',
left: 'left',
},
series: [
{
name: '访问来源',
type: 'pie',
radius: '50%',
data: [
{ value: 1048, name: '搜索引擎' },
{ value: 735, name: '直接访问' },
{ value: 580, name: '邮件营销' },
{ value: 484, name: '联盟广告' },
{ value: 300, name: '视频广告' }
],
emphasis: {
itemStyle: {
shadowBlur: 10,
shadowOffsetX: 0,
shadowColor: 'rgba(0, 0, 0, 0.5)'
}
}
}
]
};
option && myChart.setOption(option);
}
useEffect(() => {
initChart()
}, [])
return (
<div id='chart3' style={{ width: '80%', margin: '50px auto', height: '600px' }}></div>
)
}
export default Child3Item;
这里推荐ECharts官网的配置项手册,真是好用啊!不多说,直接上链接:https://echarts.apache.org/zh/option.html#title
然后这是本文写的例子的github源码:https://github.com/JACK-ZHANG-coming/react-demo-project


 1701
1701


 被折叠的 条评论
为什么被折叠?
被折叠的 条评论
为什么被折叠?
 到【灌水乐园】发言


