


 本文探讨了控制变量在估计量中的应用,通过设计与目标函数相关的辅助函数,减小方差。重点介绍了控制变量的原理、计算方法,以及与对偶变量和重要性采样的关系。通过实例展示了如何通过选择合适的importancefunction优化估计过程。
Control Variates
考虑
θ
=
E
[
g
(
X
)
]
\theta =E[g(X)]
θ=E[g(X)]
现在,我们可以设计一个易于计算均值且与g(x)相关的函数f(x),然后,对任意常数c,容易验证下式是theta的无偏估计量
θ
^
c
=
g
(
X
)
+
c
(
f
(
X
)
−
μ
)
\hat \theta_c=g(X)+c(f(X)-\mu)
θ^c=g(X)+c(f(X)−μ)
由此,可以计算这个新的估计量的方差。
V
a
r
(
θ
^
c
)
=
V
a
r
(
g
(
X
)
)
+
c
2
V
a
r
(
f
(
X
)
)
+
2
c
C
o
v
(
g
(
X
)
,
f
(
X
)
)
Var(\hat \theta _c)=Var(g(X))+c^2 Var(f(X))+2cCov(g(X),f(X))
Var(θ^c)=Var(g(X))+c2Var(f(X))+2cCov(g(X),f(X))
此方差是关于c的二次函数。由于c可以取任意值,自然可以找到二次函数的极值点c*。
c
∗
=
−
C
o
v
(
g
(
X
)
,
f
(
X
)
)
V
a
r
(
f
(
X
)
)
c*= -\frac{Cov(g(X),f(X))}{Var(f(X))}
c∗=−Var(f(X))Cov(g(X),f(X))
由此得到最小方差
V
a
r
(
θ
^
c
∗
)
=
V
a
r
(
g
(
X
)
)
−
[
C
o
v
(
g
(
X
)
,
f
(
X
)
)
]
2
V
a
r
(
f
(
X
)
)
Var(\hat \theta_{c*})=Var(g(X))-\frac{[Cov(g(X),f(X))]^2}{Var(f(X))}
Var(θ^c∗)=Var(g(X))−Var(f(X))[Cov(g(X),f(X))]2
随机变量f(X)被称作 a control variate for the estimator g(X). 由此,我们可以了解到,方差的减小是
[
C
o
v
(
g
(
X
)
,
f
(
X
)
)
]
2
V
a
r
(
f
(
X
)
)
\frac{[Cov(g(X),f(X))]^2}{Var(f(X))}
Var(f(X))[Cov(g(X),f(X))]2
由此计算出percent reduction
[
C
o
v
(
g
(
X
)
,
f
(
X
)
)
]
2
V
a
r
(
f
(
X
)
)
⋅
1
V
a
r
(
g
(
X
)
)
×
100
%
=
[
C
o
v
(
g
(
X
)
,
f
(
X
)
)
]
2
\frac{[Cov(g(X),f(X))]^2}{Var(f(X))} \cdot \frac{1}{Var(g(X))}\times 100\%=[Cov(g(X),f(X))]^2
Var(f(X))[Cov(g(X),f(X))]2⋅Var(g(X))1×100%=[Cov(g(X),f(X))]2
因此,如果f(X)和g(X)能做到强相关的话,对于减小方差是非常有利的。如果f和g是无关的话,就无法减小方差。
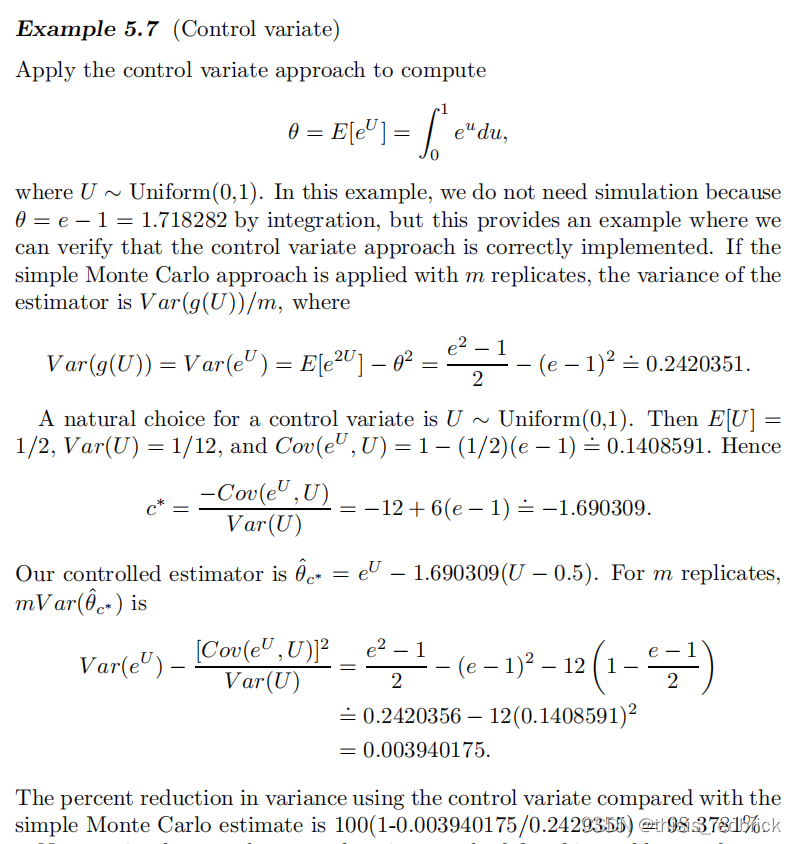
计算c*需要得到Cov(f(X),g(X))和Var(f(X)),这些参数可以通过前置的MC实验估计出来。
例子(示例代码在Rworking文件夹中)
Antithetic variate as control variate
断言:对偶变量实际上是控制变量的特例。
首先,了解到控制变量实际上是两个theta的无偏估计量的线性组合。
θ
^
c
=
c
θ
^
1
+
(
1
−
c
)
θ
^
2
\hat \theta_c =c\hat \theta_1+(1-c)\hat \theta_2
θ^c=cθ^1+(1−c)θ^2
由此,对任意c,控制变量也是theta的无偏估计量,其方差为
V
a
r
(
θ
^
2
)
+
c
2
V
a
r
(
θ
^
1
−
θ
^
2
)
+
2
c
C
o
v
(
θ
^
2
,
θ
^
1
−
θ
^
2
)
Var(\hat \theta_2)+c^2Var(\hat \theta_1-\hat \theta_2)+2cCov(\hat \theta_2,\hat \theta_1-\hat \theta_2)
Var(θ^2)+c2Var(θ^1−θ^2)+2cCov(θ^2,θ^1−θ^2)
在对偶变量中,
θ
^
1
=
U
,
θ
^
2
=
1
−
U
,
C
o
r
r
(
θ
^
1
,
θ
^
2
)
=
−
1
⟶
C
o
v
(
θ
^
1
,
θ
^
2
)
=
−
V
a
r
(
θ
^
1
)
\hat \theta_1 = U,\hat \theta_2 = 1-U,\\ Corr(\hat \theta_1,\hat \theta_2)=-1\longrightarrow Cov(\hat \theta_1,\hat \theta_2)=-Var(\hat \theta_1)
θ^1=U,θ^2=1−U,Corr(θ^1,θ^2)=−1⟶Cov(θ^1,θ^2)=−Var(θ^1)
由此,
V
a
r
θ
^
c
=
4
c
2
V
a
r
(
θ
^
1
)
−
4
c
V
a
r
(
θ
^
1
)
+
V
a
r
(
θ
^
1
)
=
(
4
c
2
−
4
c
+
1
)
V
a
r
(
θ
^
1
)
Var \hat \theta_c = 4c^2Var(\hat \theta_1)-4cVar(\hat \theta_1)+Var(\hat \theta_1)=(4c^2-4c+1)Var(\hat \theta_1)
Varθ^c=4c2Var(θ^1)−4cVar(θ^1)+Var(θ^1)=(4c2−4c+1)Var(θ^1)
最优的c*是1/2,所以control variate estimator就是
θ
^
c
∗
=
θ
^
1
+
θ
^
2
2
\hat \theta_{c*}=\frac{\hat \theta_1+\hat \theta_2}{2}
θ^c∗=2θ^1+θ^2
这正是antithetic variable estimator of \theta。
control variate也可以是多个的。如果有多个彼此相关的\theta的无偏估计量,c是概率分布向量,那么
∑
i
=
1
k
c
i
θ
^
i
\sum_{i=1}^k c_i\hat \theta_i
i=1∑kciθ^i
同样是theta的无偏估计量。其对应的control variate estimator是
θ
^
c
=
g
(
X
)
+
∑
i
=
1
k
c
i
∗
(
f
i
(
X
)
−
μ
i
)
,
μ
i
=
E
[
f
i
(
X
)
]
\hat \theta_c = g(X)+\sum_{i=1}^k c_i*(f_i(X)-\mu_i),\mu_i=E[f_i(X)]
θ^c=g(X)+i=1∑kci∗(fi(X)−μi),μi=E[fi(X)]
E [ θ ^ c ] = E [ g ( X ) ] = θ E[\hat \theta_c]=E[g(X)]=\theta E[θ^c]=E[g(X)]=θ
Control variates and regression
考虑control variate 和 regression的对偶性。(this provide more insight into how the control variate reduces the variance in Monte Carlo integration)
考虑随机样本
(
X
1
,
Y
1
)
,
.
.
.
,
(
X
n
,
Y
n
)
(X_1,Y_1),...,(X_n,Y_n)
(X1,Y1),...,(Xn,Yn)
现在,将X和Y的最小二乘估计量和control variate作一对比。
斜率和c的对比
假定X和Y有线性关系,
X
=
β
1
Y
+
β
0
+
ϵ
,
E
[
ϵ
]
=
0
X=\beta_1Y+\beta_0+\epsilon,E[\epsilon]=0
X=β1Y+β0+ϵ,E[ϵ]=0
E [ X ] = β 0 + β 1 μ Y E[X]=\beta_0+\beta_1\mu_Y E[X]=β0+β1μY
现在,考虑二元样本
(
g
(
X
1
)
,
f
(
X
1
)
)
,
.
.
.
,
(
g
(
X
n
)
,
f
(
X
n
)
)
(g(X_1),f(X_1)),...,(g(X_n),f(X_n))
(g(X1),f(X1)),...,(g(Xn),f(Xn))
即将g(X)代入X,将f(X)代入Y,则有
g
(
X
)
=
β
0
+
β
1
f
(
X
)
+
ϵ
g(X)=\beta_0+\beta_1 f(X)+\epsilon
g(X)=β0+β1f(X)+ϵ
E [ g ( X ) ] = β 0 + β 1 E [ f ( X ) ] E[g(X)]=\beta_0+\beta_1E[f(X)] E[g(X)]=β0+β1E[f(X)]
斜率的最小二乘估计是
β
^
1
=
C
o
v
^
(
g
(
X
)
,
f
(
X
)
)
V
a
r
^
(
f
(
X
)
)
=
−
c
^
∗
\hat \beta_1 = \frac{\widehat {Cov}(g(X),f(X))}{\widehat{Var}(f(X))}=-\hat c^*
β^1=Var
(f(X))Cov
(g(X),f(X))=−c^∗
这正是我们之前从c的二次函数中推导出来的最优的c。
这给了我们一个估计c*的简便方式:直接拿g(X)关于f(X)的线性回归模型的斜率来用。
L<-lm(gx~fx)
c.star<--L&coeff[2]
样本中心点预测值和估计量对比
因为线性回归模型得到的直线通过样本x和y的中心点,所以
KaTeX parse error: No such environment: eqnarray at position 8: \begin{̲e̲q̲n̲a̲r̲r̲a̲y̲}̲ \hat \beta_0+\…
因此,control variate的估计量就是线性回归模型在样本横坐标中心点E[f(X)]处的预测值。
线性回归MSE和control variate的方差对比
简单回归的MSE也可以写成
KaTeX parse error: No such environment: eqnarray at position 8: \begin{̲e̲q̲n̲a̲r̲r̲a̲y̲}̲ \hat \sigma^2_…
而control variate的方差如下
KaTeX parse error: No such environment: eqnarray at position 8: \begin{̲e̲q̲n̲a̲r̲r̲a̲y̲}̲ \widehat {Var}…
由此,control variate估计量的方差也可以通过估计线性回归模型的MSE得到。
se.hat<-summary(L)$sigma
方差减小百分比和相关系数R^2的比较
[ C o r r ( g ( X ) , f ( X ) ) ] 2 → R 2 [Corr(g(X),f(X))]^2\rightarrow R^2 [Corr(g(X),f(X))]2→R2
数字是一样的。也就是说,相关系数越大,方差减小百分比就越大。
在多个控制变量的情况下,对偶性同样成立。
X
=
β
0
+
∑
i
=
1
k
β
i
Y
i
+
ϵ
X=\beta_0+\sum_{i=1}^k \beta_iY_i+\epsilon
X=β0+i=1∑kβiYi+ϵ
- 最优c与斜率。
− c ^ ∗ = ( β ^ 1 , . . . , β ^ k ) -\hat c^*=(\hat \beta_1,...,\hat \beta_k) −c^∗=(β^1,...,β^k)
- 估计量与样本中心点预测值
the estimate is the predicted response \hat X at the point
- 估计量的方差和线性回归模型MSE
σ ^ ϵ 2 n = M S E n \frac{\hat \sigma^2_\epsilon}{n}=\frac{MSE}{n} nσ^ϵ2=nMSE
Importance Sampling
一般来说,我们可以用蒙特卡罗方法估计函数积分的值
E
[
g
(
X
)
]
=
∫
a
b
g
(
x
)
1
b
−
a
d
x
=
1
b
−
a
∫
a
b
g
(
x
)
d
x
E[g(X)]=\int_a^b g(x)\frac{1}{b-a}dx=\frac{1}{b-a}\int_a^b g(x)dx
E[g(X)]=∫abg(x)b−a1dx=b−a1∫abg(x)dx
e s t i m a t o r : b − a m ∑ i = 1 m g ( X i ) estimator: \frac{b-a}{m}\sum_{i=1}^m g(X_i) estimator:mb−ai=1∑mg(Xi)
由大数定律,上式收敛到g(x)在a到b上的积分。
但是,此公式不能处理无界区间上的积分,而且当g(x)的分布不够均匀时,此种方法的效率可能会很低。
不过,如果我们把积分看做是一种期望的话,我们就有理由选择Uniform之外的其它概率分布。This lead us to a general method called importance sampling。
考虑X,X的pdf为f(x)。那么,对于g(x)的积分就可以改写成
∫
g
(
x
)
d
x
=
∫
g
(
x
)
f
(
x
)
f
(
x
)
d
x
=
∫
Y
(
X
)
f
(
x
)
d
x
=
E
[
Y
]
\int g(x)dx=\int \frac{g(x)}{f(x)}f(x)dx=\int Y(X)f(x)dx=E[Y]
∫g(x)dx=∫f(x)g(x)f(x)dx=∫Y(X)f(x)dx=E[Y]
我们可以通过蒙特卡罗积分来估计E[Y],此时,density f(x) 就被称作importance function.
设法降低Var(Y) ?
当Y接近于一个常数时,Y的方差比较小。所以,the density f should be ‘close’ to g(x). Also, the varaible with density f should be reasonably easy to simulate.
考虑常规对g的期望。如果在集合A上,x的分布是f,那么
θ
=
∫
A
g
(
x
)
f
(
x
)
d
x
\theta =\int_Ag(x)f(x)dx
θ=∫Ag(x)f(x)dx
如果在A上定义一个非负函数φ(x)
θ
=
∫
A
g
(
x
)
f
(
x
)
ϕ
(
x
)
ϕ
(
x
)
d
x
\theta=\int_A g(x)\frac{f(x)}{\phi(x)}\phi(x)dx
θ=∫Ag(x)ϕ(x)f(x)ϕ(x)dx
θ ^ = 1 n ∑ i = 1 n g ( X i ) f ( X i ) ϕ ( X i ) \hat \theta =\frac{1}{n}\sum _{i=1}^ng(X_i)\frac{f(X_i)}{\phi(X_i)} θ^=n1i=1∑ng(Xi)ϕ(Xi)f(Xi)
φ函数被称为envelope或importance sampling function。最好
ϕ
(
x
)
=
≈
∣
g
(
x
)
∣
f
(
x
)
\phi(x)\stackrel \approx = |g(x)|f(x)
ϕ(x)=≈∣g(x)∣f(x)
例子见代码
这个例子说明,一定要注意选取合适的importance sampling function, 使得g(x)/f(x)接近一个常数。如此才能实现降低方差的目的。


 被折叠的 条评论
为什么被折叠?
被折叠的 条评论
为什么被折叠?
 到【灌水乐园】发言


