


一、 SpringBootActuator
1.1 简介
未来每一个微服务在云上部署以后,我们都需要对其进行监控、追踪、审计、控制等。SpringBoot就抽取了Actuator场景,使得我们每个微服务快速引用即可获得生产级别的应用监控、审计等功能。
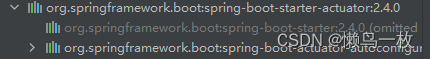
<dependency>
        <groupId>org.springframework.boot</groupId>
        <artifactId>spring-boot-starter-actuator</artifactId>
</dependency>
1.2 springboot 2 1.x与2.x的不同
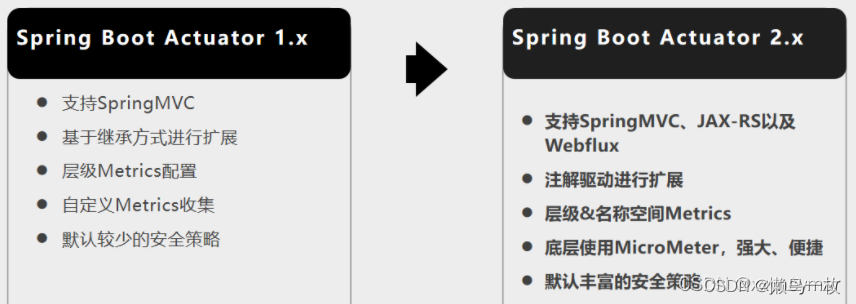
SpringBoot Actuator 1.x
支持SpringMVC
基于继承方式进行扩展
层级Metrics配置
自定义Metrics收集
默认较少的安全策略
SpringBoot Actuator 2.x
支持SpringMVC、JAX-RS以及Webflux
注解驱动进行扩展
层级&名称空间Metrics
底层使用MicroMeter,强大、便捷默认丰富的安全策略
1.3 如何使用
1、引入场景
    <dependency>
        <groupId>org.springframework.boot</groupId>
        <artifactId>spring-boot-starter-actuator</artifactId>
    </dependency>
2、访问 localhost:8080/actuator/*
3、 暴露所有监控信息为 HTTP
#management.endpoints 是所有 Actuator 的配置
#management.endpoint.端点名.xxx 对某个端点的具体配置
management:
  endpoints:
    enabled-by-default: true #暴露所有端点信息
    web:
      exposure:
        include: '*' #以 web 方式暴露所有端点
  endpoint:
    health: #health 的具体配置
      show-details: always
测试
- http://localhost:8080/actuator/beans
- http://localhost:8080/actuator/configprops
- http://localhost:8080/actuator/metrics
- http://localhost:8080/actuator/metrics/jvm.gc.pause
- http://localhost:8080/actuator/metrics/endpointName/detailPath
4. 开启与禁用 Endpoints
1、默认所有的 Endpoints 除【shutdown 】都是开启的。
2、需要开启或禁用某个 Endpoint。配置模式为 【management.endpoint..enabled = true】
management:
  endpoints:
    enabled-by-default: false
  endpoint:
    beans:
      enabled: true
    health:
      enabled: true
3、或者禁用所有的 Endpoint,然后手动开启指定的 Endpoint。
二、Actuator Endpoint 监控端点及开启与禁用
2.1 常使用的端点
| ID | 描述 |
|---|---|
| auditevents | 暴露当前应用程序的审核事件信息。需要一个AuditEventRepository组件。 |
| beans | 显示应用程序中所有Spring Bean的完整列表。 |
| caches | 暴露可用的缓存。 |
| conditions | 显示自动配置的所有条件信息,包括匹配或不匹配的原因。 |
| configprops | 显示所有@ConfigurationProperties。 |
| env | 暴露Spring的属性ConfigurableEnvironment |
| flyway | 显示已应用的所有Flyway数据库迁移。 需要一个或多个Flyway组件。 |
| health | 显示应用程序运行状况信息。 |
| httptrace | 显示HTTP跟踪信息(默认情况下,最近100个HTTP请求-响应)。需要一个HttpTraceRepository组件。 |
| info | 显示应用程序信息。 |
| integrationgraph | 显示Spring integrationgraph 。需要依赖spring-integration-core。 |
| loggers | 显示和修改应用程序中日志的配置。 |
| liquibase | 显示已应用的所有Liquibase数据库迁移。需要一个或多个Liquibase组件。 |
| metrics | 显示当前应用程序的“指标”信息。 |
| mappings | 显示所有@RequestMapping路径列表。 |
| scheduledtasks | 显示应用程序中的计划任务。 |
| sessions | 允许从Spring Session支持的会话存储中检索和删除用户会话。需要使用Spring Session的基于Servlet的Web应用程序。 |
| shutdown | 使应用程序正常关闭。默认禁用。 |
| startup | 显示由ApplicationStartup收集的启动步骤数据。需要使用SpringApplication进行配置BufferingApplicationStartup。 |
| threaddump | 执行线程转储。 |
如果您的应用程序是 Web 应用程序(SpringMVC、SpringWebFlux 或 Jersey),则可以使用以下附加端点:
| ID | 描述 |
|---|---|
| heapdump | 返回hprof堆转储文件。 |
| jolokia | 通过HTTP暴露JMX bean(需要引入Jolokia,不适用于WebFlux)。需要引入依赖jolokia-core。 |
| logfile | 返回日志文件的内容(如果已设置logging.file.name或logging.file.path属性)。支持使用HTTPRange标头来检索部分日志文件的内容。 |
| prometheus | 以Prometheus服务器可以抓取的格式公开指标。需要依赖micrometer-registry-prometheus。 |
2.2 其中最常用的 Endpoint
- Health:健康监控
- Metrics:运行时指标
- Loggers:日志记录
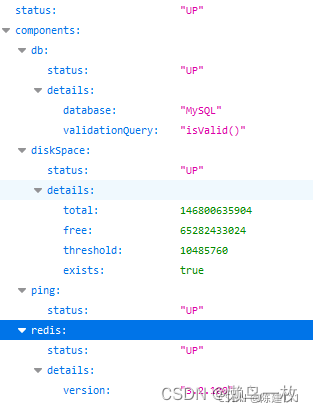
2.2.1 Health Endpoint
健康检查端点,我们一般用于在云平台,平台会定时的检查应用的健康情况,我们就需要 Health Endpoint 为平台返回当前应用的一系列组件监控状况的集合。
重要的几点:
- Health Endpoint 返回的结果,应该是一系列监控检查后的一个汇总报告
- 很多的健康检查已经自动配置好了,比如:数据库、redis 等
- 可以很容易的添加自定义的健康检查机制
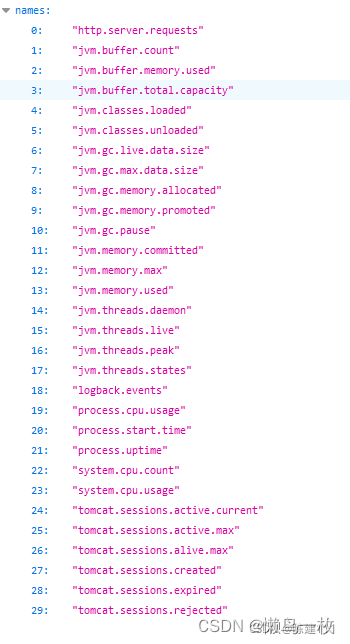
2.2.2 Metrics Endpoint
提供详细的、层级的、空间指标信息,这些信息可以被 pull(主动推送)或push(被动获取)方式得到。
- 通过 Metrics 对接多种监控系统
- 简化核心 Metrics 开发
- 添加自动以 Metrics 或者扩展已有 Metrics。
2.3 开启与禁用 Endpoints
1、默认所有的 Endpoints 除【shutdown 】都是开启的。
2、需要开启或禁用某个 Endpoint。配置模式为 【management.endpoint..enabled = true】
management:
  endpoints:
    enabled-by-default: false
  endpoint:
    beans:
      enabled: true
    health:
      enabled: true
3、或者禁用所有的 Endpoint,然后手动开启指定的 Endpoint。
3.定制 Endpoint
3.1 定制 Health 信息
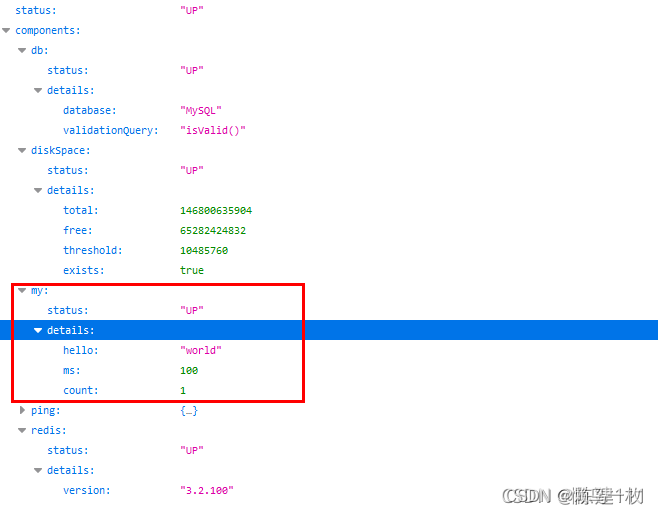
@Component
public class MyHealthIndicator extends AbstractHealthIndicator {

    /**
     * 真实的检查方法
     */
    @Override
    protected void doHealthCheck(Health.Builder builder) throws Exception {
        Map<String,Object> map = new HashMap<>();

        if (true) {
            builder.status(Status.UP);//监控
            map.put("count",1);
            map.put("ms",100);
        } else {
            builder.status(Status.DOWN);//不健康
            map.put("err","连接超时");
            map.put("ms",3000);
        }
        builder.withDetail("hello","world");
        builder.withDetails(map);
    }
}
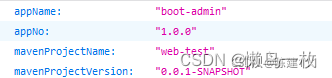
3.2 定制 info 信息
方式一
编写配置文件(前提 可以访问 info Endpoint),然后可以访问 http://localhost:8080/actuator/info 来进行查看
info:
  appName: boot-admin
  appNo: 1.0.0
  mavenProjectName: @project.artifactId@ #获取 pom 文件 artifactId 属性内容
  mavenProjectVersion: @project.version@ #获取 pom 文件 version 内容
方式二
编写 InfoContributor
@Component
public class ExampleInfoContributor implements InfoContributor {
    @Override
    public void contribute(Info.Builder builder) {
        builder.withDetail("msg", "你好")
                .withDetail("hello","world")
                .withDetails(Collections.singletonMap("key","value"));
    }
}

3.3 定制 Metrics 信息
3.3.1 SpringBoot 支持自动适配的 Metrics
- 1、jvm metrics ,报告资源利用率:
各种内存和缓存池
有关垃圾收集的统计
线程利用率
加载/卸载的类数
-
2、CPU metrics
-
3、文件描述符 metrics
-
4、Kafka 消费者和生产者 metrics
-
5、Log4j2 metrics :记录每个级别记录到 Log4j2 的事件数
-
6、Logback metrics:记录每个级别记录到 Logback 的事件数
-
7、正常运行期间 metrics:报告正常运行时间的指标和表示应用程序绝对启动时间的固定指标
-
8、Tomcat metrics :server.Tomcat.mbeanregistry.enabled必须设置为true才能注册所有 Tomcat metrics。
-
9、Spring 集成 metrics。
3.3.2 增加定制 metrics
方式一
-
可以在我们 Service 的实现类里面增加某些定制的参数,例如我们之前使用到的 AccountServiceImpl 。
-
构造器函数传入 MeterRegistry 类型对象,用于获取定制的 Metrics 的对象
在调用需要统计的函数时,调用对象的 相关方法。
@Service
public class AccountServiceImpl extends ServiceImpl<AccountMapper, Account> implements AccountService {
Counter counter;
public AccountServiceImpl(MeterRegistry meterRegistry) {
super();
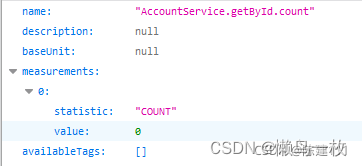
counter = meterRegistry.counter("AccountService.getById.count");//获取技术对象
}
@Override
public Account getById(Serializable id) {
counter.increment(); //每次调用就+1
return this.baseMapper.selectById(id);
}
}
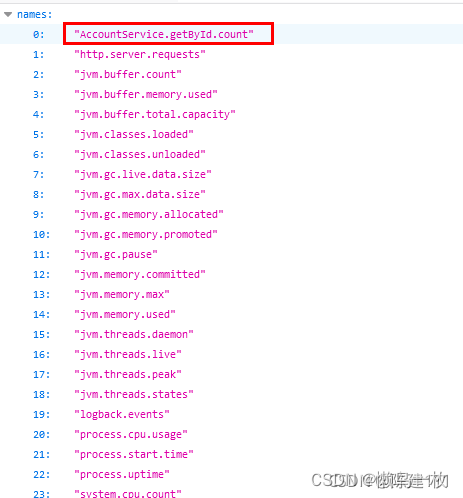
每次调用 getById 方法后,下图的 value 都会增加1
方式二
@Configuration
public class CustomMetricsConfig {
    @Bean
    MeterBinder queueSize(Queue queue){
        return registry-> Gauge.builder("queueSize", queue::size).register(registry);
    }

    @Bean
    MeterRegistryCustomizer<MeterRegistry> configurer(@Value("${info.appName}") String appName) {
        return registry -> registry.config().commonTags("appName", appName);
    }
}
3.4 定制 Endpoint
@Component
@Endpoint(id = "myEndpoint")
public class MyEndpoint {
    @ReadOperation
    public Map getDockerInfo() {
        //端点的读操作
        return Collections.singletonMap("dockerInfo","docker started ...");
    }

    @WriteOperation
    public void stopDocker() {
        System.out.println("docker stopped");
    }
}
- 开发 ReadinessEndpoint 来管理程序是否就绪。
- 开发 LivenessEndpoint 来管理程序是否存活。
4.可视化
官方指南:Spring Boot Admin Reference Guide
4.1 新建一个SpringBoot 工程,作为可视化服务端
POM 依赖
        <dependency>
            <groupId>de.codecentric</groupId>
            <artifactId>spring-boot-admin-starter-server</artifactId>
            <version>2.3.1</version>
        </dependency>
        <dependency>
            <groupId>org.springframework.boot</groupId>
            <artifactId>spring-boot-starter-web</artifactId>
        </dependency>
启动类
@EnableAdminServer
@SpringBootApplication
public class Boot05AdminserverApplication {

    public static void main(String[] args) {
        SpringApplication.run(Boot05AdminserverApplication.class, args);
    }

}
application.yml 配置文件
server:
    port: 8888
4.2 在应用程序中建立客户端
POM 依赖
        <dependency>
            <groupId>de.codecentric</groupId>
            <artifactId>spring-boot-admin-starter-client</artifactId>
            <version>2.3.1</version>
        </dependency>
        <!--应用中配置了 SecurityPermitAllConfig  时需要导入此依赖-->
        <dependency>
            <groupId>org.springframework.boot</groupId>
            <artifactId>spring-boot-starter-security</artifactId>
        </dependency>
application.yml
spring:
  boot:
    admin:
      client:
        url: http://localhost:8888
        instance:
          prefer-ip: true #使用 IP 地址注册进来

management:
  endpoints:
    enabled-by-default: true #暴露所有端点信息
    web:
      exposure:
        include: '*' #以 web 方式暴露所有端点
当 pom 文件引用 spring-boot-starter-security 依赖时,需要此类
/**
 * 当 pom 文件引用 spring-boot-starter-security 依赖时,需要此类
 */
@Configuration
public class SecurityPermitAllConfig extends WebSecurityConfigurerAdapter {
    @Override
    protected void configure(HttpSecurity http) throws Exception {
        http.authorizeRequests().anyRequest().permitAll()
                .and().csrf().disable();
    }
}
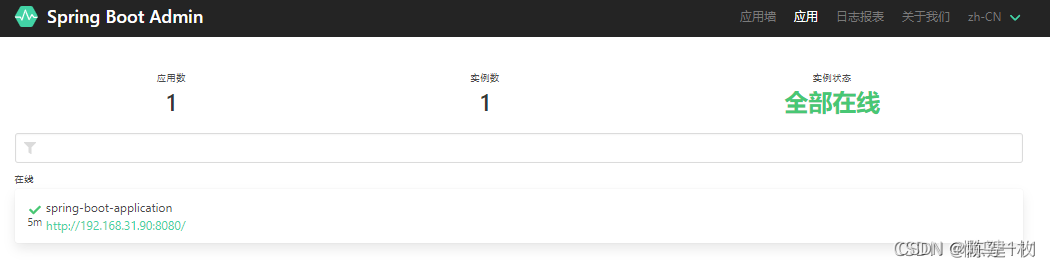
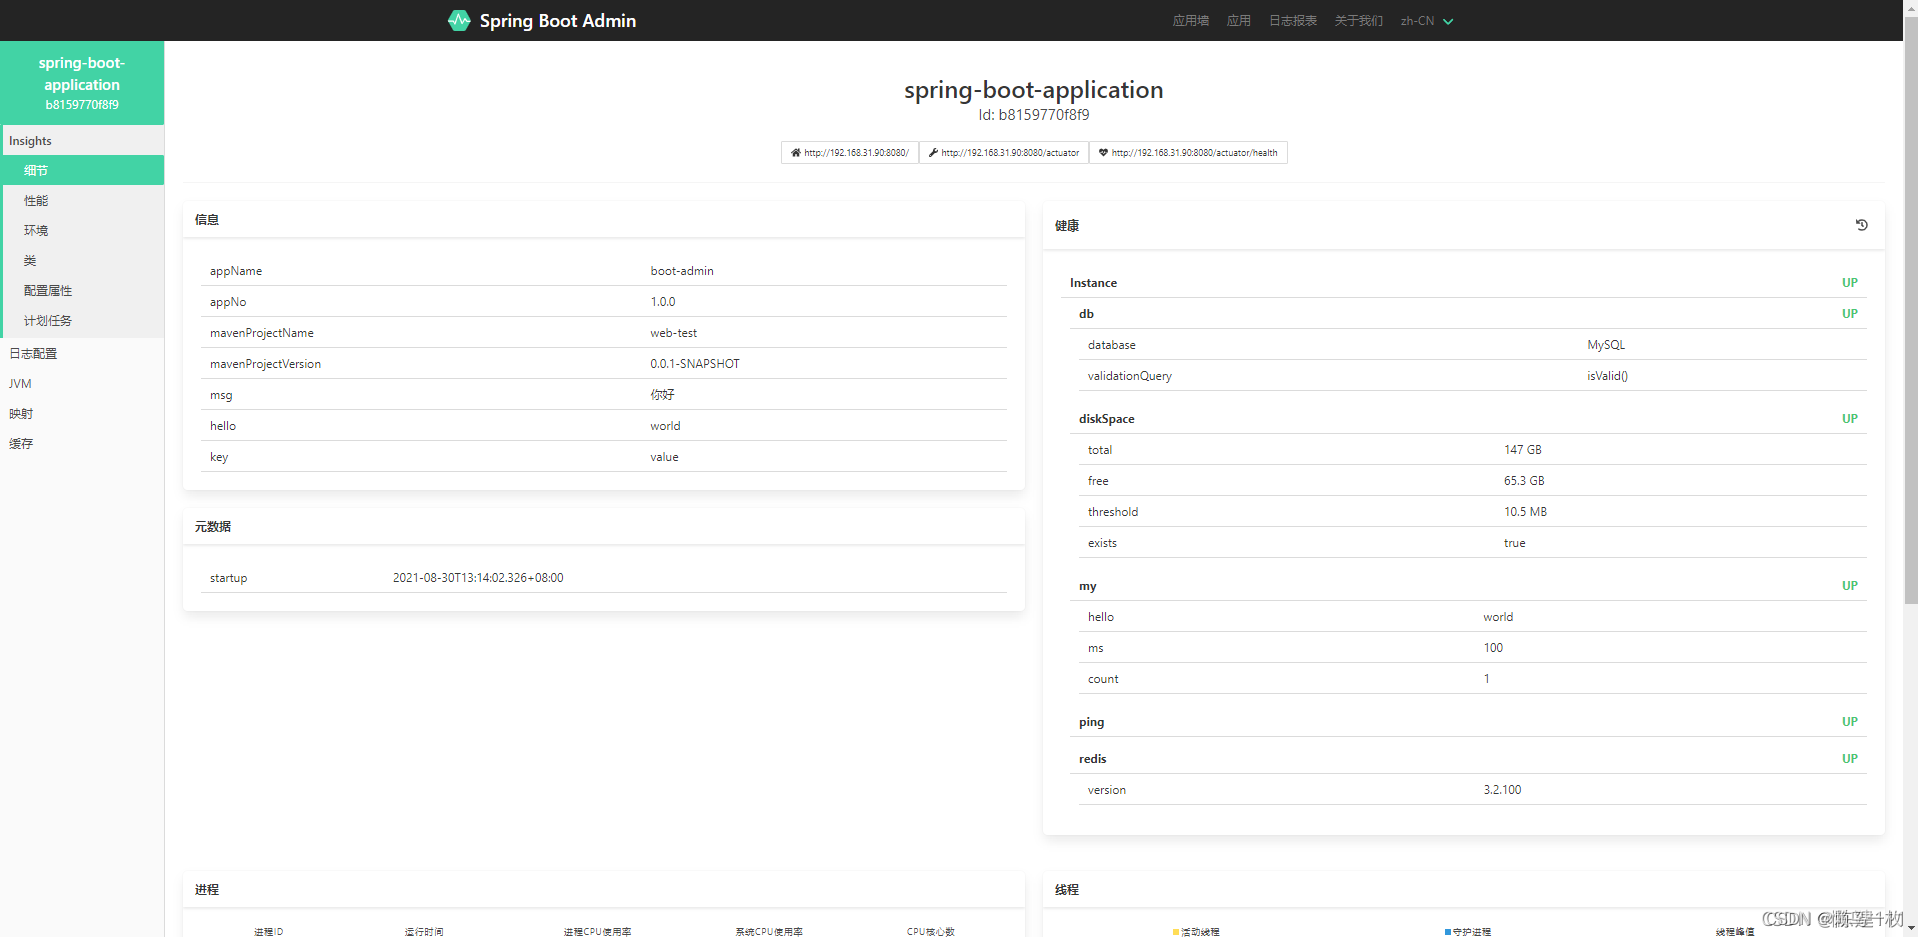
4.3 界面


 552
552


 被折叠的 条评论
为什么被折叠?
被折叠的 条评论
为什么被折叠?
 到【灌水乐园】发言


