


方式一、FileBeat+logstash 7.5.1(docker)+ES(docker)+springboot 日志文件 应用方式
我们采用ELFK 架构采集日志,直接读取日志生成的文件,不对Springboot的日志任何的修改。也就是FileBeat 通过读取日志文件位置获取日志内容,然后发送至logstash,logstash收到日志后再发送至ES,这种方式
1.fileBeat 配置文件
###################### Filebeat Configuration Example #########################
# This file is an example configuration file highlighting only the most common
# options. The filebeat.reference.yml file from the same directory contains all the
# supported options with more comments. You can use it as a reference.
#
# You can find the full configuration reference here:
# https://www.elastic.co/guide/en/beats/filebeat/index.html
# For more available modules and options, please see the filebeat.reference.yml sample
# configuration file.
# ============================== Filebeat inputs ===============================
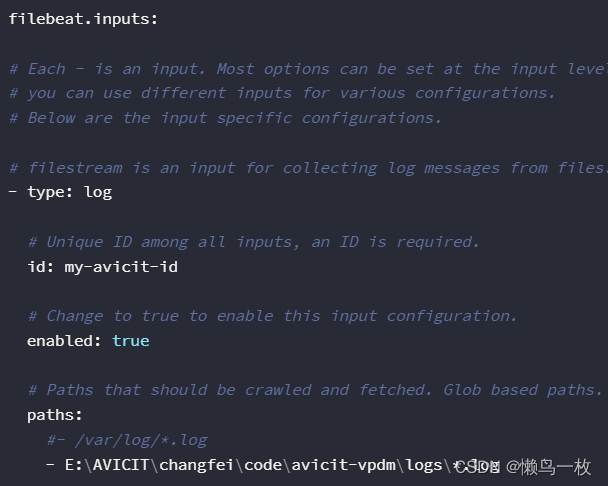
filebeat.inputs:
# Each - is an input. Most options can be set at the input level, so
# you can use different inputs for various configurations.
# Below are the input specific configurations.
# filestream is an input for collecting log messages from files.
- type: log
# Unique ID among all inputs, an ID is required.
id: my-avicit-id
# Change to true to enable this input configuration.
enabled: true
# Paths that should be crawled and fetched. Glob based paths.
paths:
#- /var/log/*.log
- E:\AVICIT\changfei\code\avicit-vpdm\logs\*.log
# Exclude lines. A list of regular expressions to match. It drops the lines that are
# matching any regular expression from the list.
# Line filtering happens after the parsers pipeline. If you would like to filter lines
# before parsers, use include_message parser.
#exclude_lines: ['^DBG']
# Include lines. A list of regular expressions to match. It exports the lines that are
# matching any regular expression from the list.
# Line filtering happens after the parsers pipeline. If you would like to filter lines
# before parsers, use include_message parser.
#include_lines: ['^ERR', '^WARN']
# Exclude files. A list of regular expressions to match. Filebeat drops the files that
# are matching any regular expression from the list. By default, no files are dropped.
#prospector.scanner.exclude_files: ['.gz$']
# Optional additional fields. These fields can be freely picked
# to add additional information to the crawled log files for filtering
#fields:
# level: debug
# review: 1
# ============================== Filebeat modules ==============================
filebeat.config.modules:
# Glob pattern for configuration loading
path: ${path.config}/modules.d/*.yml
# Set to true to enable config reloading
reload.enabled: false
# Period on which files under path should be checked for changes
#reload.period: 10s
# ======================= Elasticsearch template setting =======================
setup.template.settings:
index.number_of_shards: 1
#index.codec: best_compression
#_source.enabled: false
# ================================== General ===================================
# The name of the shipper that publishes the network data. It can be used to group
# all the transactions sent by a single shipper in the web interface.
#name:
# The tags of the shipper are included in their own field with each
# transaction published.
#tags: ["service-X", "web-tier"]
# Optional fields that you can specify to add additional information to the
# output.
#fields:
# env: staging
# ================================= Dashboards =================================
# These settings control loading the sample dashboards to the Kibana index. Loading
# the dashboards is disabled by default and can be enabled either by setting the
# options here or by using the `setup` command.
#setup.dashboards.enabled: false
# The URL from where to download the dashboards archive. By default this URL
# has a value which is computed based on the Beat name and version. For released
# versions, this URL points to the dashboard archive on the artifacts.elastic.co
# website.
#setup.dashboards.url:
# =================================== Kibana ===================================
# Starting with Beats version 6.0.0, the dashboards are loaded via the Kibana API.
# This requires a Kibana endpoint configuration.
setup.kibana:
# Kibana Host
# Scheme and port can be left out and will be set to the default (http and 5601)
# In case you specify and additional path, the scheme is required: http://localhost:5601/path
# IPv6 addresses should always be defined as: https://[2001:db8::1]:5601
#host: "localhost:5601"
# Kibana Space ID
# ID of the Kibana Space into which the dashboards should be loaded. By default,
# the Default Space will be used.
#space.id:
# =============================== Elastic Cloud ================================
# These settings simplify using Filebeat with the Elastic Cloud (https://cloud.elastic.co/).
# The cloud.id setting overwrites the `output.elasticsearch.hosts` and
# `setup.kibana.host` options.
# You can find the `cloud.id` in the Elastic Cloud web UI.
#cloud.id:
# The cloud.auth setting overwrites the `output.elasticsearch.username` and
# `output.elasticsearch.password` settings. The format is `<user>:<pass>`.
#cloud.auth:
# ================================== Outputs ===================================
# Configure what output to use when sending the data collected by the beat.
# ---------------------------- Elasticsearch Output ----------------------------
#output.elasticsearch:
# Array of hosts to connect to.
#hosts: ["172.17.4.55:9200"]
# Protocol - either `http` (default) or `https`.
#protocol: "https"
# Authentication credentials - either API key or username/password.
#api_key: "id:api_key"
#username: "elastic"
#password: "changeme"
# ------------------------------ Logstash Output -------------------------------
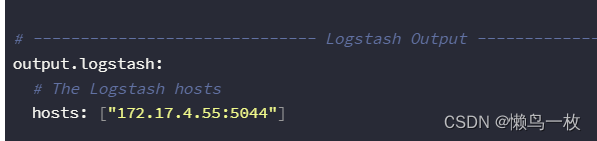
output.logstash:
# The Logstash hosts
hosts: ["172.17.4.55:5044"]
# Optional SSL. By default is off.
# List of root certificates for HTTPS server verifications
#ssl.certificate_authorities: ["/etc/pki/root/ca.pem"]
# Certificate for SSL client authentication
#ssl.certificate: "/etc/pki/client/cert.pem"
# Client Certificate Key
#ssl.key: "/etc/pki/client/cert.key"
# ================================= Processors =================================
processors:
- add_host_metadata:
when.not.contains.tags: forwarded
- add_cloud_metadata: ~
- add_docker_metadata: ~
- add_kubernetes_metadata: ~
# ================================== Logging ===================================
# Sets log level. The default log level is info.
# Available log levels are: error, warning, info, debug
#logging.level: debug
# At debug level, you can selectively enable logging only for some components.
# To enable all selectors use ["*"]. Examples of other selectors are "beat",
# "publisher", "service".
#logging.selectors: ["*"]
# ============================= X-Pack Monitoring ==============================
# Filebeat can export internal metrics to a central Elasticsearch monitoring
# cluster. This requires xpack monitoring to be enabled in Elasticsearch. The
# reporting is disabled by default.
# Set to true to enable the monitoring reporter.
#monitoring.enabled: false
# Sets the UUID of the Elasticsearch cluster under which monitoring data for this
# Filebeat instance will appear in the Stack Monitoring UI. If output.elasticsearch
# is enabled, the UUID is derived from the Elasticsearch cluster referenced by output.elasticsearch.
#monitoring.cluster_uuid:
# Uncomment to send the metrics to Elasticsearch. Most settings from the
# Elasticsearch output are accepted here as well.
# Note that the settings should point to your Elasticsearch *monitoring* cluster.
# Any setting that is not set is automatically inherited from the Elasticsearch
# output configuration, so if you have the Elasticsearch output configured such
# that it is pointing to your Elasticsearch monitoring cluster, you can simply
# uncomment the following line.
#monitoring.elasticsearch:
# ============================== Instrumentation ===============================
# Instrumentation support for the filebeat.
#instrumentation:
# Set to true to enable instrumentation of filebeat.
#enabled: false
# Environment in which filebeat is running on (eg: staging, production, etc.)
#environment: ""
# APM Server hosts to report instrumentation results to.
#hosts:
# - http://localhost:8200
# API Key for the APM Server(s).
# If api_key is set then secret_token will be ignored.
#api_key:
# Secret token for the APM Server(s).
#secret_token:
# ================================= Migration ==================================
# This allows to enable 6.7 migration aliases
#migration.6_to_7.enabled: true
重点是配置这两个地方
2.logstash 配置文件
input {
beats {
        port => 5044
        host => "172.17.4.55"
   }
}
output {
  elasticsearch {
     hosts => ["http://172.17.4.55:9200"]
     index => "logstash-%{+YYYY.MM.dd}"
     user =>"elastic"
     password =>"elastic"
     #document_id => "%{id}"
   }
  stdout { codec => rubydebug }
}
3. 控制台输出日志
我们先启动fileBeat,由于是在项目是本地启动的所以安装的是windows 下的fileBeat ,
1.先启动本地fileBeat
.\filebeat -e -c filebeat.yml
pause
2.在启动容器中的logbash
docker run -p 5044:5044 -it -v /var/lib/docker/volumes/logstash/config:/usr/share/logstash/config --name logstash logstash:7.5.1
在启动filebeat和logstash 后,可以看到会自动读取已经存在的springboot日志并输出到ogstash 中。在Springboot 启动后会自动实时刷新输出springboot更新的日志到控制台

用logstash 7.5.1(docker) 这种方式测试发现需要配合FileBeat才能接收到日志到logstash 中,但是日志无法通过logstash 7.5.1(docker) 发送到ES中。所以可以采用方式二
方式二、logstash7.0.1 +ES(docker)+springboot
1 Springboot 日志端口方法方式
日志配置
<?xml version="1.0" encoding="UTF-8"?>
<configuration scan="true" scanPeriod="2 seconds">
<timestamp key="TIMESTAMP" datePattern="yyyy-MM-dd"/>
<springProperty scope="context" name="application.name" source="spring.application.name" defaultValue="xxxxx"/>
<property name="LOGPATH" value="log"/>
<!-- 读取SpringBoot配置文件获取logstash的地址和端口 -->
<springProperty scope="context" name="logstash-host" source="log.logstash-host"/>
<appender name="console" class="ch.qos.logback.core.ConsoleAppender">
<encoder>
<pattern>%d{HH:mm:ss.SSS} [%thread] [traceId=%X{traceId} spanId=%X{spanId}] %-5level %logger{100} - %msg%n
</pattern>
</encoder>
</appender>
<appender name="rollingFile" class="ch.qos.logback.core.rolling.RollingFileAppender">
…………………………
</appender>
<!-- <appender name="AsyncAppender" class="ch.qos.logback.classic.AsyncAppender">
……………………
</appender>
<appender name="errorFile" class="ch.qos.logback.core.rolling.RollingFileAppender">
……………………
</appender>
<!--输出到logstash的appender-->
<appender name="LOGSTASH" class="net.logstash.logback.appender.LogstashTcpSocketAppender">
<!-- <!–可以访问的logstash日志收集端口–>-->
<destination>172.17.4.55:5044</destination>
<encoder charset="UTF-8" class="net.logstash.logback.encoder.LogstashEncoder"/>
</appender>
<!-- project default level -->
<logger name="xxxxx" level="info"/>
<root level="info">
<appender-ref ref="console"/>
<appender-ref ref="rollingFile"/>
<!-- <appender-ref ref="AsyncAppender"/>-->
<appender-ref ref="errorFile"/>
<appender-ref ref="LOGSTASH"/>
</root>
</configuration>
日志里面需要配置日志的输出地址和日志格式 ,也就LOGSTASH的appender和logstash-host 的
2 logstash 的logstash.conf配置文件
在测试的时候可以先把Springboot 接收的日志打印在logstash中输出,如果测试没有问题再输出到ES
2.1 先输出到控在logstash中输出 配置
创建 springbootlog_logstash.conf 配置文件
input {
  #file {
  #  path => "/home/test/logstash/ml-25m/movies.csv"
  #  start_position => "beginning"
  #  sincedb_path => "/dev/null"
  #}
  tcp {
        port => 5044
        host => "172.17.4.55"
        }
}
output {
   #elasticsearch {
   #  hosts => "http://172.17.4.55:9200"
   #  index => "movies"
   #  document_id => "%{id}"
   # }

   stdout{
        codec => rubydebug
        }
  }
启动
../bin/logstash -f ./springbootlog_logstash.conf
输出

启动
控制台输出没有问题再改springbootlog_logstash.conf
input {
  #file {
  #  path => "/home/test/logstash/ml-25m/movies.csv"
  #  start_position => "beginning"
  #  sincedb_path => "/dev/null"
  #}
  tcp {
        port => 5044
        host => "172.17.4.55"
        }
}
output {
   elasticsearch {
     hosts => "http://172.17.4.55:9200"
     index => "avicit-vpdm-%{+yyyy-MM-dd}.log"
     # document_id => "%{id}"
    }

  # stdout{
  #     codec => rubydebug
  #     }
  }
重新启动后,由于我们把在logstash在控制台输出的注释掉了,所以没有在控制台打印。我们在es中查看输出,可以看到成功输出到ES,并建立日志索引
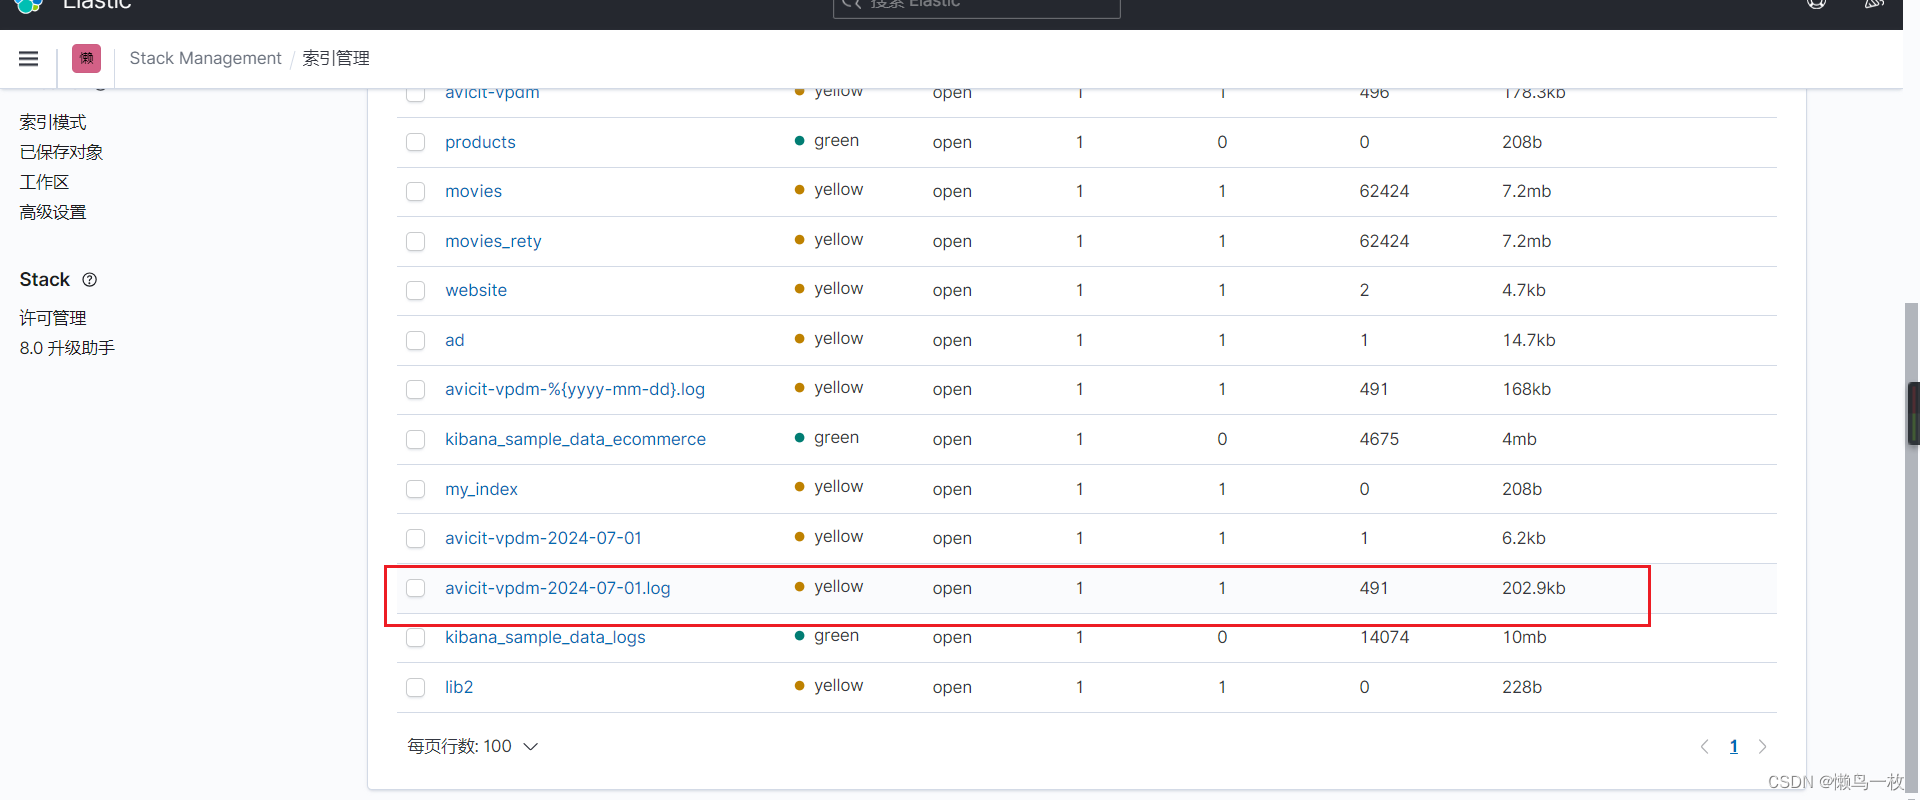
2.2 ES 建立索引

在索引查看界面中就可以看到我们建立的索引了。


 1万+
1万+


 被折叠的 条评论
为什么被折叠?
被折叠的 条评论
为什么被折叠?
 到【灌水乐园】发言


