


前言:
sleepgraph是pm-graph工具中的一个,pm-gragph(https://01.org/zh/pm-graph?langredirect=1)提供了bootgraph和sleepgraph,帮助OS developer分析boot和suspend/resume过程,找到影响系统启动或休眠效率的瓶颈。
sleepgraph会发起一个suspend/resume操作,获取ftrace和dmesg信息,转换成timeline图形格式,还可以提供callgraph调用关系,帮助开发人员快速了解在system suspend/resume过程中,哪个phase?哪个device?哪个callback耗时最长。测试结果以dmesg.txt、ftrace.txt和.html的形式展现。
一. 工具源码所在目录
tools/power
二. 内核配置项
编译内核时候需要将确保以下配置项打开
CONFIG_DEVMEM=y
CONFIG_PM_SLEEP_DEBUG=y
CONFIG_FTRACE=y
CONFIG_FUNCTION_TRACER=y
CONFIG_FUNCTION_GRAPH_TRACER=y
CONFIG_KPROBES=y
CONFIG_KPROBES_ON_FTRACE=y
三. pm-graph工具安装
1. 通过内核中的工具源码安装
-
将内核源码拷贝到目标机上
-
进入到目录
tools/power目录下进行编译make -j$(nproc --all) -
的
pm-graph目录中进行安装sudo make install
2. 通过github上的pm-graph源码直接按照
-
优点: 可以免去拷贝整个源码目录的麻烦
-
克隆
github上源码到目标机并编译安装测试git clone http://github.com/intel/pm-graph.git cd pm-graph sudo make install man sleepgraph ; man bootgraph
四. 使用
1. 系统配置
根据README文件中描述,需要在grub.cfg文件中进行配置:
GRUB_CMDLINE_LINUX_DEFAULT="... initcall_debug log_buf_len=32M ..."
2. 可以参考README文件进行简单测试验证
sudo ./sleepgraph.py -m mem -rtcwake 15

3. 使用配置文件进行suspend测试
-
使用工具中自带的配置文件进行测试
sudo sleepgraph -config config/suspend-callgraph.cfg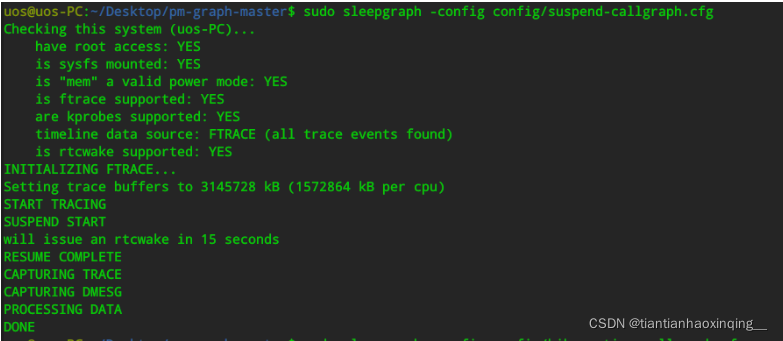
因为配置文件中已经有生成log的配置,此时会在生成对应的测试log
-
打开对应的
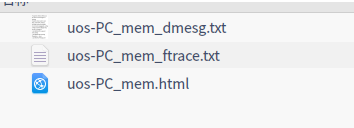
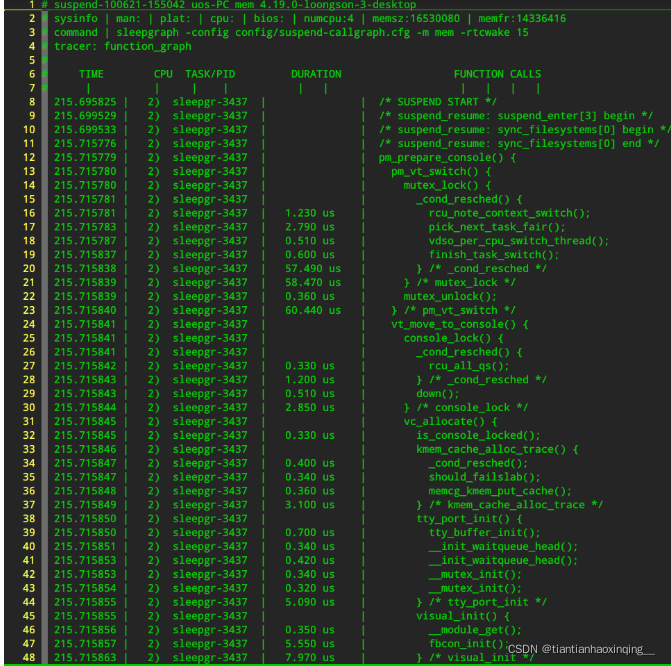
html文件后可以看到对应的调用call Trace和suspend过程中每一项所执行的时间

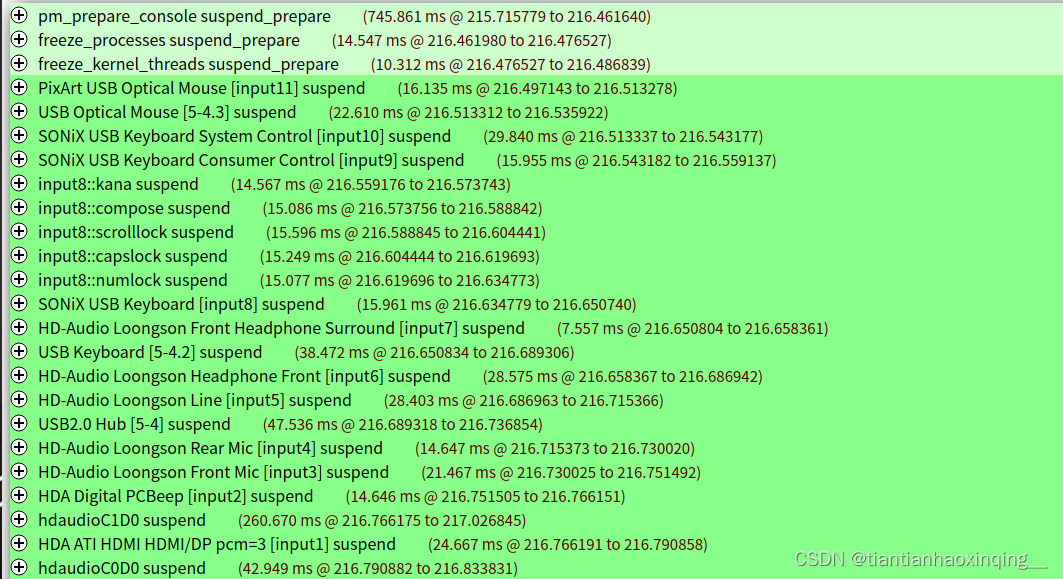
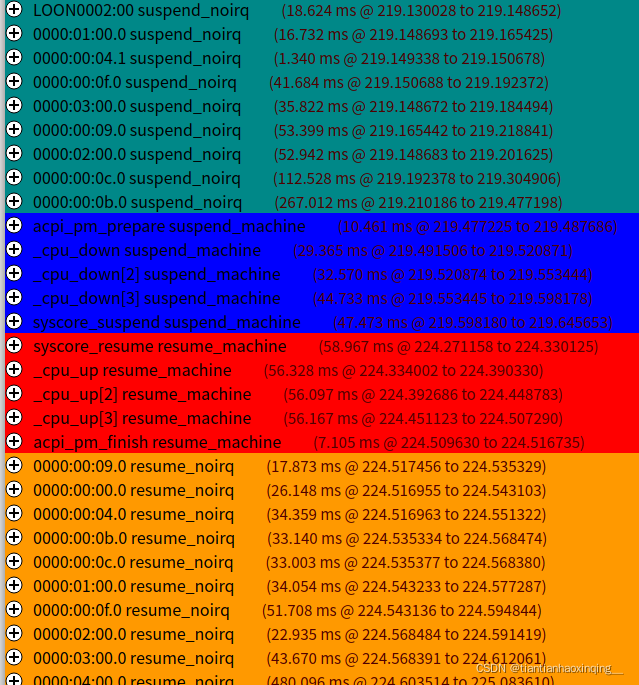
-
uos-PC_mem_ftrace.txt文件中记录的是文字版的函数调用
# suspend-100621-155042 uos-PC mem 4.19.0-loongson-3-desktop
# sysinfo | man: | plat: | cpu: | bios: | numcpu:4 | memsz:16530080 | memfr:14336416
# command | sleepgraph -config config/suspend-callgraph.cfg -m mem -rtcwake 15
# tracer: function_graph
#
#     TIME        CPU  TASK/PID         DURATION                  FUNCTION CALLS
#      |          |     |    |           |   |                     |   |   |   |
  215.695825 |   2)  sleepgr-3437  |               |  /* SUSPEND START */
  215.699529 |   2)  sleepgr-3437  |               |  /* suspend_resume: suspend_enter[3] begin */
  215.699533 |   2)  sleepgr-3437  |               |  /* suspend_resume: sync_filesystems[0] begin */
  215.715776 |   2)  sleepgr-3437  |               |  /* suspend_resume: sync_filesystems[0] end */
  215.715779 |   2)  sleepgr-3437  |               |  pm_prepare_console() {
  215.715780 |   2)  sleepgr-3437  |               |    pm_vt_switch() {
  215.715780 |   2)  sleepgr-3437  |               |      mutex_lock() {
  215.715781 |   2)  sleepgr-3437  |               |        _cond_resched() {
  215.715781 |   2)  sleepgr-3437  |   1.230 us    |          rcu_note_context_switch();
  215.715783 |   2)  sleepgr-3437  |   2.790 us    |          pick_next_task_fair();
  215.715787 |   2)  sleepgr-3437  |   0.510 us    |          vdso_per_cpu_switch_thread();
  215.715837 |   2)  sleepgr-3437  |   0.600 us    |          finish_task_switch();
  215.715838 |   2)  sleepgr-3437  |   57.490 us   |        } /* _cond_resched */
  215.715839 |   2)  sleepgr-3437  |   58.470 us   |      } /* mutex_lock */
  215.715839 |   2)  sleepgr-3437  |   0.360 us    |      mutex_unlock();
  215.715840 |   2)  sleepgr-3437  |   60.440 us   |    } /* pm_vt_switch */
  215.715841 |   2)  sleepgr-3437  |               |    vt_move_to_console() {
  215.715841 |   2)  sleepgr-3437  |               |      console_lock() {
  215.715841 |   2)  sleepgr-3437  |               |        _cond_resched() {
  215.715842 |   2)  sleepgr-3437  |   0.330 us    |          rcu_all_qs();
  215.715843 |   2)  sleepgr-3437  |   1.200 us    |        } /* _cond_resched */
  215.715843 |   2)  sleepgr-3437  |   0.510 us    |        down();
  215.715844 |   2)  sleepgr-3437  |   2.850 us    |      } /* console_lock */
  215.715845 |   2)  sleepgr-3437  |               |      vc_allocate() {
  215.715845 |   2)  sleepgr-3437  |   0.330 us    |        is_console_locked();
  215.715846 |   2)  sleepgr-3437  |               |        kmem_cache_alloc_trace() {
  215.715847 |   2)  sleepgr-3437  |   0.400 us    |          _cond_resched();
  215.715847 |   2)  sleepgr-3437  |   0.340 us    |          should_failslab();
  215.715848 |   2)  sleepgr-3437  |   0.360 us    |          memcg_kmem_put_cache();
  215.715849 |   2)  sleepgr-3437  |   3.100 us    |        } /* kmem_cache_alloc_trace */
  215.715850 |   2)  sleepgr-3437  |               |        tty_port_init() {
  215.715850 |   2)  sleepgr-3437  |   0.700 us    |          tty_buffer_init();
  215.715851 |   2)  sleepgr-3437  |   0.340 us    |          __init_waitqueue_head();
  215.715853 |   2)  sleepgr-3437  |   0.420 us    |          __init_waitqueue_head();
  215.715853 |   2)  sleepgr-3437  |   0.340 us    |          __mutex_init();
  215.715854 |   2)  sleepgr-3437  |   0.320 us    |          __mutex_init();
  215.715855 |   2)  sleepgr-3437  |   5.090 us    |        } /* tty_port_init */
  215.715855 |   2)  sleepgr-3437  |               |        visual_init() {
  215.715856 |   2)  sleepgr-3437  |   0.350 us    |          __module_get();
  215.715857 |   2)  sleepgr-3437  |   5.550 us    |          fbcon_init();
  215.715863 |   2)  sleepgr-3437  |   7.970 us    |        } /* visual_init */
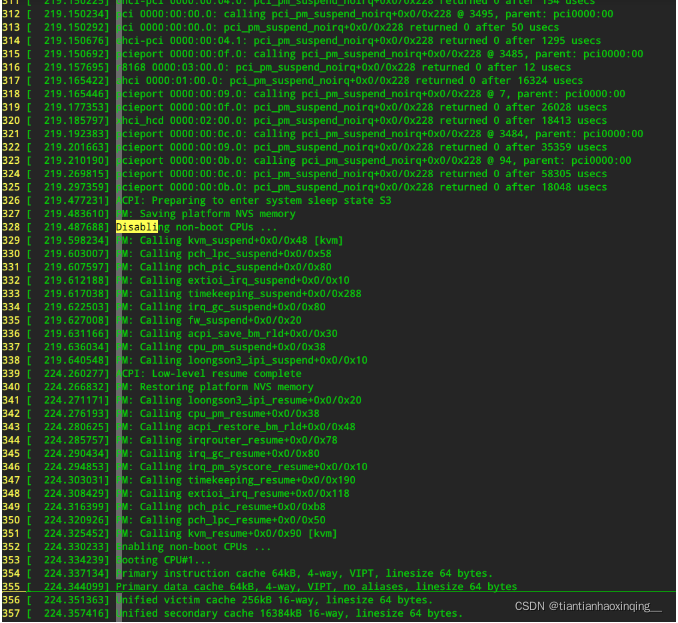
4. uos-PC_mem_dmesg.txt文件中是和串口log差不多的log,如果没有连接串口,可以参考这个log文件
4. pm-pragh这个工具优点在于方便内核开发者和其他Linux开发者对于内核整体或者某个模块的挂起以及启动时间和流程的跟踪调试.


 3536
3536


 被折叠的 条评论
为什么被折叠?
被折叠的 条评论
为什么被折叠?
 到【灌水乐园】发言


