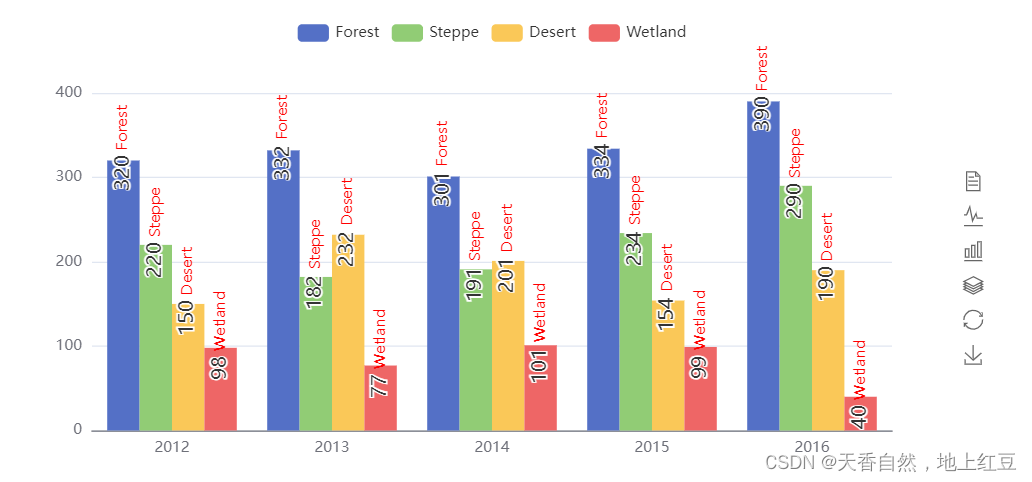
js使用echarts图表的柱状图的使用

效果图:

代码:

<!DOCTYPE html>
<html>
<head>
    <title>Bar Chart with Custom Label</title>
    <script src="https://cdn.jsdelivr.net/npm/echarts@5.2.2/dist/echarts.min.js"></script>
</head>
<body>
    <div id="main" style="width: 800px; height: 400px;"></div>
    <script>
        var myChart = echarts.init(document.getElementById('main'));

        var app = {
            config: {
                position: 'top',
                distance: 10,
                align: 'center',
                verticalAlign: 'middle',
                rotate: 90
            },
            init: function() {
                this.createChart();
            },
            createChart: function() {
                const labelOption = {
                    show: true,
                    position: app.config.position,
                    distance: app.config.distance,
                    align: app.config.align,
                    verticalAlign: app.config.verticalAlign,
                    rotate: app.config.rotate,
                    formatter: '{c} {name|{a}}',
                    fontSize: 16,
                    rich: {
                        name: {
                            lineHeight: 30,
                            color: 'red'
                        }
                    }
                };

                var option = {
                    tooltip: {
                        trigger: 'axis',
                        axisPointer: {
                            type: 'shadow'
                        }
                    },
                    legend: {
                        data: ['Forest', 'Steppe', 'Desert', 'Wetland']
                    },
                    toolbox: {
                        show: true,
                        orient: 'vertical',
                        left: 'right',
                        top: 'center',
                        feature: {
                            mark: { show: true },
                            dataView: { show: true, readOnly: false },
                            magicType: { show: true, type: ['line', 'bar', 'stack'] },
                            restore: { show: true },
                            saveAsImage: { show: true }
                        }
                    },
                    xAxis: [{
                        type: 'category',
                        axisTick: { show: false },
                        data: ['2012', '2013', '2014', '2015', '2016']
                    }],
                    yAxis: [{
                        type: 'value'
                    }],
                    series: [
                        {
                            name: 'Forest',
                            type: 'bar',
                            barGap: 0,
                            label: labelOption,
                            emphasis: { focus: 'series' },
                            data: [320, 332, 301, 334, 390]
                        },
                        {
                            name: 'Steppe',
                            type: 'bar',
                            label: labelOption,
                            emphasis: { focus: 'series' },
                            data: [220, 182, 191, 234, 290]
                        },
                        {
                            name: 'Desert',
                            type: 'bar',
                            label: labelOption,
                            emphasis: { focus: 'series' },
                            data: [150, 232, 201, 154, 190]
                        },
                        {
                            name: 'Wetland',
                            type: 'bar',
                            label: labelOption,
                            emphasis: { focus: 'series' },
                            data: [98, 77, 101, 99, 40]
                        }
                    ]
                };

                option && myChart.setOption(option);
            }
        };

        app.init();
    </script>
</body>
</html>

这是一个基础示例用户可以根据需求进行修改希望可以帮到大家

  • 3
    点赞
  • 0
    收藏
    觉得还不错? 一键收藏
  • 2
    评论

“相关推荐”对你有帮助么?

  • 非常没帮助
  • 没帮助
  • 一般
  • 有帮助
  • 非常有帮助
提交
评论 2
添加红包

请填写红包祝福语或标题

红包个数最小为10个

红包金额最低5元

当前余额3.43前往充值 >
需支付:10.00
成就一亿技术人!
领取后你会自动成为博主和红包主的粉丝 规则
hope_wisdom
发出的红包
实付
使用余额支付
点击重新获取
扫码支付
钱包余额 0

抵扣说明:

1.余额是钱包充值的虚拟货币,按照1:1的比例进行支付金额的抵扣。
2.余额无法直接购买下载,可以购买VIP、付费专栏及课程。

余额充值