


Assessment tasks:
The UK Department of Health and Social Care provides a multitude of medical services to people.The UK government is considering developing a new information system to get faster and better decision-support information. The government has limited experience with information system development, so it engages a consulting company to plan and implement it. You need to take the role of an employee of the consulting company and are in charge of this project. The first business process the government will implement is the hospital admission process. The government looks after many public hospitals with a range of medical officers (MO) within different medical fields (Specialty). Whenever a patient is admitted, a record is created with an admission number (EpisodeNo), date and time, urgency of admission, as well as hospital, patient no., and other patient data. During the stay, all the procedures performed and costs are recorded.When patients are discharged, again the date and time, as well as the status get recorded.
At this stage, the government is providing you with test data only. The spreadsheet will be provided with different worksheets in which data are explained further. Your project consists of a range of tasks, beginning with designing the database, implementing it, creating queries, documenting the design and implementation steps, and answering clients’ questions. You are required to answer each of the following tasks in sequence:
(1) Conceptual Model (15 Marks)
You need to design a conceptual model (ER Model) for the given admission data. The aim is to design the database you will then implement in MySQL, and explain it in brief, including reasoning for your choices of entities. Furthermore, explain the terms master data, transaction data, normalization, referential integrity, primary key in your own words and provide examples from your data.
(2) Implementation (10 Marks)
You need to implement the hospital admission data in MySQL according to the design of your ER Model and document some aspects of the implementation. In this task, you need to provide the following:
• For each data set (table) you create, the method of creation (imported/manually created)
and data entry method (manual or loaded);
The number of records in each table;
• Any assumptions made during the implementation process, as there was no/not enough
specification given;
• Screenshots for all MySQL query definitions in the appendix to the report.
(3) Data Analysis (15 Marks)
You need to set up the database operating environment in Python and then use Python to answer and discuss the following questions:
• Admission count per hospital, by specialty, in a certain period of time;
• Average length of stay by hospital, by class, by medical officer;
• Average cost by hospital, by class, by age, by age group (age groups are 0-16, 17-38,
39-60, 61 and above);
• List of medical officer by hospital, by specialty, including information on attendance
patterns;
• Elective and Emergency (urgency of admission) admission count by hospital, by sex.
• Select any two of the above questions and use Python to virtualize the results.
• Provide screenshots for all Python codes in the appendix to the report.
(4) Client’s additional question one – Information systems technology (15 Marks)
The pandemic poses an enormous challenge to the global health system, and governments
have taken active preventive and control measures. The UK government is exploring any
information technologies to manage the pandemic.
Explain three health information technology-related measures or methods for managing the
outbreak.
(5) Client’s additional question two – Knowledge Graph (15 Marks)
The UK government has spent time developing customized templates that fit the electronic health record format. However, the system remained confusing, inefficient and failed to adequately capture the essence of patients’ illnesses. The client has heard that deploying knowledge graphs in the healthcare services space has proven to be an effective method to map relationships between the enormous variety and structure ofhealthcare data.
Explain the concept of knowledge graph in brief and provide a summary of at least threeadvantages of the use of knowledge graph in healthcare compared to the traditional relational database.
(6) Client’s additional question three – Information Governance and Ethics (20 Marks)
Of all industry sectors, healthcare probably has the most intensive focus on information governance. The client wants you to provide a balanced, yetdiscriminating and critical, review of the topics of information governance and ethics in healthcare. You should consider the following:
• Why information governance and ethics is now a key area for healthcare;
• What information governance and ethics in healthcare is;
• How information governance and ethics can be systematically and effectively
developed in healthcare industry.
You should reference the relevant literature and provide illustrative case examples.
数据处理代码
import pymysql
import numpy as np
import matplotlib.pyplot as plt
# connect to hospitaldata
db = pymysql.connect(
host="localhost",
port=3306,
user='root',
password='admin',
database='hospitaldata',
charset='utf8mb4'
)
cursor = db.cursor()
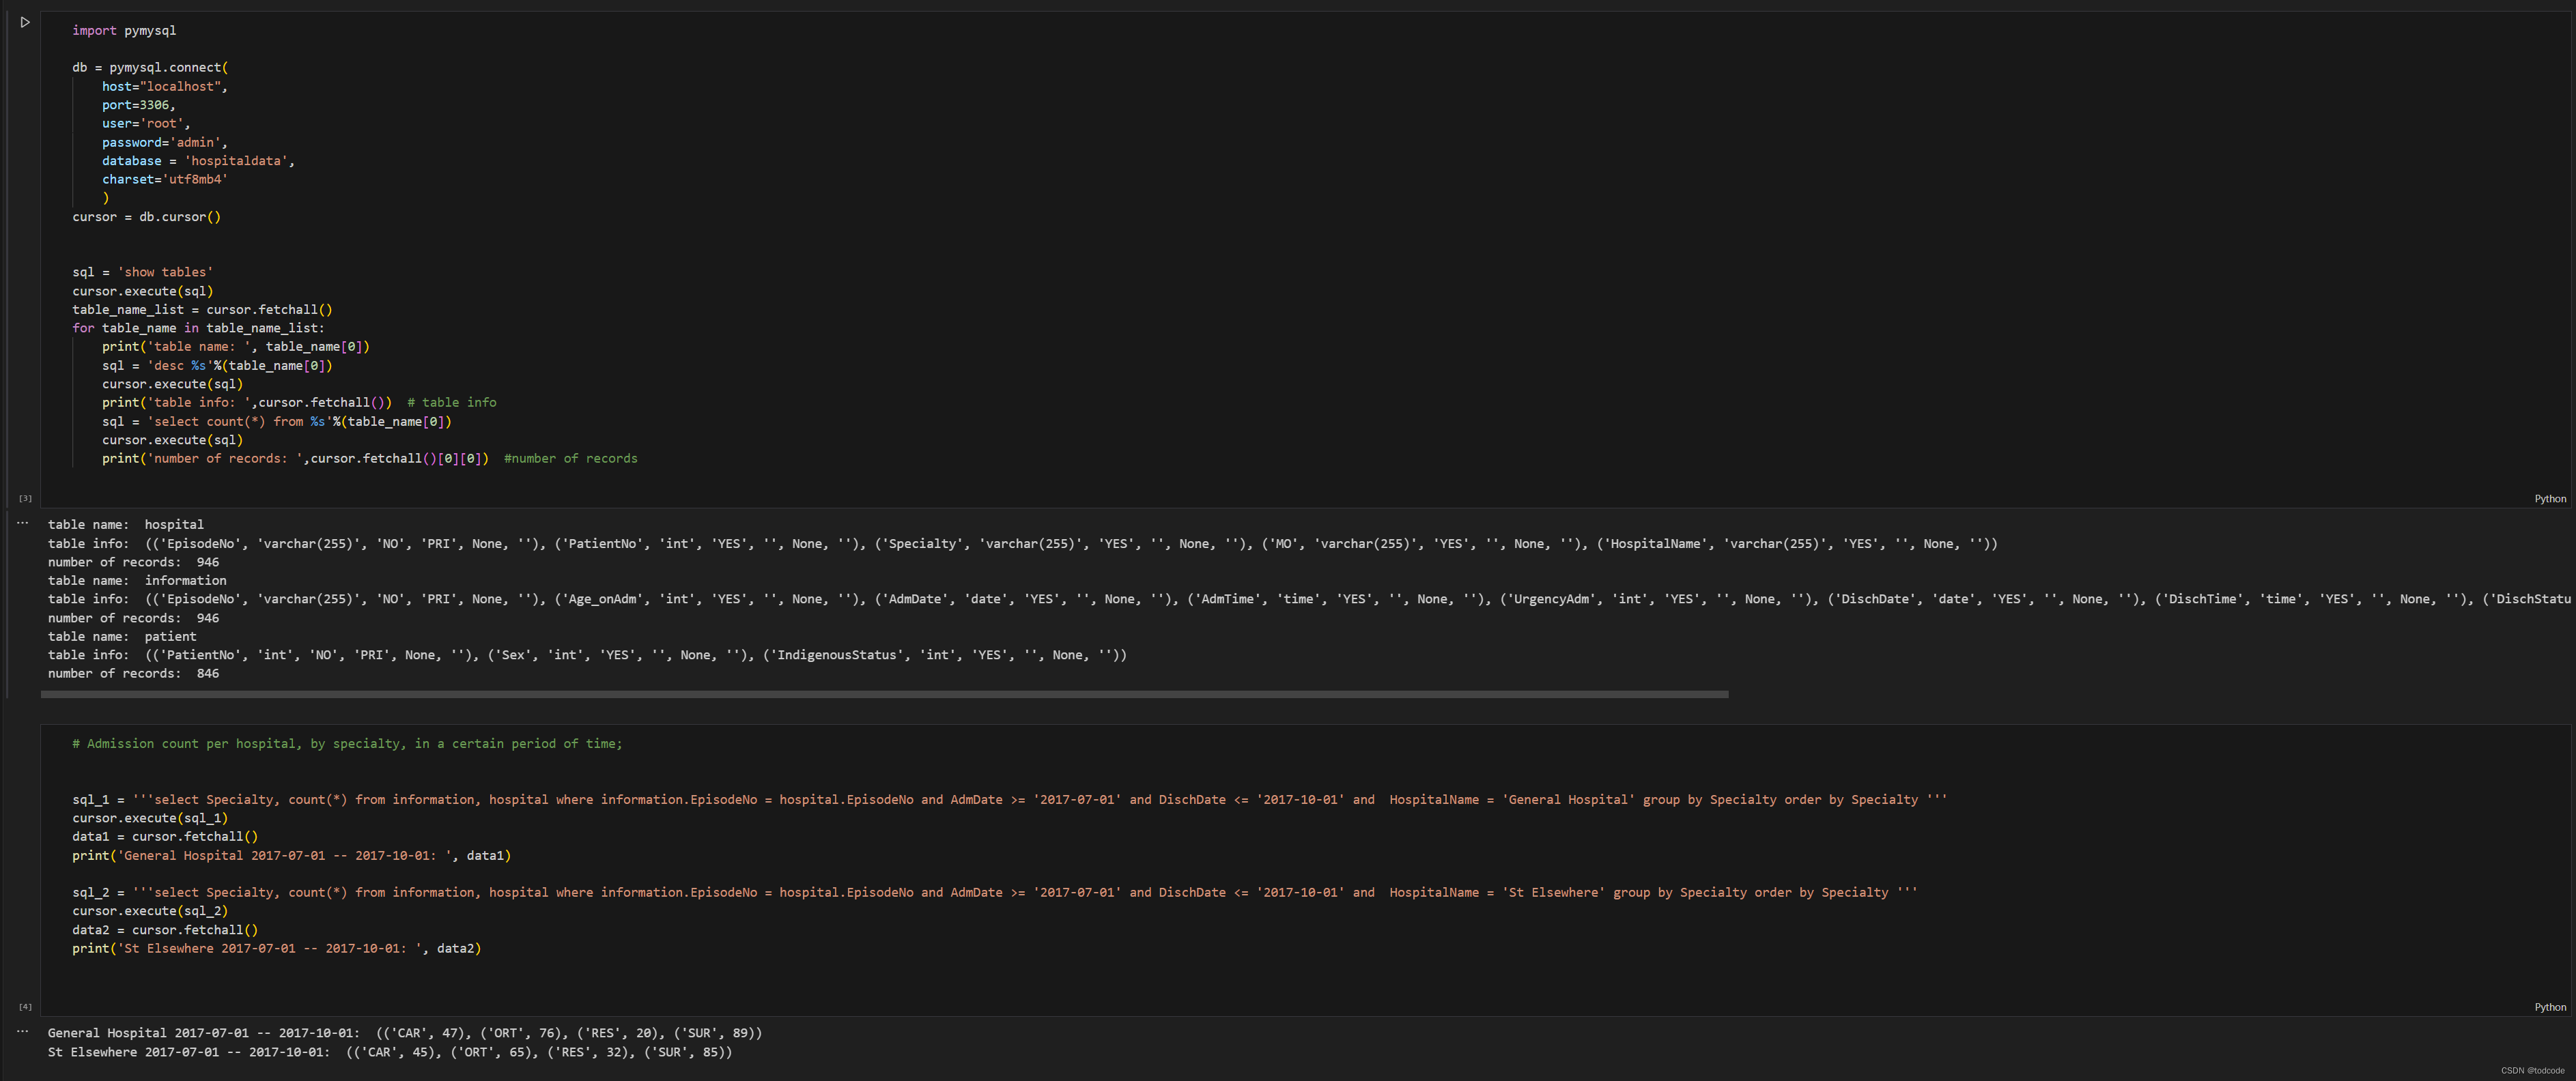
sql = 'show tables'
cursor.execute(sql)
table_name_list = cursor.fetchall()
for table_name in table_name_list:
print('table name: ', table_name[0])
sql = 'desc %s'%(table_name[0])
cursor.execute(sql)
print('table info: ',cursor.fetchall()) # table info
sql = 'select count(*) from %s'%(table_name[0])
cursor.execute(sql)
print('number of records: ',cursor.fetchall()[0][0]) #number of records
# Admission count per hospital, by specialty, in a certain period of time;
sql_1 = '''select Specialty, count(*) from information, hospital where information.EpisodeNo = hospital.EpisodeNo and AdmDate >= '2017-07-01' and DischDate <= '2017-10-01' and HospitalName = 'General Hospital' group by Specialty order by Specialty '''
cursor.execute(sql_1)
data1 = cursor.fetchall()
print('General Hospital 2017-07-01 -- 2017-10-01: ', data1)
sql_2 = '''select Specialty, count(*) from information, hospital where information.EpisodeNo = hospital.EpisodeNo and AdmDate >= '2017-07-01' and DischDate <= '2017-10-01' and HospitalName = 'St Elsewhere' group by Specialty order by Specialty '''
cursor.execute(sql_2)
data2 = cursor.fetchall()
print('St Elsewhere 2017-07-01 -- 2017-10-01: ', data2)
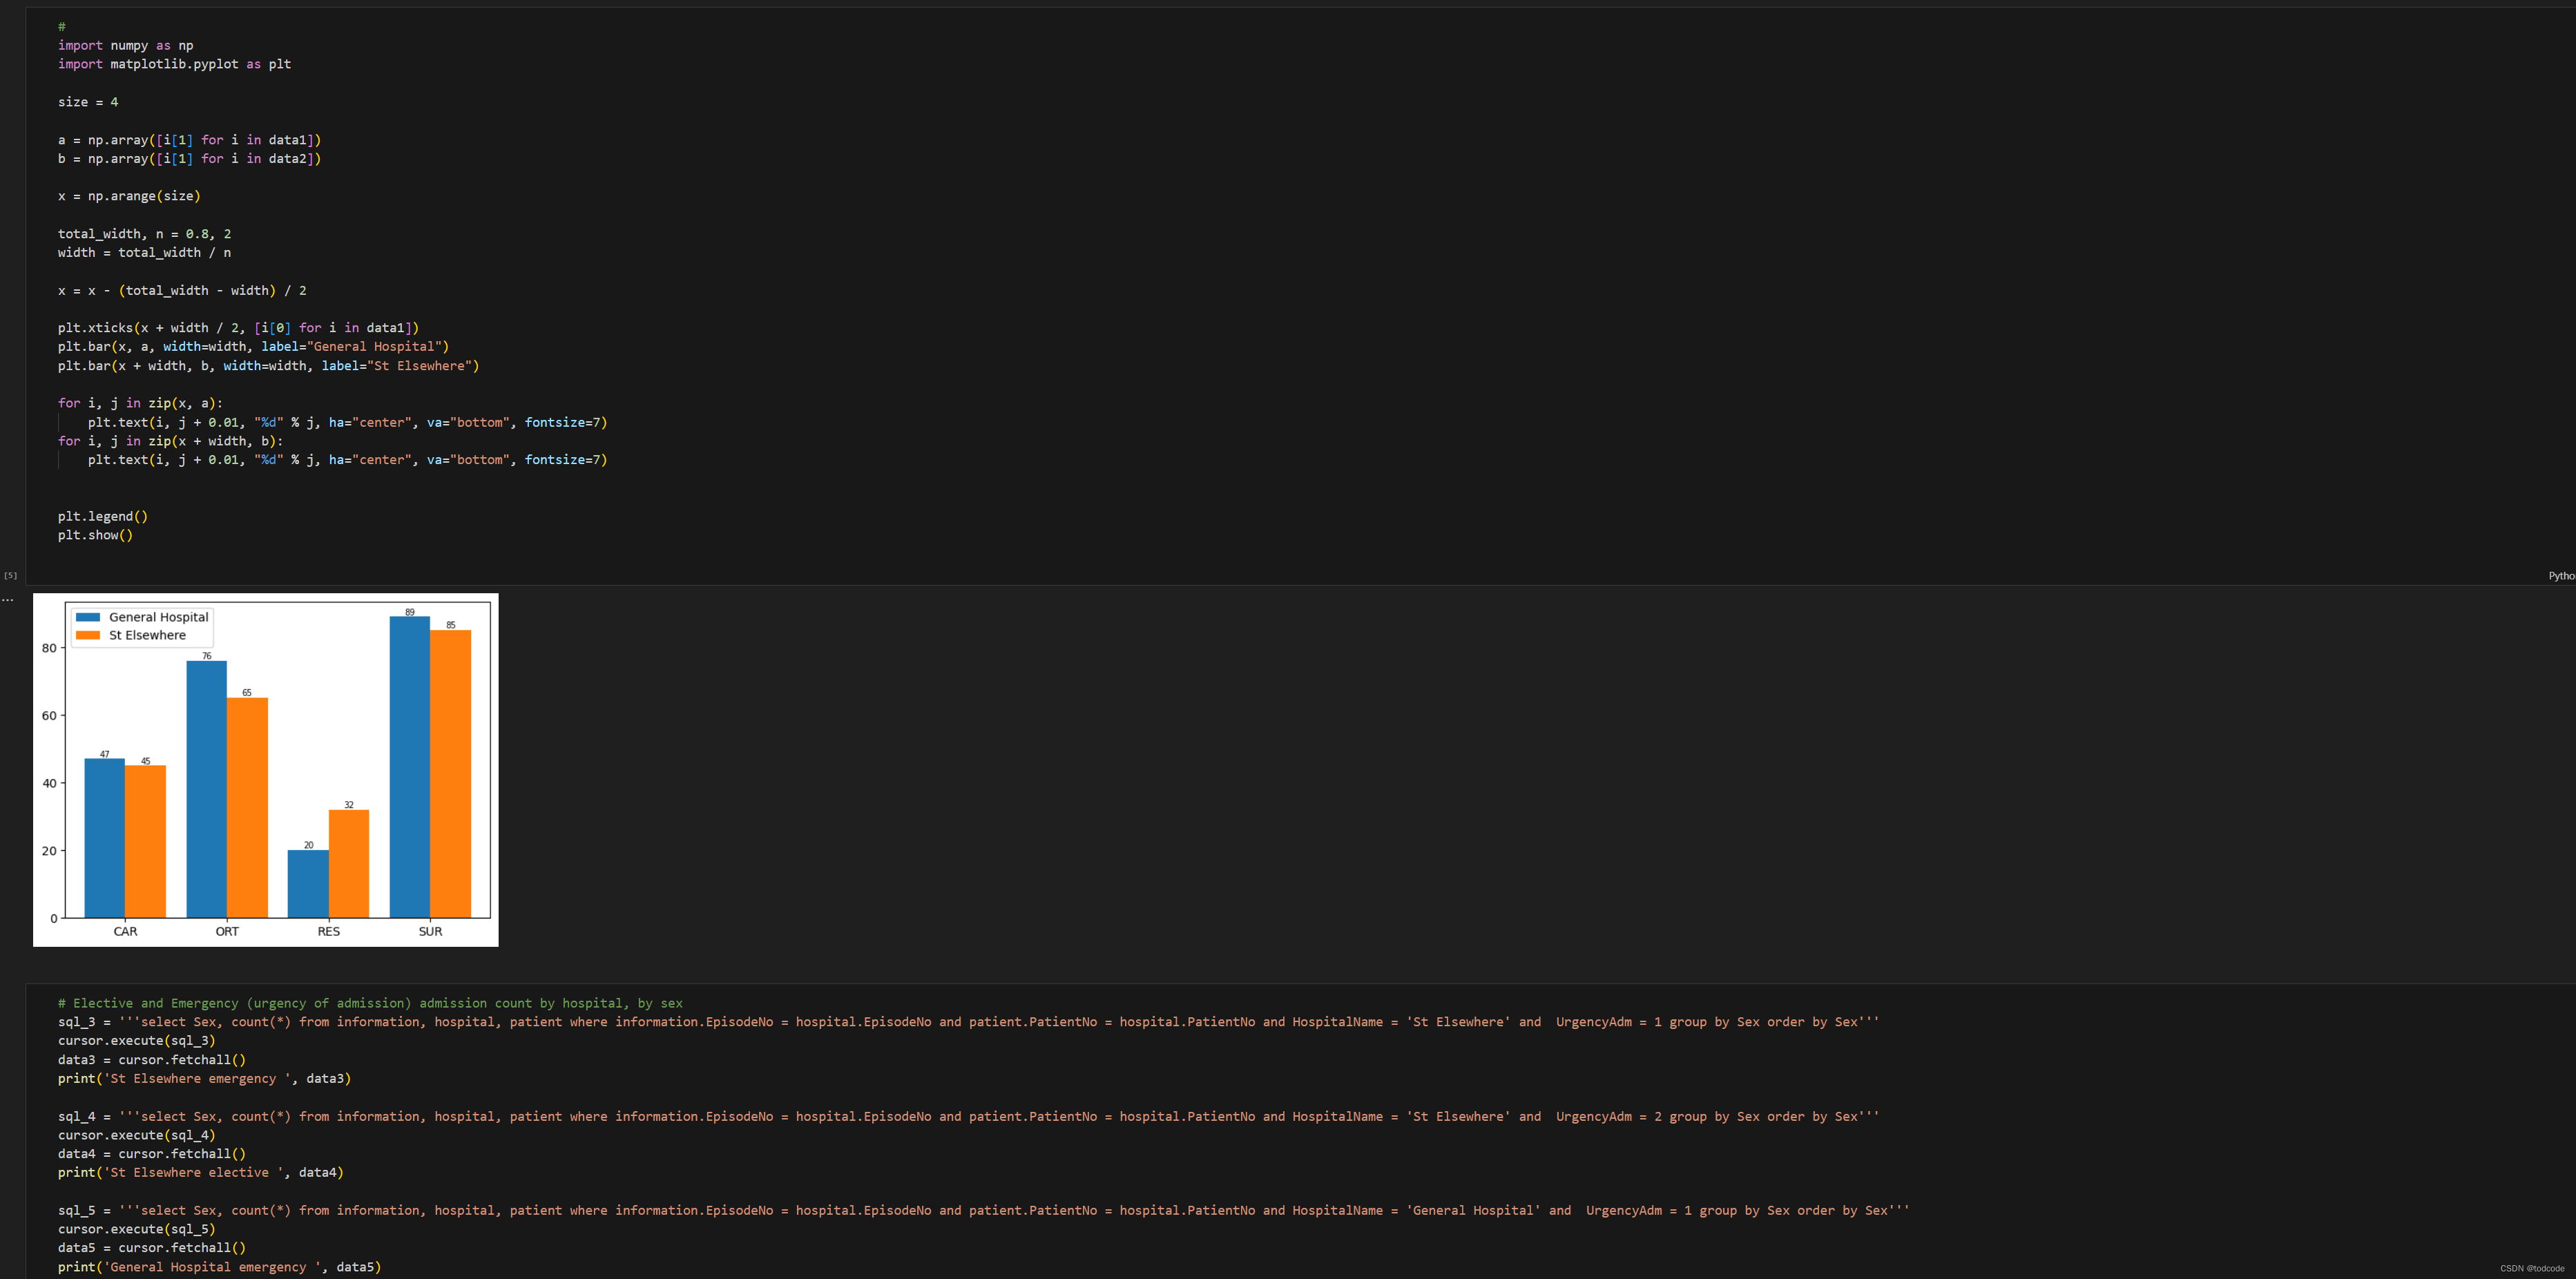
size = 4
a = np.array([i[1] for i in data1])
b = np.array([i[1] for i in data2])
x = np.arange(size)
total_width, n = 0.8, 2
width = total_width / n
x = x - (total_width - width) / 2
plt.xticks(x + width / 2, [i[0] for i in data1])
plt.bar(x, a, width=width, label="General Hospital")
plt.bar(x + width, b, width=width, label="St Elsewhere")
for i, j in zip(x, a):
plt.text(i, j + 0.01, "%d" % j, ha="center", va="bottom", fontsize=7)
for i, j in zip(x + width, b):
plt.text(i, j + 0.01, "%d" % j, ha="center", va="bottom", fontsize=7)
plt.legend()
plt.show()
# Elective and Emergency (urgency of admission) admission count by hospital, by sex
sql_3 = '''select Sex, count(*) from information, hospital, patient where information.EpisodeNo = hospital.EpisodeNo and patient.PatientNo = hospital.PatientNo and HospitalName = 'St Elsewhere' and UrgencyAdm = 1 group by Sex order by Sex'''
cursor.execute(sql_3)
data3 = cursor.fetchall()
print('St Elsewhere emergency ', data3)
sql_4 = '''select Sex, count(*) from information, hospital, patient where information.EpisodeNo = hospital.EpisodeNo and patient.PatientNo = hospital.PatientNo and HospitalName = 'St Elsewhere' and UrgencyAdm = 2 group by Sex order by Sex'''
cursor.execute(sql_4)
data4 = cursor.fetchall()
print('St Elsewhere elective ', data4)
sql_5 = '''select Sex, count(*) from information, hospital, patient where information.EpisodeNo = hospital.EpisodeNo and patient.PatientNo = hospital.PatientNo and HospitalName = 'General Hospital' and UrgencyAdm = 1 group by Sex order by Sex'''
cursor.execute(sql_5)
data5 = cursor.fetchall()
print('General Hospital emergency ', data5)
sql_6 = '''select Sex, count(*) from information, hospital, patient where information.EpisodeNo = hospital.EpisodeNo and patient.PatientNo = hospital.PatientNo and HospitalName = 'General Hospital' and UrgencyAdm = 2 group by Sex order by Sex'''
cursor.execute(sql_6)
data6 = cursor.fetchall()
print('General Hospital elective ', data6)
# by hospital
size = 2
a = np.array([data4[0][1]+data4[1][1], data6[0][1]+data6[1][1]])
b = np.array([data3[0][1]+data4[1][1], data5[0][1]+data6[1][1]])
x = np.arange(size)
total_width, n = 0.6, 2
width = total_width / n
x = x - (total_width - width) / 2
plt.xticks(x + width / 2, ['St Elsewhere','General Hospital'])
plt.bar(x, a, width=width, label="elective")
plt.bar(x + width, b, width=width, label="emergency")
for i, j in zip(x, a):
plt.text(i, j + 0.01, "%d" % j, ha="center", va="bottom", fontsize=7)
for i, j in zip(x + width, b):
plt.text(i, j + 0.01, "%d" % j, ha="center", va="bottom", fontsize=7)
plt.legend()
plt.show()
# by sex
size = 2
a = np.array([data4[0][1]+data6[0][1], data3[0][1]+data5[0][1]])
b = np.array([data4[1][1]+data6[1][1], data3[1][1]+data5[1][1]])
x = np.arange(size)
total_width, n = 0.6, 2
width = total_width / n
x = x - (total_width - width) / 2
plt.xticks(x + width / 2, ['Male','Female'])
plt.bar(x, a, width=width, label="elective")
plt.bar(x + width, b, width=width, label="emergency")
for i, j in zip(x, a):
plt.text(i, j + 0.01, "%d" % j, ha="center", va="bottom", fontsize=7)
for i, j in zip(x + width, b):
plt.text(i, j + 0.01, "%d" % j, ha="center", va="bottom", fontsize=7)
plt.legend()
plt.show()
cursor.close()
db.close()
数据分析部分代码


 1629
1629


 被折叠的 条评论
为什么被折叠?
被折叠的 条评论
为什么被折叠?
 到【灌水乐园】发言


