Matplotlib图像属性控制
色彩和样式
plt.plot(listKOIndex,listKO,'b-')
plt.plot(listKOIndex,listKO,'g--')
plt.plot(listKOIndex,listKO,'rD')
文字
plt.title('Stock Statistics of Coca-Cola')
plt.xlabel('Month')
plt.ylabel('Average Close Price')
其他属性
pl.figure(figsize=(8,6),dpi=100)
pl.plot(t,t,color='red',linestyle='-',linewidth=3,label='Line 1')
pl.legend(loc='upper left')
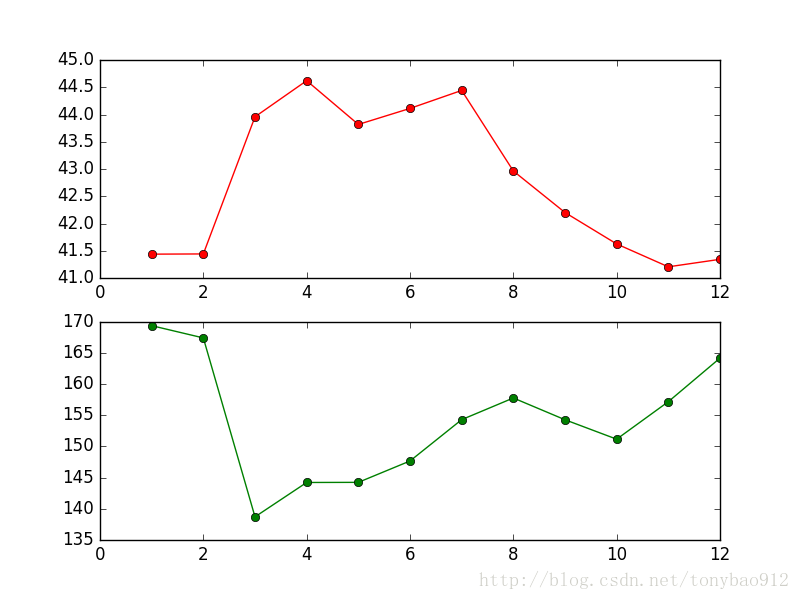
子图
subplots
plt.subplot(211)  #行、列、所在区域的编号 中间如需要,加逗号

plt.subplot(211)
plt.plot(listKOIndex,listKO,color='r',marker='o')
plt.subplot(212)
plt.plot(listIBMIndex,listIBM,color='green',marker='o')
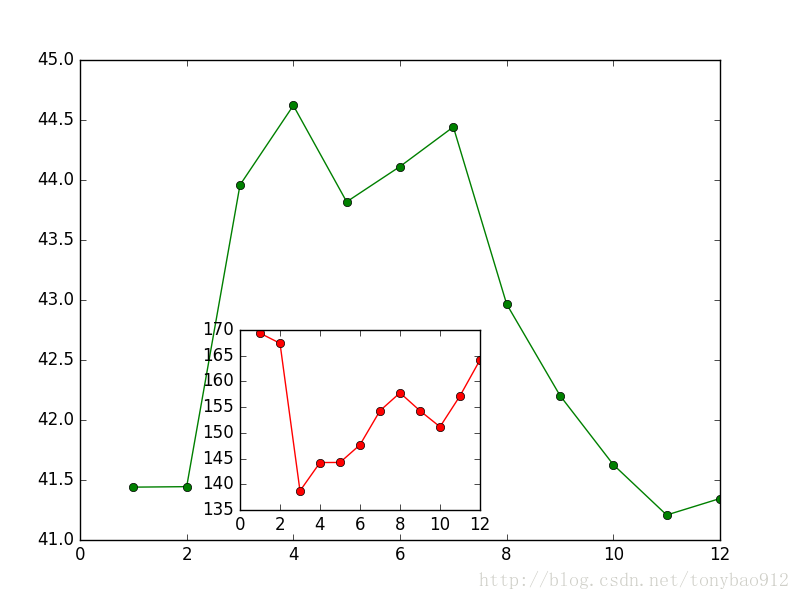
axes
- axes([left,bottom,width,height]) 参数范围为(0,1)
plt.axes([.1,.1,0.8,0.8])
plt.plot(listKOIndex,listKO,color='green',marker='o')
plt.axes([.3,.15,0.3,0.3])
plt.plot(listIBMIndex,listIBM,color='r',marker='o')


 3万+
3万+

 被折叠的 条评论
为什么被折叠?
被折叠的 条评论
为什么被折叠?
 到【灌水乐园】发言


