


 这篇博客记录了一位作者使用Python独立完成的项目,通过matplotlib库为每个数据文件绘制散点图并标出对象位置。文章详细介绍了如何画散点、圈圈、添加注释和设置刻度,并提供了读写文件的代码示例。
昨天第一次成功独立写了个自己的python程序,要把其中的细节都记下来。
一、总览
这次的需求是:
1) 给定文件夹中有一批数据文件;
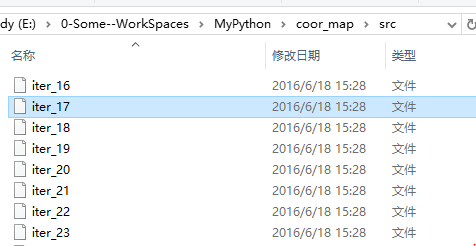
图1
2) 轮流读取每个文件;
3) 对每个文件要读取每一行;
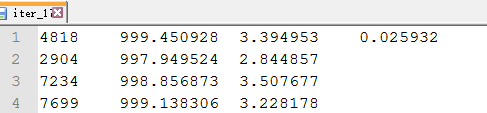
图1
4) 第一列是id,第二三列分别是x、y坐标;
5) 给每个文件用python画个图,标出该文件中所有id所表示的object的具体位置(第一个id还有radius,要画出它的圈圈),然后将此图存成png文件如下:
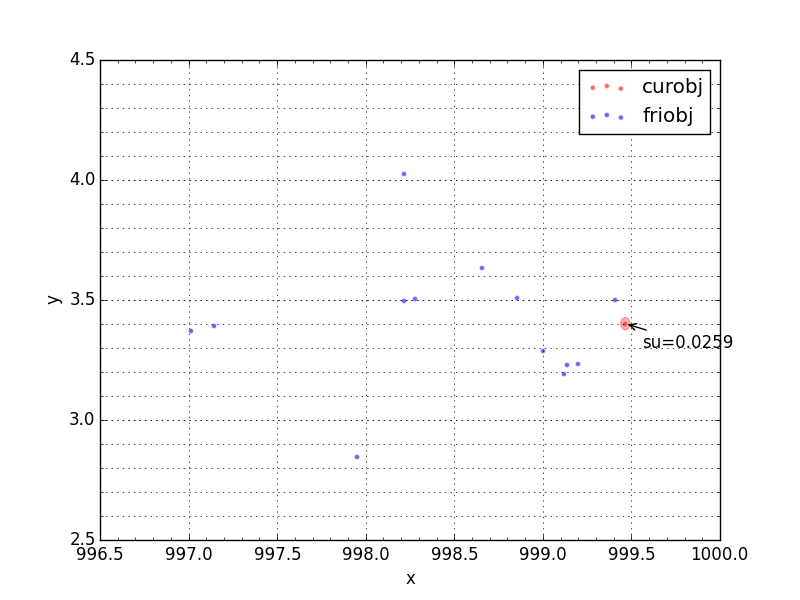
图1
6) 批量生成每个数据文件对应的png文件
最后的整个程序如下:
import os
import matplotlib.pyplot as plt
from matplotlib.ticker import MultipleLocator

SRC_DIR = "E:\\0-Some--WorkSpaces\\MyPython\\coor_map\\src"
DST_DIR = "E:\\0-Some--WorkSpaces\\MyPython\\coor_map\\dst"

for parent, dirs, files in os.walk(SRC_DIR):
    for f in files:
        fig = plt.figure()
        ax = fig.add_subplot(111)

        xmajorLocator = MultipleLocator(0.05)
        xminorLocator = MultipleLocator(0.01)

        ymajorLocator = MultipleLocator(0.05)
        yminorLocator = MultipleLocator(0.01)
       ax.xaxis.set_major_locator(xmajorLocator)
       ax.yaxis.set_major_locator(ymajorLocator)

        ax.xaxis.set_minor_locator(xminorLocator)
        ax.yaxis.set_minor_locator(yminorLocator)

        ax.xaxis.grid(True, which='major')
        ax.yaxis.grid(True, which='minor')

        file = os.path.join(parent, f)
        with open(file) as srcfile:
            lines = srcfile.readlines()
            count = -1
            for line in lines:
                if count == -1:
                    cur_id = int(line.split('\t')[0])
                    cur_x = float(line.split('\t')[1])
                    cur_y = float(line.split('\t')[2])
                    cur_rad = float(line.split('\t')[3])

                    color = 'red'
                    scale = 20
                    plt.scatter(cur_x, cur_y, color='red', s=scale, label='curobj', alpha=0.6, edgecolors='white')

                    circ = plt.Circle((cur_x, cur_y), cur_rad, color='r', alpha=0.3)
                    ax.add_patch(circ)

                    # add annotation
                    ax.annotate("su=" + str(cur_rad),
                                xy=(cur_x, cur_y), xycoords='data',
                                xytext=(cur_x+0.1, cur_y-0.1), textcoords='data',
                                arrowprops=dict(arrowstyle="->",
                                                connectionstyle="arc3"),
                                )

                else:
                    fri_id = line.split('\t')[0]
                    fri_x = line.split('\t')[1]
                    fri_y = line.split('\t')[2]

                    color = 'blue'
                    scale = 20
                    if count == 0:
                        plt.scatter(fri_x, fri_y, color='blue', s=scale, label='friobj', alpha=0.6, edgecolors='white')
                    else:
                        plt.scatter(fri_x, fri_y, color='blue', s=scale, alpha=0.6, edgecolors='white')

                count += 1

            plt.title('')
            plt.xlabel('x')
            plt.ylabel('y')
            plt.legend()
            plt.grid(True)

            dstfile = DST_DIR + os.path.sep + f + '.png'
            plt.savefig(dstfile)
            # plt.show()
二、画图
使用matplotlib当然首选看它的官方文档咯:
http://matplotlib.org/api/index.html
1、画散点
主要用到了scatter()函数,而如何画散点则主要是参考了大神“烂笔头”的http://note4code.com/2015/03/30/%E4%BD%BF%E7%94%A8matplotlib%E7%BB%98%E5%88%B6%E6%95%A3%E7%82%B9%E5%9B%BE/
对应的上面的代码部分如下:
color = 'red'
scale = 20
plt.scatter(cur_x, cur_y, c=color, s=scale, label='curobj', alpha=0.6, edgecolors='white')
前两个参数是该散点的x、y坐标,第三个参数是颜色,第四个参数是该点的大小,第五个参数是写在图例里的标签,第六个参数alpha好像是调亮度的,然后最后一个参数是边上的颜色
2、画圈圈
主要用的是plt.Circle()函数:
http://matplotlib.org/examples/shapes_and_collections/artist_reference.html
当然,有个非官方的也很好,专门讲画形状的:
https://nickcharlton.net/posts/drawing-animating-shapes-matplotlib.html
我用到的代码是:
circ = plt.Circle((cur_x, cur_y), cur_rad, color='r', alpha=0.3)
ax.add_patch(circ)
同样,指定中心坐标、半径,以及颜色等等
3、画注释
这里我主要参考的matplotlib的官方文档:http://matplotlib.org/users/annotations_intro.html,官方文档有各种 source code 以及结果图等可以尽情利用,真是好极了!
我的代码如下:
# add annotation
ax.annotate("su=" + str(cur_rad),
            xy=(cur_x, cur_y), xycoords='data',
            xytext=(cur_x+0.1, cur_y-0.1),
            textcoords='data',
            arrowprops=dict(arrowstyle="->",
            connectionstyle="arc3"),)
参数列表里,最后竟然留了个逗号,也是奇怪……
4、标刻度
因为有的时候坐标轴的刻度要是不对的话,那些点和圈圈都显示不出来,还会以为是代码出错了呢
设刻度主要是参考了一篇中文博客:http://blog.csdn.net/rumswell/article/details/6571005
我的代码如下:
xmajorLocator = MultipleLocator(0.05)
xminorLocator = MultipleLocator(0.01)

ymajorLocator = MultipleLocator(0.05)
yminorLocator = MultipleLocator(0.01)
       ax.xaxis.set_major_locator(xmajorLocator)
       ax.yaxis.set_major_locator(ymajorLocator)

        ax.xaxis.set_minor_locator(xminorLocator)
        ax.yaxis.set_minor_locator(yminorLocator)

ax.xaxis.grid(True, which='major')
ax.yaxis.grid(True, which='minor')
一二行是定义x轴的‘主刻度’和‘次刻度’,三四行是定义y轴的‘主刻度’和‘次刻度’,后面的就是真正将四个刻度设置生效
三、读写文件
我这里是要遍历某目录下的所有文件。所以,
首先,把要读取的源文件夹和要写入的目标文件夹定义好:
SRC_DIR = "E:\\0-Some--WorkSpaces\\MyPython\\coor_map\\src"
DST_DIR = "E:\\0-Some--WorkSpaces\\MyPython\\coor_map\\dst"
当然,一个较好的习惯是还生成 log 文件,就定义一个 LOG_DIR。
然后,遍历源目录下的所有文件,用for循环就可以对每个文件进行处理了,之后打开一个源文件和一个目标文件,分别进行读写:
file = os.path.join(parent, f)
        with open(file) as srcfile:
            lines = srcfile.readlines()
我这里没有打开目标文件,而是在后面定义的:
dstfile = DST_DIR + os.path.sep + f + '.png'
plt.savefig(dstfile)
因为这里是要保存png的图片,所以plt.savefig(dstfile)中的‘dstfile’得是一个字符串,而不是像写文本文件一样,用dstfile.write()就可以了,所以,在上面代码中的 with 后面打开‘open(DST_DIR + os.path.sep + f, “w+”) as dstFile’是没用滴
大概记录到这儿


 2801
2801

 被折叠的 条评论
为什么被折叠?
被折叠的 条评论
为什么被折叠?
 到【灌水乐园】发言


